
|
|
1.IntroductionSecond harmonic generation (SHG) imaging is a minimally invasive optical imaging technique with intrinsic optical sectioning capability.1–3 The coherent nature of SHG leads to an intensity that is sensitive to the noncentrosymmetric arrangements of molecules4 and in biomedical applications, SHG has been shown to be effective in imaging fibrous collagen-rich tissues such as tendons, cartilage, and cornea.5,6 Specifically, SHG microscopy has been successfully used in the label-free identification of structural changes in connective tissues under conditions such as skin photoaging, corneal abnormalities (keratoconus), liver fibrosis, and Osteogenesis imperfecta.7 In tissue engineering applications, SHG imaging has been useful in the quantification and monitoring of collagen growths in engineered cartilage tissues.8–11 However, most efforts in using SHG imaging have focused on morphological characterization rather than quantification of the structural motifs of the fibrous structures. Therefore, combining SHG imaging with the appropriate methodology to quantify fiber structure can lead to objective evaluation in their structural organization. Recently, two-dimensional discrete Fourier transform (2D-FFT) has been shown to be an effective tool in analyzing fibril organization.12,13 In particular, the average orientation and anisotropy of fiber tissue within any given region of interest (ROI) can be determined using 2D-FFT transformation. Both of these parameters vary with the domain size of analysis and the variation can be viewed as a quantitative standard to monitor changes in the fibrous tissues. However, in previous studies, the sizes of the imaging area used for 2D-FFT analysis are usually subjectively chosen.13 Therefore, the major purpose of the present study was to introduce a systematic approach to investigate the effect of the size of the analyzed region on the Fourier transformation analysis. In addition to local fiber orientation and aspect ratio, we introduce a quantitative parameter evaluating the correlation between the orientations of neighboring domains. For this purpose, the Ising-like order parameter was calculated for the fiber angular matrices. In addition to normal connective tissues, we show that our approach can be used to differentiate between normal and pathological fiber orientations in the cornea. 2.Materials and Methods2.1.Sample PreparationExcised pieces of rat tail tendon (RTT), mouse skin (MS), bovine cornea (BC), normal human cornea (NHC), and human keratoconic cornea (KHC) were used in this study. RTT and MS were prepared from unfrozen tissues, and BC was freshly obtained from a local market and prepared within an hour prior to experiment. Keratoconic corneas were obtained from surgeries of penetrating keratoplasty from a local hospital. Two samples of NHCs were obtained postmortem (Minnesota Lions Eye Bank, MN), transferred frozen, prepared, and imaged within 3 h after thawing. Prior to multiphoton examination, corneal specimens were stored in 20% dextran/PBS solution for about an hour (dextran T500, Pharmacosmos, Denmark) to avoid swelling. All specimens were sealed in glass well slides to avoid dehydration. 2.2.Second Harmonic Generation MicroscopeThe SHG microscope used in this study has been described previously.8–10 In short, an 80 MHz, 100-fs laser pulse from a ti-sa oscillator (Tsunami, Spectral Physics, Mountain View, CA) tuned to 780 nm was used as the excitation source. The laser beam, directed by scanning mirrors, was expanded and reflected onto the back aperture of the focusing objective by a short pass dichroic mirror (700dcspxruv-2p, Chroma Technology, Rockingham, VT). The oil-immersion objective (, S Fluor, NA1.3, Nikon, Japan) was used for imaging the RTT and MS, while for the corneas the water-immersion objective was used (, S Flour, NA 0.8, Nikon, Japan). For RTT and MS, the SHG signal from the sample was collected in the backward direction by the focusing objective and further guided by a dichroic mirror (435DCXR, Chroma technology), whereas SHG from corneas was detected in forward geometry using collection lens (, Chroma). In both cases, the SHG signals were isolated by a narrow band pass filter (HQ390/22m-2p, Chroma technology), and detected by photomultiplier tubes (R7400P, Hamamatsu, Japan). 2.3.SHG Image AcquisitionSHG images were acquired at the depths of approximately 15 μm from the surface of sample for RTT and MS. An automatic translation stage was used to translate the specimen following the acquisition of small-area images (, ). These adjacent images were subsequently stitched to form large-area images. The large-area images were ( tiles) for RTT, ( tiles) for MS, and ( tiles) for NHC. All imaging experiments were conducted at the ambient temperature of 19°C. 2.4.Fiber Orientation AnalysisTo perform fiber organization analysis, the images were first divided into equally sized domains. Next, 2D-FFT was performed on each domain. To demonstrate our approach, we first applied our method on an artificially created fibrous pattern () composed of adjacent domains, each in size, with mutually orthogonal fibrous patterns in adjacent domains [Fig. 1(a) to 1(d)]. Next, the pattern was arbitrarily subdivided into domains of various sizes of , , , and in Fig. 1(a) to 1(d), respectively. The 2D-FFT analysis was applied on each subdivided domain, and the corresponding transformed images in the Fourier domain are shown in Fig. 1(a*) to 1(d*) in green. This procedure then was followed by a single pixel erosion-dilation process in order to smooth and delineate the contours of the transformed image.14 Quantification of the fiber geometry was then performed by fitting by an ellipse [shown in red in Fig. 1(a*) to 1(d*)] which allows the characterization of each domain by two parameters: (1) the angle between horizontal axis and the short axis of the ellipse, and (2) the aspect ratio (AR) between the short and long axes of the ellipse. The orientation of the short axis of the ellipse for each domain is shown by the white lines in Fig. 1(a) to 1(d). Since it is known that the short axis of the fitted ellipse is parallel to the average fiber orientation within each domain and that the AR describes the directional anisotropy, orientation properties associated with the fibers in each subdivided domain can be determined.13 Fig. 1The use of different domain sizes for 2D-FFT analysis of an artificially produced pattern image. The images on the left show the division of the pattern image into domain sizes of (a) , (b) , (c) , and (d) . The corresponding Fourier transforms of the each region are, respectively shown in right along with the fitted ellipses [(a*) to (d*)]. The direction of the short axis of the fitted ellipse is shown by white lines for each domain in (a) to (d). The calculated average AR is also shown on corresponding images.  In this example, when fibers within each domain lie along the same direction, the 2D-FFT analysis accurately reflects the direction of the fiber orientation [Fig. 1(a) and 1(c)]. However, when the domain contains fibers along two orthogonal directions, the FFT analysis then reflects the average orientation of the fibers within the domain. Note, that in the latter case AR values are comparatively bigger [Fig. 1(b) and 1(d)]. According to our estimate, for a good correlation between the pattern line directions on images and those estimated from 2D-FFT the average AR value should be less than 0.5. Note that this criterion, as well as the optimal domain sizes, would depend on the characteristic extent of correlation in organization and needs to be derived for each case. In the case of collagen fiber factors, such as tissue type, image quality, resolution, and contrast would matter. Once these parameters are fixed, the corresponding estimate can be used unambiguously henceforth. 2.5.Correlation ParameterIn addition to performing FFT analysis, we determined the collinearity of directions between adjacent domains through the use of two-dimensional the Ising-like order parameter15 where is number of domains, is scalar product of unit vectors and , which represent orientations of and (, ) domains with tilt angles (, . Specifically, is an analog of configuration energy in the XY model of the nearest neighbor case without external field.16 can be used to quantify overall directional dispersion, hence it provides a numerical value of image turbidity. Since for our case, may be written asTherefore, represents the nearest neighbor correlation between domains, allowing us to describe the whole image with a single parameter. Theoretically, takes on values between and 1, where stands for a completely random orientation of domains without any correlations, represents the case of an image with parallel domains and, finally, corresponds to the case of perfectly orthogonal neighbors, i.e., we have completely anti-correlated alignment. Calculation of the order parameter was performed using custom IDL (IDL 6.4, ITT Visual Information Solutions, CO), Wolfram Mathematica (WM 8, Wolfram Research, Inc., IL), and MS VBA (MS Office Plus 2010, Microsoft Corporation, WA) software. 3.Results and DiscussionFollowing a demonstration of our method with an arbitrarily generated pattern in Fig. 1, we applied our approach to more complicated fibrous tissues acquired through SHG imaging. Shown in Fig. 2(a) to 2(d) are the SHG images of RTT, MS, BC, and NHC, respectively. Next, the corresponding images were subdivided into different domains (each , ) in which 2D-FFT was performed [Fig. 2(a*) to 2(d*)]. In these examples, since the fibers are not perfectly aligned along a given direction within each domain, the AR values derived from the fitted ellipses of the FFT image would increase compared to the case of perfectly aligned fibers. Also shown in Fig. 2(a*) to 2(d*) are red lines corresponding to the derived average fiber orientation within each domain. Fig. 2SHG intensity images of (a) RTT, (b) MS, (c) BC, and (d) NHC. Shown in (a*) to (d*) are the corresponding 2D-FFT analysis within the chosen domains (each or ). The bar on images is 40 μm. 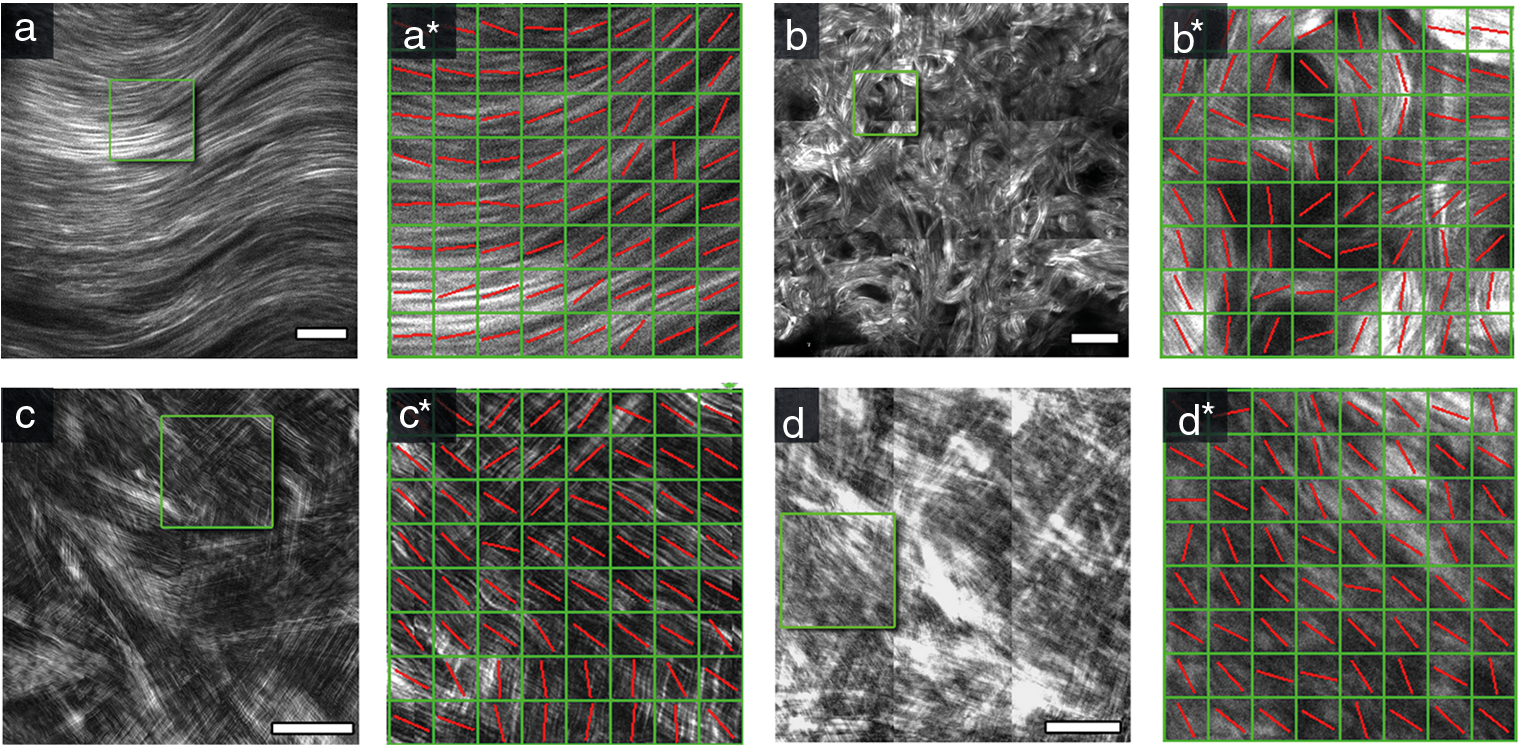 As in the case of the arbitrarily generated fibrous pattern, the result of the 2D-FFT analysis is highly dependent on the size of the domain chosen. With a reasonably small domain size, the local fiber orientation can be better determined. However, a domain size too small would contain an insufficient amount of information of fiber morphology for accurate determination of fiber direction. With a large domain size, the 2D-FFT analysis would yield an average orientation within the domain and details of local fiber orientation would be lost. To demonstrate these features, 2D-FFT analysis was performed using a range of domain sizes from to which corresponded to actual image size of to , respectively. Following the analysis, the average AR values were obtained from all domain sizes and the results are shown in Fig 3. In the cases of MS and RTT, the AR values are the result of averaging 10 images taken from 2 specimens; 5 from each. In the case of BC, ARs from images obtained at 10 different depths at 100 μm apart are averaged. NHC data represent values from forward SHG images obtained at 6 depths, 100 μm apart obtained from 2 specimens. A two-sided student’s t-test was used to compare parameters obtained for different specimens and the level of statistical significance was calculated using IBM SPSS software (Chicago, IL). Fig. 3Dependence of averaged ARs on the domain size chosen for 2D-FFT analysis of SHG images acquired from MS, RTT, BC, and NHC. Average ARs for MS and RTT are the results obtained from 5 images; averages from 10 images were calculated for BC and NHC. SHG images of corneas were obtained in the forward direction.  As Fig. 3 shows, the minima of the averaged AR values occur when the domain sizes are between and (corresponding to and ). Furthermore, the ARs of different fibrous architectures show similar trends at domain sizes below that at minimum AR. This observation is indicative of the fact that when domain size is decreased, the determination of general fiber orientation becomes erroneous. On the other hand, increasing the domain sizes will result in the inclusion of too many details of local fiber orientations, hence the averaging and loss of information on fine structure. However, as domain size increases beyond the point of minimum AR, our analysis starts to reveal differences between the different tissue morphologies. First, note that for the case of RTT, a relatively low AR value () was obtained for domain size (). This is indicative of the fact that collagen fibers in RTT specimens are well aligned. Note that at large domain sizes, the ARs for the four tissue types approached different terminal values of (RTT), (MS), (BC), and (NHC). Our results indicate the different collagen-containing tissues possess different degrees of short- and long-term order in organization. Based on derived directional maps, we determined the Ising-like model correlation parameter according to Eq. (3). The average correlation parameter, calculated for different tissue types using the domain size at maximal AR value for the different tissues are presented in Table 1. Our results show that the calculated correlation parameters are consistent with the overall image morphology ranging from as low as for the more random organization in MS dermis up to for the highly organized RTT (). Table 1Average correlation parameter of different tissue types.
As a final example of the potential applicability of our method in distinguishing normal and pathological tissues, we applied the 2D-FFT approach to analyze collagen fiber morphology in normal and pathological human corneas. Specifically, both forward SHG images from normal and keratoconical human corneas were obtained and analyzed. Representative large area images of normal and keratoconus cornea obtained at the depth of 100 μm are shown in Fig. 4(a) and 4(b). Slit-lamp examination of the keratoconus sample revealed a scar, which introduced additional turbidity into the orientation of collagen fibers of this sample [Fig. 4(b)]. The correlation parameter was calculated for entire images obtained at 6 depths for each specimen. AR values were calculated for different domain sizes and the minimum was determined to be () for KHC and () for NHC. Figure 4(a*) and 4(b*) show 2D-FFT analysis results of arbitrarily chosen ROIs from images 4(a) and 4(b) using the domain sizes corresponding to minimum average AR. Fig. 4Representative FSHG images of normal and keratoconus human corneas, as well as fiber orientation analysis of arbitrary selected ROIs from these images. (a) FSHG of NHC and (b) FSHG of KHC. (a*) and (*b) are results of 2D-FFT analysis of ROIs outlined in (a) and (b), respectively, analyzed using domain size of for NHC and for KHC. FSHG images were acquired at 100 μm depth.  In addition, the calculated average correlation parameters for the entire area of normal and keratoconus cornea images are shown in Fig. 5. The average correlation parameters corresponding to domain size of minimum AR values are and for normal and keratoconus corneas, respectively (). This serves as an example of the quantification of image morphology and shows that quantitative comparison of differences of fiber order can be performed. 4.ConclusionIn this study, 2D-fast Fourier transform analysis was developed and applied for morphological analysis of SHG images of different connective tissues. An approach, based on average AR estimation was developed, which allows for the evaluation of actual fiber directions. We found that both the aspect ratios and correlation parameter can be used to quantify differences in tissue morphology. While the aspect ratio analysis characterizes local fiber orientation within the ROI domains, the correlation parameter is effective in revealing the orientation order among the ROIs. To avoid ambiguity, our analysis was performed on systematically selected ROI sizes and we found that the dependence of AR and correlation parameters on ROI sizes can be used as additional metrics for characterization fiber orientation. In addition, to distinguish fiber morphologies in normal tissues such as RTT, MS, or BC, we found that organizational differences between normal and pathological cornea (keratoconus) can be achieved. The demonstrated approach can be used for automated morphological analysis of tissue fibers and may be extended for diagnostic purposes. AcknowledgmentsWe acknowledge the support of the National Science Council in Taiwan (NSC 98-2112-M-002-008-MY3, NSC 99-2221-E-002-096-MY3), the National Health Research Institutes (NHRI-EX100-10041EI), the Center for Quantum Science and Engineering (10R80914-1), and the National Taiwan University (10R70804). Additional support was provided by the World Class University Program of the National Research Foundation of Korea, funded by the Ministry of Education, Science, and Technology, South Korea (grant No. R31-2008-000-20004-0). ReferencesP. J. CampagnolaL. M. Loew,
“Second-harmonic imaging microscopy for visualizing biomolecular arrays in cells, tissues and organisms,”
Nat. Biotechnol., 21
(11), 1356
–1360
(2003). http://dx.doi.org/10.1038/nbt894 NABIF9 1087-0156 Google Scholar
A. ZoumiA. YehB. J. Tromberg,
“Imaging cells and extracellular matrix in vivo by using second-harmonic generation and two-photon excited fluorescence,”
Proc. Natl. Acad. Sci. U. S. A., 99
(17), 11014
–11019
(2002). http://dx.doi.org/10.1073/pnas.172368799 PNASA6 0027-8424 Google Scholar
W. R. Zipfelet al.,
“Live tissue intrinsic emission microscopy using multiphoton-excited native fluorescence and second harmonic generation,”
Proc. Natl. Acad. Sci. U. S. A., 100
(12), 7075
–7080
(2003). http://dx.doi.org/10.1073/pnas.0832308100 PNASA6 0027-8424 Google Scholar
L. Moreaux,
“Coherent scattering in multi-harmonic light microscopy,”
Biophys. J., 80
(3), 1568
–1574
(2001). http://dx.doi.org/10.1016/S0006-3495(01)76129-2 BIOJAU 0006-3495 Google Scholar
A. T. Yehet al.,
“Selective corneal imaging using combined second-harmonic generation and two-photon excited fluorescence,”
Opt. Lett., 27
(23), 2082
–2084
(2002). http://dx.doi.org/10.1364/OL.27.002082 OPLEDP 0146-9592 Google Scholar
P. Stolleret al.,
“Polarization-modulated second harmonic generation in collagen,”
Biophys. J., 82
(6), 3330
–3342
(2002). http://dx.doi.org/10.1016/S0006-3495(02)75673-7 BIOJAU 0006-3495 Google Scholar
S. J. Linet al.,
“Evaluating cutaneous photoaging by use of multiphoton fluorescence and second-harmonic generation microscopy,”
Opt. Lett., 30
(17), 2275
–2277
(2005). http://dx.doi.org/10.1364/OL.30.002275 OPLEDP 0146-9592 Google Scholar
V. Hovhannisyanet al.,
“Photophysical mechanisms of collagen modification by 80 MHz femtosecond laser,”
Opt. Express, 18
(23), 24037
–24047
(2010). http://dx.doi.org/10.1364/OE.18.024037 OPEXFF 1094-4087 Google Scholar
Y. Sunet al.,
“Imaging tissue engineering scaffolds using multiphoton microscopy,”
Microsc. Res. Tech., 71
(2), 140
–145
(2008). http://dx.doi.org/10.1002/(ISSN)1097-0029 MRTEEO 1059-910X Google Scholar
W. L. Chenet al.,
“Multiphoton imaging and quantitative analysis of collagen production by chondrogenic human mesenchymal stem cells cultured in chitosan scaffold,”
Tissue Eng. C, 16
(5), 913
–920
(2010). http://dx.doi.org/10.1089/ten.tec.2009.0596 1937-3341 Google Scholar
P. J. Suet al.,
“The discrimination of type I and type II collagen and the label-free imaging of engineered cartilage tissue,”
Biomaterials, 31
(36), 9415
–9421
(2010). http://dx.doi.org/10.1016/j.biomaterials.2010.08.055 BIMADU 0142-9612 Google Scholar
R. A. RaoM. R. MehtaK. C. Toussaint,
“Fourier transform-second-harmonic generation imaging of biological tissues,”
Opt. Express, 17
(17), 14534
–14542
(2009). http://dx.doi.org/10.1364/OE.17.014534 OPEXFF 1094-4087 Google Scholar
P. Matteiniet al.,
“Photothermally-induced disordered patterns of corneal collagen revealed by SHG imaging,”
Opt. Express, 17
(6), 4868
–4878
(2009). http://dx.doi.org/10.1364/OE.17.004868 OPEXFF 1094-4087 Google Scholar
S. W. Smith, The Scientist and Engineer’s Guide to Digital Signal Processing, 626 1st ed.California Technical Pub., San Diego, California
(1997). Google Scholar
R. J. Baxter,
“The inversion relation method for some two-dimensional exactly solved models in lattice statistics,”
J. Stat. Phys., 28
(1), 1
–41
(1982). http://dx.doi.org/10.1007/BF01011621 JSTPSB 0022-4715 Google Scholar
P. M. ChaikinT. C. Lubensky, Principles of Condensed Matter Physics, 699 Cambridge University Press, Cambridge, New York, NY
(1995). Google Scholar
|


