|
|
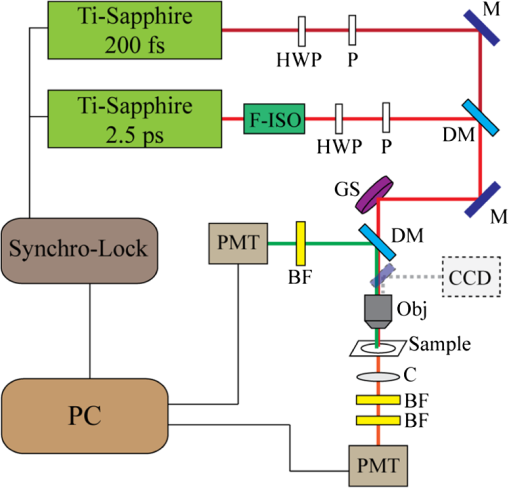
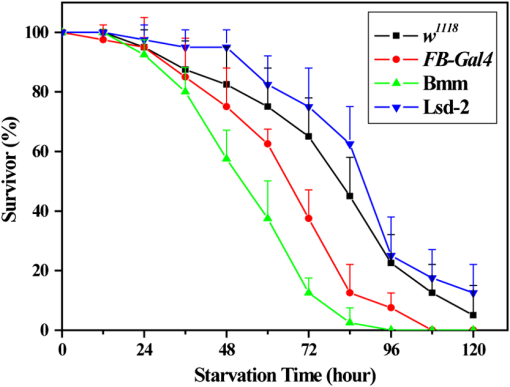
1.IntroductionComplex organisms require proper coordination of energy metabolism to cope with environmental conditions. Since lipid serves as an important source of energy, lipid regulation plays a critical role during fluctuation of food availability. This involves coordination of several organs such as the central nervous system, adipose tissue, and liver, as well as metabolic modulation between lipid expenditure and storage.1 It is known that imbalance of lipid metabolism lead to many diseases including obesity and diabetes.2 Understanding of lipid regulation in organisms can help us find the solution to these problems. Drosophila, one of the most valuable model animals, is a good candidate for the studies of lipid metabolism.3–5 Drosophila mainly stores neutral lipid in the fat body, a specialized organ analogous to the adipose tissue in mammals. The fat body supplies essential energy during larval development and is involved in lipid metabolism and hormone production.6 When the food is deprived, lipid is released from the fat body and then processed in another specialized cell called oenocyte, analogous to the hepatocyte in mammals.7 Larval oenocytes communicate with the fat body to perform lipid regulation and accumulate lipid during starvation. Many orthologues of human lipid-metabolizing genes are specifically expressed in oenocytes.7 Considering the conservation and similarity between Drosophila and humans, the fat body and oenocytes in Drosophila provide a suitable platform in modeling human lipid metabolism and metabolic disease.7,8 The PAT (Perilipin, ADRP, and TIP47) family of lipid-droplet-associated proteins are key players in lipid metabolic pathways and have five members in mammals: PERILIPIN1, PERILIPIN2,…, PERILIPIN5.9,10 In Drosophila, the genetic homolog of mammalian PERILIPIN1 and PERILIPIN2 are lipid storage droplet-1(Lsd-1) and Lipid storage droplet-2 (Lsd-2).11–15 Lsd-2 localizes at the surface of Drosophila lipid droplets (LDs) and participates in normal lipid storage.12 Overexpression of Lsd-2 in the fat body results in higher triacylglycerol (TAG) level and obesity phenotype in adult flies, and these obese flies are more resistant to starvation than control wild-type flies.12 On the other hand, the Brummer lipase (Bmm), which is the homolog of mammalian adipocyte triglyceride lipase (ATGL), promotes lipolysis and lipid mobilization in LDs.16 Overexpression of Bmm in the fat body decreases TAG content in adult flies. Lsd-2 and Bmm act in an antagonistic manner to regulate the balance between lipid storage and lipolysis in LDs.16 Conventionally, people use stains like Oil Red O7 to visualize LDs in Drosophila. However, it requires careful fixation and staining procedures and is restricted to fixed tissues or cells, which is not applicable for live imaging. Although there are some vital dyes such as Nile Red and BODIPY for neutral lipid imaging in living cells,17,18 their accuracy for in vivo lipid imaging is still questionable.19,20 For in vivo imaging, people usually label fluorescent fusion proteins specifically on the surface of LDs.21 In addition to the well-developed genetic modulation methods and biochemical assays, the advances of imaging techniques allow us to visualize neutral lipid in living Drosophila without any labeling.22–26 One of them is coherent anti-Stokes Raman scattering (CARS) microscopy.25 Because CARS is much stronger than conventional Raman scattering, it is more applicable to form image contrast of vibrational modes in microscopy without the need of fluorescence.27 CARS microscopy was first reported in 198228 and became popular after 1999 with the adoption of advanced lasers and collinear optical design.29 Because of high density of C-H bond in lipid molecules, it is often used for lipid imaging without labeling in biomedical researches. CARS microscopy has been applied to analysis of tissues/organs from mouse,30–37 human,38–40 and for in vivo imaging of model animals such as C. elegans,20,41,42 zebrafish,43 and Drosophila.25,44 By combining two-photon excitation fluorescence (TPE-F) microscopy, we have acquired lipid and autofluorescence imaging in living Drosophila and observed fat body remodeling process during metamorphosis25 and lipid accumulation in oenocytes.44 To further study lipid homeostasis in Drosophila, here we monitored LDs in both larval oenocytes and fat body of living larvae under fed and starved conditions. We analyzed the lipid content and size of LDs in oenocytes as well as in the fat body from CARS/TPE-F images. Compared with control larvae, mutants that overexpress Bmm or Lsd-2 in the fat body show significant difference of lipid content in oenocytes and fat body both under fed and starved conditions, revealing the characteristic in their lipid metabolism. In addition, we examined their larval viability during long-term starvation and found the correlation with their consumption of lipid in the fat body. Through in vivo observations, our findings characterize the effects of metabolic imbalance in Drosophila larvae. 2.Materials and Methods2.1.Drosophilastrain was provided by fly core facility in College of Medicine, National Taiwan University. FB-Gal4, UAS-Bmm, and UAS-Lsd-2 strains were kindly provided by Dr. Ronald Kühnlein.12,16 To overexpress Bmm or Lsd-2 in the fat body, we crossed FB-Gal4 with UAS-Bmm or UAS-Lsd-2 to generate FB-Gal4:UAS-Bmm (FB-Bmm-overexpressing mutant) and FB-Gal4:UAS-Lsd-2 (FB-Lsd-2-overexpressing mutant), respectively. The and FB-Gal4 strains were used as the controls in oenocyte and fat body experiments, respectively. All strains were raised at 22°C using a standard agar diet (1% autolyzed yeast, 5.8% cornmeal, 5% glucose, 0.6% agar). 2.2.Oil Red O StainingThe procedure for staining Drosophila larval oenocytes and fat body is described as follows: larvae were carefully dissected in phosphate buffered saline (PBS) and fixed in 4% paraformaldehyde for 25 (oenocyte) or 10 min (fat body). Specimens were then rinsed with distilled water and incubated in Oil Red O stain for 20 min. (Saturated Oil Red O in . Oil Red O was from Sigma-Aldrich, UK.) After staining, the specimens were rinsed with distilled water and ready for imaging by bright field microscopy incorporated with a CCD camera. 2.3.Drosophila Larva AnalysisIn the oenocyte experiment, the L3-larvae were chosen and placed on the moistened tissue paper for 0 (fed) or 16 h (starved). In the fat body experiment, the L2-larvae were chosen and placed on the moistened tissue paper for 0 (fed) or 48 h (starved). In the starvation assay, the L2-larvae were chosen and placed on the moistened tissue paper for 0 to 120 h. Their viability was determined by the pharynx movement every 12 h. Before in vivo observation, larvae were anesthetized by exposure to ether fume for 2 to 3 min. Temperature was kept at 22°C during observation. 2.4.CARS/TPE-F MicroscopyIn the setup, one Ti-sapphire laser (Mira-900P, Coherent, California) with 2.5-ps pulse width serves as pump/probe beam, and the other Ti-sapphire laser (Mira-900F) with 200-fs pulse width serves as Stokes beam in CARS, both are at 76 MHz repetition rate (Fig. 1). Here the 200-fs pulsed Ti-sapphire laser can provide better efficiency of two-photon excitation of autofluorescence and green fluorescent protein (GFP). Both lasers are pumped by a Nd:YVO4 laser (Verdi-10W, Coherent, Santa Clara, California). An additional synchronization system (Synchro-Lock, Coherent, Santa Clara, California) is applied to synchronize the two laser pulses. The laser beams are collinearly combined and directed into a laser scanning microscope (FV300 and IX-71, Olympus, Tokyo, Japan), and focused onto the sample by a 60X water immersion objective (UPLSAPO 60XW, Olympus, Tokyo, Japan). To obtain CARS imaging of lipid C-H stretching mode at , the pump/probe beam is tuned at , and the Stocks beam is tuned at , with 30 and 15 mW at the sample, respectively. The forward CARS (F-CARS) signal (at ) is collected by a condenser (), passing through a set of bandpass filters (FF01-630/92 and FF01-590/10, Semrock, Rochester, New York) and detected by a PMT (R7400U-02, Hamamatsu, Iwata-City, Japan). The TPE-F images are obtained simultaneously with CARS images. The fluorescence is collected by the same objective (epi-detection), passing through a short-pass dichroic mirror (685SPXR, Chroma, Bellows Falls, Vermont) and a bandpass filter (FF01-510/84, Semrock, New York), detected by a PMT (R3896, Hamamatsu, Japan). The scan speed is about 3 to 5 s for each CARS/TPE-F image. These images are shown as the overlay of CARS (pseudo-colored in yellowish orange) and TPE-F (pseudo-colored in green) images. 2.5.Image Analysis of Lipid Content in Oenocytes and Fat BodyFor oenocytes, CARS/TPE-F images were focused on the plane, which showed clear contours of cell nuclei. LDs were identified from the thresholded CARS image and the CARS intensity of LDs was subtracted by the background, which is defined by nonlipid surrounding regions. The lipid content was determined by the square root of the background-subtracted CARS intensity,33 and then multiplied by LDs area and divided by oenocytes area to give the normalized CARS intensity. On the other hand, for the fat body, we acquired images from several focal planes and estimated the lipid content by averaging the ratio of LDs area to the fat body area of these images. The area of the oenocyte and fat body was determined by the segmented TPE-F image. All image analyses were performed by Image-J. Statistical significance was calculated by using an unpaired two-tailed Student’s t test. Error bars represent standard deviations. 3.Results and Discussion3.1.In Vivo Imaging of Drosophila Larvae by CARS/TPE-F MicroscopyThe larval oenocytes, clusters of pear-shaped cells, are found in the space between the dorsoventral muscles and the body wall.45,46 Freshly dissected oenocytes often show greenish-yellow autofluorescence upon excitation with ultraviolet light, but it quenches rapidly.45 Using CARS/TPE-F microscopy to observe the third-instar larva, we can recognize oenocytes by their cell morphology and autofluorescence [Fig. 2(b)]. The oenocytes are located at the basal surface of the lateral epidermis (at depth from the cuticle), in the presence of repetitive clusters on the side of the larval body [Fig. 2(a) and 2(b)]. CARS was tuned at corresponding with C-H bond stretching mode for lipid imaging. Figure 2(b) shows the CARS signal in oenocytes, indicating lipid accumulation. When we focus deeper at depth from the cuticle, we can also find the fat body and the gut, as shown in Fig. 2(c). The fat body has thin lobes composed of fat cells with large LDs and is clearly resolved by its strong CARS signal [Fig. 2(c)]. Some part of the gut shows autofluorescence (perhaps from the food) and has small LDs on it [Fig. 2(c)]. The larval cuticle also has strong autofluorescence that gives us clear contour of the larval body in CARS/TPE-F images [Fig. 2(b) and 2(c)]. This demonstrates that CARS/TPE-F microscopy can be used to visualize lipid distribution and autofluorescent organs in living Drosophila larva, with good axial and spatial resolution at subcellular level. This approach enables us to observe and monitor lipid dynamics in a noninvasive way. Fig. 2The internal organs of a living Drosophila larva: (a) a schematic drawing of internal organs in a larva; (b) the CARS/TPE-F images of oenocytes in a larva, at from the cuticle; (c) the CARS/TPE-F images of the fat body and gut in a larva, at from the cuticle. Scale bar: 30 μm. (Yellowish orange: CARS, green: autofluorescence). 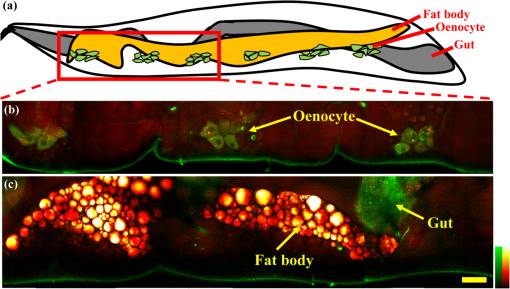 To visualize the lipid in larval oenocytes and the fat body, we compared conventional bright-field images of Oil Red O stained tissues [Fig. 3(a) and 3(c)] with CARS/TPE-F images of a living larva [Fig. 3(b) and 3(d)]. When the larva is starved, its oenocytes will accumulate lipid-like liver steatosis in mammals,7 shown as many Oil-Red-O-positive LDs in Fig. 3(a). In the in vivo CARS/TPE-F image [Fig. 3(b)], oenocytes are identified by their autofluorescence from the TPE-F signal (pseudo-colored in green) and accumulated LDs are also clearly resolved from the CARS signal (pseudo-colored in yellowish orange) [Fig. 3(b)]. Moreover, in vivo CARS/TPE-F image shows a better feature of each lipid droplet (LD) [Fig. 3(b)], while the image of Oil Red O stained tissue shows LDs as reddish fuzzy spots [Fig. 3(a)] due to possible aggregation caused by fixation and staining procedures.47,48 In addition, from in vivo CARS/TPE-F image, we not only observe autofluorescence of oenocytes but also find some fluorescent globules in the cytoplasm (pseudo-colored in green) [Fig. 3(b)] which could be the protein granules,49 providing us more information about its metabolic status. Likewise, compared with the image of Oil Red O stained tissue [Fig. 3(c)], in vivo CARS/TPE-F image shows better resolution of LDs and gives us the fine structure of the fat body [Fig. 3(d)]. Using fluorescent fusion proteins such as GFP can also achieve in vivo imaging of LDs in Drosophila fat body.21 However, the fluorescent protein is labeled on a specific protein (such as PERILIPIN1 or Lsd-1) that expresses on the surface of LDs, and therefore its fluorescence cannot truly reflect the lipid content in LDs. Unlike fluorescent protein labeling, the CARS signal can be specific to C-H bonds mainly from neutral lipid in LDs. In conclusion, in vivo imaging via CARS/TPE-F microscopy can preserve the most natural information including the feature of LDs, the lipid content, and the autofluorescence. Fig. 3Larval oenocytes and the fat body: (a) Oil Red O stained bright field and (b) in vivo CARS/TPE-F images of oenocytes. The lipid droplet and fluorescent globule are indicated by the white arrow and yellow arrow, respectively. Scale bar: 20 μm. (c) Oil Red O stained bright field and (d) in vivo CARS/TPE-F images of the fat body. Scale bar: 30 μm. (Yellowish orange: CARS, green: autofluorescence). 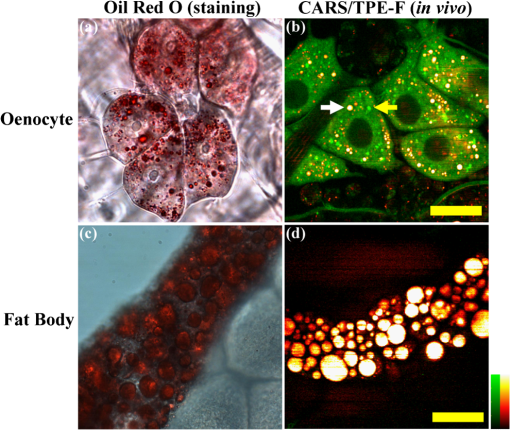 3.2.Lipid Regulation in Larval OenocytesTo investigate lipid regulation in larval oenocytes and fat body, each of two lipid regulatory proteins—Bmm or Lsd-2—was overexpressed in the fat body of Drosophila to observe their effects. The imbalance between these two proteins can alter lipid metabolism in Drosophila. Figure 4(a) through 4(f) are CARS/TPE-F images of oenocytes under fed and starved (16 h) conditions. In the control larva (), oenocytes normally do not accumulate much lipid under fed condition [Fig. 4(a)]. When it is starved, lipolysis (TAG hydrolysis) occurs in the fat body and the fatty acids are released from the fat body to oenocytes. As a result, more LDs accumulate in oenocytes ( larvae) [Fig. 4(b)].7 However, in FB-Bmm-overexpressing mutant (FB-Gal4:UAS-Bmm), LDs accumulate in oenocytes even when it is fed [Fig. 4(c)]7 and accumulate more when starved ( larvae) [Fig. 4(d)]. On the contrary, in FB-Lsd-2-overexpressing mutant (FB-Gal4:UAS-Lsd-2), LDs are less found in oenocytes both under fed and starved conditions ( larvae) [Fig. 4(e) and 4(f)].7 The image analysis of lipid content in oenocytes is shown in Fig. 4(g). FB-Bmm-overexpressing mutant has more lipid than wild-type under fed condition, while FB-Lsd-2-overexpressing mutant has less lipid than wild-type under starved condition [Fig. 4(g)]. Grönke et al. have found that Bmm would be upregulated upon starvation in normal flies.16 Thus, overexpression of Bmm in the fat body is likely to mimic the effect of starvation and lead to more LDs accumulation in oenocytes. On the other hand, Lsd-2 acts antagonistically to Bmm and hinders the access of Bmm to LDs,9,16 thus can lower the lipolysis rate when overexpressed. Indeed, we found less accumulation of LDs in FB-Lsd-2-overexpressing mutant oenocytes even when starved. These results indicate that promotion and inhibition of TAG hydrolysis in the fat body can significantly perturb lipid metabolism in the larva under fed and starved condition. Fig. 4The CARS/TPE-F images of oenocytes under fed and starved conditions, in the control () [(a) and (b)], Bmm overexpression under the control of FB-Gal4 (Bmm) [(c) and (d)], and Lsd-2 overexpression under the control of FB-Gal4 (Lsd-2) [(e) and (f)]. Scale bar: 20 μm. (Yellowish orange: CARS, green: autofluorescence). (g) Analysis of lipid content in oenocytes under fed and starved conditions. (Error bars represent standard deviations of oenocytes from 8 to 13 larvae. .) 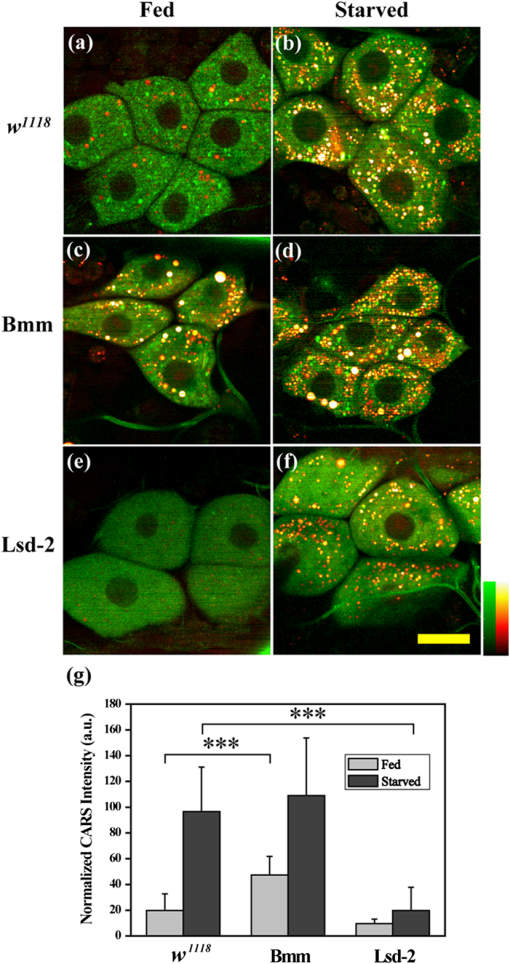 3.3.Lipid Regulation in the Fat BodyWe further investigated the effect of overexpression of Bmm and Lsd-2 on lipid regulation in larval fat body. Figure 5 shows CARS/TPE-F images of the fat body of FB-Gal4 [Fig. 5(a) and 5(b)] (as control), FB-Bmm-overexpressing mutant [Fig. 5(c) and 5(d)], and FB-Lsd-2-overexpressing mutant [Fig. 5(e) and 5(f)] under fed and starved (48 h) conditions. Because these mutants are generated by the FB-Gal4 driver which expresses GFP in fat cells,12 both mutants show GFP fluorescence in their fat bodies. Therefore we can identify the LDs by CARS signal (pseudo-colored in yellowish orange) in the region of the fat body by TPE-F signal (pseudo-colored in green). Under fed condition, the average size of LDs [Fig. 5(g)] in the fat body of FB-Bmm-overexpressing mutant is much smaller ( in diameter) ( LDs) [Fig. 5(c)] than that of the control larva ( in diameter) ( LDs) [Fig. 5(a)], whereas the size of LDs in the fat body of FB-Lsd-2-overexpressing mutant is slightly larger ( in diameter) ( LDs) [Fig. 5(e)]. Grönke et al. have found that overexpression of Bmm can reduce the size and number of LDs in fat cells of adult flies,16 and overexpression of Lsd-2 can increase total TAG content of adult flies.12 Our results demonstrate that they can have different sizes of LDs at larval stage, especially in FB-Bmm-overexpressing mutant. The reduced size of LDs in FB-Bmm-overexpressing mutant larval fat body implies that promotion of lipolysis decreases the formation of large LDs. We further analyzed the lipid content in their fat bodies. Unlike oenocytes, which locate near the surface (at depth), the fat body distributes more deeply (at depth) in the larval body, and the intensity of its CARS signal decays with the depth. To avoid the problem it may cause in lipid quantification, we used the density of LDs in the fat body (the ratio of LDs area to the fat body area) instead of the CARS intensity to estimate the lipid content [Fig. 5(h)]. We found that FB-Bmm-overexpressing mutant has lower lipid content under fed condition, and the lipid content dramatically decreases after 48 h starvation ( larvae) [Fig. 5(d)]. On the contrary, the lipid content in FB-Lsd-2-overexpressing mutant decreases less than in the control after starvation ( larvae) [Fig. 5(f)]. It was reported that LDs can aggregate under starvation.50 However, we did not observe discernible LDs aggregation in the fat body [Fig. 5(b) and 5(f)]. Our results demonstrate that overexpression of Bmm can cause smaller LDs and lower lipid content in the larval fat body and faster consumption of lipid under starvation, while overexpression of Lsd-2 results in slower consumption of lipid under starvation. Fig. 5The CARS/TPE-F images of the fat body under fed and starved conditions, in the control (FB-Gal4) [(a) and (b)], Bmm overexpression under the control of FB-Gal4 (Bmm) [(c) and (d)], and Lsd-2 overexpression under the control of FB-Gal4 (Lsd-2) [(e) and (f)]. Scale bar: 30 μm. (Yellowish orange: CARS, green: GFP) (g) Average LD size in the fat body. (Error bars represent standard deviations of 17 to 22 LDs for each mutant. .) (h) The ratio of LDs area to the fat body area of each larva under fed and starved conditions. (Error bars represent standard deviations of fat bodies from larvae. , .) 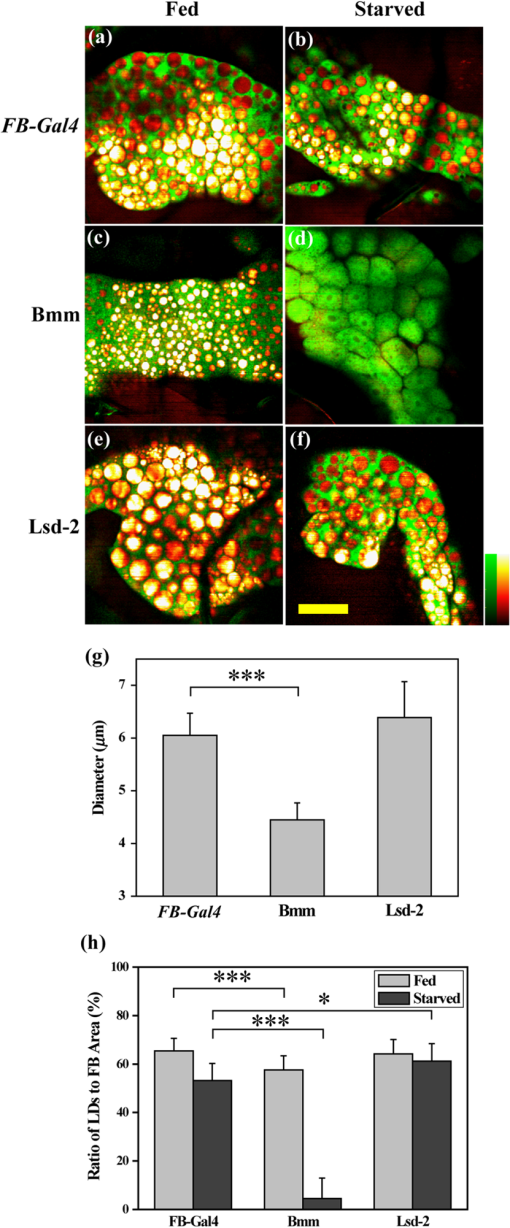 To evaluate the correlation between the lipid metabolism and the viability under long-term food-deprived condition, we performed the starvation assay (0 to 120 h) on L2-larvae of , FB-Gal4, FB-Bmm-overexpressing mutant, and FB-Lsd-2-overexpressing mutant to measure their lifespans under starvation, as shown in Fig. 6. The mean lifespan of FB-Bmm-overexpressing mutant is (), while that of FB-Lsd-2-overexpressing mutant is () and that of the control (FB-Gal4) is () (Fig. 6). FB-Bmm-overexpressing mutant has a shorter lifespan whereas FB-Lsd-2-overexpressing mutant has a longer lifespan with respect to the control. In summary, Bmm and Lsd-2 regulate lipid in an opposite way, and overexpression of these proteins can result in different sizes of LDs and rate of lipid consumption in the larval fat body, which can strongly affect their viability under starvation. 4.ConclusionCARS/TPE-F microscopy provides in vivo imaging of lipid (from CARS signal) and identification of the oenocyte/fat body (from TPE-F signal), which allows us to monitor the lipid regulation in them at subcellular level. Overexpression of Bmm can cause abnormal LDs accumulation in oenocytes and smaller size of LDs in the fat body under fed condition, while overexpression of Lsd-2 inhibits LDs accumulation in oenocytes and slightly increases the size of LDs in the fat body. In addition, the viability during long-term starvation is correlated to the consumption of lipid. In FB-Bmm-overexpressing mutant, the higher rate of lipid consumption makes it more vulnerable to food-deprived condition, while in FB-Lsd-2-overexpressing mutant the lower rate of lipid consumption makes it more resistant to starvation. The similarity of the fat body and oenocytes of Drosophila to the adipose tissue and hepatocytes of human, with Bmm and Lsd-2 protein homologs to human ATGL and Perilipin/ADRP, suggests that the study of lipid homeostasis in Drosophila can provide useful information to our understanding of lipid metabolism in human and will possibly explore a way to tackle human metabolic diseases. AcknowledgmentsThis work was supported by Academia Sinica and the National Science Council of the Republic of China (Grant No. NSC-98-2113-M001-025). We thank Dr. Ronald Kühnlein for FB-Gal4, UAS-Bmm, UAS-Lsd-2 strains, and for critical reading of the manuscript. We thank fly core facility in College of Medicine, National Taiwan University and sixth common core lab in National Taiwan University Hospital for experimental materials and technical support. ReferencesC. H. Lee,
“Minireview: lipid metabolism, metabolic diseases, and peroxisome proliferator-activated receptors,”
Endocrinology, 144
(6), 2201
–2207
(2003). http://dx.doi.org/10.1210/en.2003-0288 ENDOAO 0013-7227 Google Scholar
J. GalganiE. Ravussin,
“Energy metabolism, fuel selection and body weight regulation,”
Int. J. Obes. (Lond), 32 S109
–S119
(2008). http://dx.doi.org/10.1038/ijo.2008.246 IJOBDP 0307-0565 Google Scholar
R. P. Kühnlein,
“Drosophila as a lipotoxicity model organism—more than a promise?,”
Biochim. Biophys. Acta, 1801
(3), 215
–221
(2010). http://dx.doi.org/10.1016/j.bbalip.2009.09.006 BBACAQ 0006-3002 Google Scholar
K. N. Bharucha,
“The epicurean fly: using Drosophila melanogaster to study metabolism,”
Pediatr. Res., 65
(2), 132
–137
(2009). http://dx.doi.org/10.1203/PDR.0b013e318191fc68 PEREBL 0031-3998 Google Scholar
A. SchlegelD. Y. R. Stainier,
“Lessons from ‘lower’ organisms: what worms, flies, and zebrafish can teach us about human energy metabolism,”
Plos Genet., 3
(11), 2037
–2048
(2007). http://dx.doi.org/10.1371/journal.pgen.0030199 Google Scholar
E. L. ArreseJ. L. Soulages,
“Insect fat body: energy, metabolism, and regulation,”
Annu. Rev. Entomol., 55
(1), 207
–225
(2010). http://dx.doi.org/10.1146/annurev-ento-112408-085356 ARENAA 0066-4170 Google Scholar
E. Gutierrezet al.,
“Specialized hepatocyte-like cells regulate Drosophila lipid metabolism,”
Nature, 445
(7125), 275
–280
(2007). http://dx.doi.org/10.1038/nature05382 NATUAS 0028-0836 Google Scholar
N. ArquierP. Léopold,
“Fly foie gras: modeling fatty liver in Drosophila,”
Cell Metab., 5
(2), 83
–85
(2007). http://dx.doi.org/10.1016/j.cmet.2007.01.006 1550-4131 Google Scholar
P. E. BickelJ. T. TanseyM. A. Welte,
“PAT proteins, an ancient family of lipid droplet proteins that regulate cellular lipid stores,”
Biochim. Biophys. Acta, 1791
(6), 419
–440
(2009). http://dx.doi.org/10.1016/j.bbalip.2009.04.002 BBACAQ 0006-3002 Google Scholar
A. R. Kimmelet al.,
“Adoption of PERILIPIN as a unifying nomenclature for the mammalian PAT-family of intracellular lipid storage droplet proteins,”
J. Lipid Res., 51
(3), 468
–471
(2010). http://dx.doi.org/10.1194/jlr.R000034 JLPRAW 0022-2275 Google Scholar
S. Miuraet al.,
“Functional conservation for lipid storage droplet association among Perilipin, ADRP, and TIP47 (PAT)-related proteins in mammals, Drosophila, and Dictyostelium,”
J. Biol. Chem., 277
(35), 32253
–32257
(2002). http://dx.doi.org/10.1074/jbc.M204410200 JBCHA3 0021-9258 Google Scholar
S. Grönkeet al.,
“Control of fat storage by a Drosophila PAT domain protein,”
Curr. Biol., 13
(7), 603
–606
(2003). http://dx.doi.org/10.1016/S0960-9822(03)00175-1 CUBLE2 0960-9822 Google Scholar
L. Teixeiraet al.,
“Drosophila Perilipin/ADRP homologue Lsd2 regulates lipid metabolism,”
Mech. Dev., 120
(9), 1071
–1081
(2003). http://dx.doi.org/10.1016/S0925-4773(03)00158-8 MEDVE6 0925-4773 Google Scholar
R. P. Kühnlein,
“The contribution of the Drosophila model to lipid droplet research,”
Progr. Lipid Res., 50
(4), 348
–356
(2011). http://dx.doi.org/10.1016/j.plipres.2011.04.001 PLIRDW 0163-7827 Google Scholar
J. Biet al.,
“Opposite and redundant roles of the two Drosophila Perilipins in lipid mobilization,”
J. Cell. Sci., 125 3568
–3577
(2012). http://dx.doi.org/10.1242/jcs.101329 JNCSAI 0021-9533 Google Scholar
S. Grönkeet al.,
“Brummer lipase is an evolutionary conserved fat storage regulator in Drosophila,”
Cell Metab., 1
(5), 323
–330
(2005). http://dx.doi.org/10.1016/j.cmet.2005.04.003 1550-4131 Google Scholar
J. Spandlet al.,
“Live cell multicolor imaging of lipid droplets with a new dye, LD540,”
Traffic, 10
(11), 1579
–1584
(2009). http://dx.doi.org/10.1111/tra.2009.10.issue-11 1398-9219 Google Scholar
M. V. RanallB. G. GabrielliT. J. Gonda,
“High-content imaging of neutral lipid droplets with 1,6-diphenylhexatriene,”
BioTechniques, 51
(1), 3538
–3642
(2011). http://dx.doi.org/10.2144/000113702 BTNQDO 0736-6205 Google Scholar
K. BrooksB. LiangJ. Watts,
“The influence of bacterial diet on fat storage in C. elegans,”
Plos One, 4
(10), e7545
(2009). http://dx.doi.org/10.1371/journal.pone.0007545 1932-6203 Google Scholar
K. Yenet al.,
“A comparative study of fat storage quantitation in nematode caenorhabditis elegans using label and label-free methods,”
Plos One, 5
(9), e12810
(2010). http://dx.doi.org/10.1371/journal.pone.0012810 1932-6203 Google Scholar
M. Belleret al.,
“PERILIPIN-dependent control of lipid droplet structure and fat storage in Drosophila,”
Cell Metab., 12
(5), 521
–532
(2010). http://dx.doi.org/10.1016/j.cmet.2010.10.001 1550-4131 Google Scholar
M. A. Welteet al.,
“Developmental regulation of vesicle transport in Drosophila embryos: forces and kinetics,”
Cell, 92
(4), 547
–557
(1998). http://dx.doi.org/10.1016/S0092-8674(00)80947-2 CELLB5 0092-8674 Google Scholar
D. Débarreet al.,
“Imaging lipid bodies in cells and tissues using third-harmonic generation microscopy,”
Nat. Methods, 3
(1), 47
–53
(2006). http://dx.doi.org/10.1038/nmeth813 1548-7091 Google Scholar
I. GasparJ. Szabad,
“In vivo analysis of MT-based vesicle transport by confocal reflection microscopy,”
Cell motility and the Cytoskeleton, 66
(2), 68
–79
(2009). http://dx.doi.org/10.1002/cm.v66:2 CMCYEO 0886-1544 Google Scholar
C. H. Chienet al.,
“Label-free imaging of Drosophila in vivo by coherent anti-Stokes Raman scattering and two-photon excitation autofluorescence microscopy,”
J. Biomed. Opt., 16
(1), 016012
(2011). http://dx.doi.org/10.1117/1.3528642 JBOPFO 1083-3668 Google Scholar
H.-W. Wanget al.,
“Label-free bond-selective imaging by listening to vibrationally excited molecules,”
Phys. Rev. Lett., 106
(23), 238106
(2011). http://dx.doi.org/10.1103/PhysRevLett.106.238106 PRLTAO 0031-9007 Google Scholar
T. T. LeS. YueJ. X. Cheng,
“Shedding new light on lipid biology with coherent anti-Stokes Raman scattering microscopy,”
J. Lipid Res., 51
(11), 3091
–3102
(2010). http://dx.doi.org/10.1194/jlr.R008730 JLPRAW 0022-2275 Google Scholar
M. D. DuncanJ. ReintjesT. J. Manuccia,
“Scanning coherent anti-Stokes Raman microscope,”
Opt. Lett., 7
(8), 350
–352
(1982). http://dx.doi.org/10.1364/OL.7.000350 OPLEDP 0146-9592 Google Scholar
A. ZumbuschG. R. HoltomX. S. Xie,
“Three-dimensional vibrational imaging by coherent anti-Stokes Raman scattering,”
Phys. Rev. Lett., 82
(20), 4142
–4145
(1999). http://dx.doi.org/10.1103/PhysRevLett.82.4142 PRLTAO 0031-9007 Google Scholar
C. L. Evanset al.,
“Chemical imaging of tissue in vivo with video-rate coherent anti-Stokes Raman scattering microscopy,”
Proc. Natl. Acad. Sci. U. S. A., 102
(46), 16807
–16812
(2005). http://dx.doi.org/10.1073/pnas.0508282102 PNASA6 0027-8424 Google Scholar
Y. Fuet al.,
“Ex vivo and in vivo imaging of myelin fibers in mouse brain by coherent anti-Stokes Raman scattering microscopy,”
Opt. Express, 16
(24), 19396
–19409
(2008). http://dx.doi.org/10.1364/OE.16.019396 OPEXFF 1094-4087 Google Scholar
E. Bélangeret al.,
“Quantitative myelin imaging with coherent anti-Stokes Raman scattering microscopy: alleviating the excitation polarization dependence with circularly polarized laser beams,”
Opt. Express, 17
(21), 18419
–18432
(2009). http://dx.doi.org/10.1364/OE.17.018419 OPEXFF 1094-4087 Google Scholar
Y. M. Wuet al.,
“Quantitative assessment of hepatic fat of intact liver tissues with coherent anti-stokes Raman scattering microscopy,”
Anal. Chem., 81
(4), 1496
–1504
(2009). http://dx.doi.org/10.1021/ac8026838 ANCHAM 0003-2700 Google Scholar
J. Zhuet al.,
“A dynamic, cytoplasmic triacylglycerol pool in enterocytes revealed by ex vivo and in vivo coherent anti-Stokes Raman scattering imaging,”
J. Lipid Res., 50
(6), 1080
–1089
(2009). http://dx.doi.org/10.1194/jlr.M800555-JLR200 JLPRAW 0022-2275 Google Scholar
S. H. Kimet al.,
“Multiplex coherent anti-stokes Raman spectroscopy images intact atheromatous lesions and concomitantly identifies distinct chemical profiles of atherosclerotic lipids,”
Circul. Res., 106
(8), 1332
–1341
(2010). http://dx.doi.org/10.1161/CIRCRESAHA.109.208678 CIRUAL 0009-7330 Google Scholar
J. Linet al.,
“Assessment of liver steatosis and fibrosis in rats using integrated coherent anti-Stokes Raman scattering and multiphoton imaging technique,”
J. Biomed. Opt., 16
(11), 116024
(2011). http://dx.doi.org/10.1117/1.3655353 JBOPFO 1083-3668 Google Scholar
C. Y. Linet al.,
“Picosecond spectral coherent anti-Stokes Raman scattering imaging with principal component analysis of meibomian glands,”
J. Biomed. Opt., 16
(2), 021104
(2011). http://dx.doi.org/10.1117/1.3533716 JBOPFO 1083-3668 Google Scholar
M. Zimmerleyet al.,
“Quantitative detection of chemical compounds in human hair with coherent anti-Stokes Raman scattering microscopy,”
J. Biomed. Opt., 14
(4), 044019
(2009). http://dx.doi.org/10.1117/1.3184444 JBOPFO 1083-3668 Google Scholar
K. Königet al.,
“Optical skin biopsies by clinical CARS and multiphoton fluorescence/SHG tomography,”
Laser Phys. Lett., 8
(6), 465
–468
(2011). http://dx.doi.org/10.1002/lapl.v8.6 1612-2011 Google Scholar
L. Gaoet al.,
“On-the-spot lung cancer differential diagnosis by label-free, molecular vibrational imaging and knowledge-based classification,”
J. Biomed. Opt., 16
(9), 096004
(2011). http://dx.doi.org/10.1117/1.3619294 JBOPFO 1083-3668 Google Scholar
T. Hellereret al.,
“Monitoring of lipid storage in Caenorhabditis elegans using coherent anti-Stokes Raman scattering (CARS) microscopy,”
Proc. Natl. Acad. Sci. U. S. A., 104
(37), 14658
–14663
(2007). http://dx.doi.org/10.1073/pnas.0703594104 PNASA6 0027-8424 Google Scholar
M. C. Wanget al.,
“RNAi screening for fat regulatory genes with SRS microscopy,”
Nat. Methods, 8
(2), 135
–138
(2011). http://dx.doi.org/10.1038/nmeth.1556 1548-7091 Google Scholar
A. EnejderC. BrackmannF. Svedberg,
“Coherent anti-Stokes Raman scattering microscopy of cellular lipid storage,”
IEEE J. Sel. Top. Quant., 16
(3), 506
–515
(2010). http://dx.doi.org/10.1109/JSTQE.2009.2032512 IJSQEN 1077-260X Google Scholar
C. H. Chienet al.,
“In vivo monitoring specialized hepatocyte-like cells in Drosophila by coherent anti-Stokes Raman scattering (CARS) and two-photon excitation fluorescence (TPE-F) microscopy,”
Proc. SPIE, 8226 822624
(2012). http://dx.doi.org/10.1117/12.909816 PSISDG 0277-786X Google Scholar
T. M. Rizki,
“The circulatory system and associated cells and tissues,”
The Genetics and Biology of Drosophila, 397
–452 Academic, New York
(1978). Google Scholar
D. Bodenstein,
“The postembryonic development of Drosophila,”
Biology of Drosophila, 275
–367 John Wiley and Sons, New York
(1950). Google Scholar
S. FukumotoT. Fujimoto,
“Deformation of lipid droplets in fixed samples,”
Histochem. Cell Biol., 118
(5), 423
–428
(2002). http://dx.doi.org/10.1007/s00418-002-0462-7 0948-6143 Google Scholar
X. NanJ. X. ChengX. S. Xie,
“Vibrational imaging of lipid droplets in live fibroblast cells with coherent anti-Stokes Raman scattering microscopy,”
J. Lipid Res., 44
(11), 2202
–2208
(2003). http://dx.doi.org/10.1194/jlr.D300022-JLR200 JLPRAW 0022-2275 Google Scholar
T. M. Rizki, M. AshburnerT. R. F. Wright,
“Fat Body,”
The Genetics and Biology of Drosophila, 561
–601 Academic, New York
(1978). Google Scholar
H. B. Zhanget al.,
“Regulation of cellular growth by the Drosophila target of rapamycin dTOR,”
Gene Dev., 14
(21), 2712
–2724
(2000). http://dx.doi.org/10.1101/gad.835000 GEDEEP 0890-9369 Google Scholar
|


