|
|
1.IntroductionUsing light for medical diagnostics and biomedical research has become increasingly popular over the last decades due to fast and noninvasive applications without the need for ionizing radiation. In the range of near-infrared light, the absorption coefficient of biological tissue components such as oxi/deoxihemoglobin, melanin, and water decreases. Therefore light can pass several centimeters through tissues.1 A main field of research in this area is diffuse optical tomography (DOT). Most DOT systems detect transmitted light2,3 and analyze the scattering and absorption differences to determine structural changes in tissues.4,5 Interpreting these values with respect to experimentally obtained data for tissue parameters makes DOT suitable for breast cancer detection, small animal, or brain imaging and tracking of active pharmaceuticals.2,6–9 1.1.Illumination and Light Capturing MethodsIn DOT systems different methods for illumination and light-capturing have been established. In DOT systems, two different setups can be distinguished: the first type employs noncontact illumination and light capturing while the second system type uses optical fibers in direct contact to the tissue to inject and detect light.6,7,10 The optical fiber applications are limited with respect to functionality due to the need of contact gel in suitable containers, inflexibility, and high maintenance requirements. Furthermore, an integrated real shape 3-D reconstruction of tissues or phantoms embedded in contact gel is difficult or even impossible.8,11 In noncontact DOT, problems arise due to refraction at surfaces, reflection, and intensity variations caused by the irregularity of the objects geometry. 1.2.Reconstruction of Inner Tissue StructureMathematical models were developed to describe light transport inside tissue by employing finite element methods (FEM) or Monte Carlo simulations for image reconstruction and determining differences in absorption and scattering coefficients.12–18 The use of such methods is strongly simplified due to the existence of highly sophisticated software toolboxes, e.g., TOAST (http://web4.cs.ucl.ac.uk/research/vis/toast/intro.html) or NIRFAST (http://www.dartmouth.edu/~nir/nirfast/), that offer a broad variety of adjustable parameters.19 Current methods for mesh creation are mainly based on segmented pre-MRI or CT scans, or rough approximations of the surface.20–22 However, for a more accurate reconstruction, precise knowledge of the surface is inevitable. 1.3.3-D Surface Scans and Reconstruction of the Object ShapeIn addition to the development of reconstruction software, different surface capturing methods have been employed. DOT systems with integrated 3-D cameras, holographic scanners, or photoluminescence plates were developed. Another method to capture the shape of the object is to process pre-MRI or CT scans.11,20–22 These systems have disadvantages regarding accuracy and/or handling, expenditure of time, availability and operating costs. For example, in semitransparent objects, 3-D cameras cannot distinguish between information from the surface and light originating from the subsurface. Photoluminescence plates capture only a shadow image of the object disregarding fine details of the surface.3,8,12,19 Structured light 3-D scanners, which are widely used in a lot of industrial applications,23–25 offer a cheap and flexible option for integration of a 3-D surface scanner into a DOT system. Libraries such as “Open Computer Vision” (open CV, http://opencv.willowgarage.com/wiki/) or “The Point Cloud Library” (PCL, http://pointclouds.org/) provide a multitude of suitable open source software components for utilization in optical imaging applications.26 In this paper we present an approach for 3-D surface reconstruction of semi-transparent objects imaged by a DOT system, using a structured light projection setup in combination with polarization difference imaging (PDI). Combining these techniques allows for contactless image acquisition and also faster mesh generation for FEM-based image reconstruction algorithms. 2.Theory and MethodsWithin contactless image acquisition of objects in diffuse optical tomography, special care must be taken with regard to boundary surfaces, since the angle of refraction depends on the orientation of the surface normal and the refraction index of the medium.11,27 To overcome this dilemma given an unknown object topology, multiple detectors are usually attached directly to the surface using a refraction index matching contact gel.7 For contactless image acquisition in transmission mode, the shape of an object has to be known for two reasons: first, the geometric information can be used for simple mesh creation to model diffuse light propagation in tissue employing FEM, like the one used by NIRFAST and TOAST. Second, the shape determines the direction of photons leaving the object and the intensity captured by the detector. These problems are illustrated in Fig. 1, where the surface shape influences the transmitted light intensity on the detector side. Assuming a Lambertian radiator at each node of the FEM-mesh on the object’s surface, which is justified by the multiple-scattering nature of light inside the tissue, the light intensity as measured by the detector can be obtained from the surface shape and the transmitted intensity perpendicular to the surface by Fig. 1The light intensities measured by the camera depend on the surface orientation with respect to camera position and on the refractive index of object and ambient medium. The angles show the orientation of the incident light to the surface segments, while describe the angle between camera normal and the surface at the detector side (, , 2, 3). Note that denotes the surface normal to the surface element number . 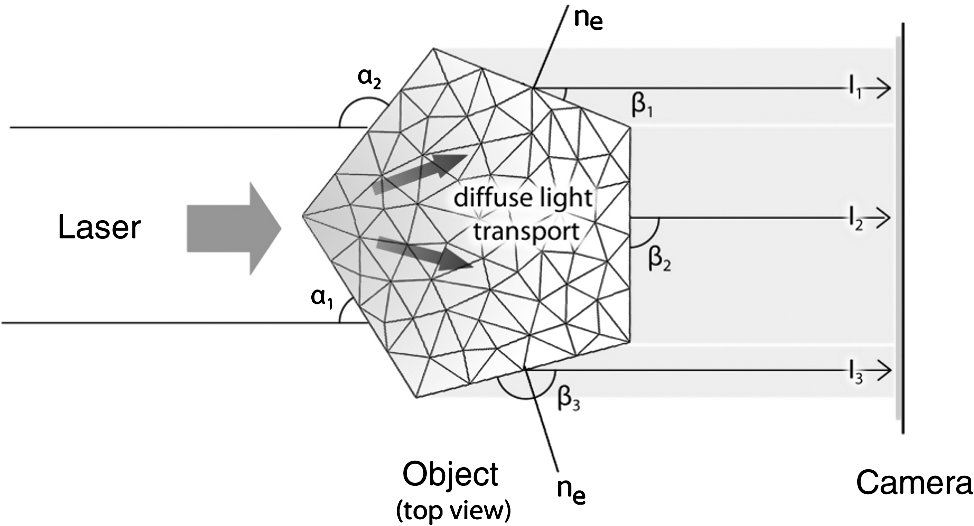 The angles with , 2 determine the amount of light reflected by the surface according to the Fresnel equations. However, since optical properties of the tissue are generally unknown, the incident laser beam should be kept perpendicular to the surface. 2.1.Polarization Difference ImagingPDI is a relatively simple and fast technique, which allows the separation of light reflected by the real surface of an object from the signal originating from the subsurface. In effect, in nonbirefringent media ballistic scattering does not alter the polarization state of light, while nonballistic scattering results in random polarization. By analyzing the polarization state of the reflected light, the real surface of the object can be extracted. Nevertheless, tissue penetration depth is correlated to multiple scattering events and inter-reflections ultimately resulting in a loss of polarization. If polarizer and analyzer are aligned in the same orientation, ballistic scattered photons are recovered. To decrease the noise caused by photons randomly polarized in the same manner as the incident light due to inelastic scattering, the analyzer is turned orthogonal to the polarizer and the measured signal is subtracted. The calculated intensity of ballistic photons is where is the intensity recorded during parallel alignment of polarizer and analyzer while is obtained after turning the analyzer at 90 deg.1,28–302.2.Structured Light 3-D ReconstructionA cloud of points on the object’s surface is captured using ray-plane intersection, which is then triangulated to obtain a discrete number of small surface elements. For the first step, gray-coded fringe patterns are projected onto the object. In the camera plane, the stripes seem shifted and curved due to the topology of the object. Here every stripe in the projected image is identified in the captured image by its binary gray-code.31 Provided the positions of camera and projector are known, the 3-D object position within the coordinate system of the camera is obtained by calculating the intersection point of the plane given by a projector stripe and the light ray detected by the camera.32 While examining tissue, it cannot be assumed that only direct surface reflections of fringe pattern are observed. Rather, photons originating from subsurface scattering must be accounted for. To this end, de-scattering properties of phase-shifting or PDI, which is used in this work, can be applied.28 By rotating the object and repeating the previous procedure, local 3-D reconstructions from different viewpoints are acquired and can be merged to obtain global surface information. This data is used to provide boundary information for FEM-mesh creation on the one hand and to normalize images acquired during a DOT scan on the other hand (see Fig. 1). An example for an experimental noncontact DOT setup with integrated PDI and structured light system is shown in Fig. 2. Fig. 2Experimental setup for a noncontact DOT system with integrated PDI and structured light projection system (on the right hand side). The laser beam describes the transmitted light path of the system (left-hand side). Transmitted light and fringe pattern can be captured by the same camera system. For 3-D surface shape reconstruction, the polarizer-analyzer orientation can be adjusted between 0 and 90 deg, and the object can be illuminated with fringe patterns by the projector.  2.3.WorkflowThe workflow of a DOT system is illustrated in Fig. 3. In the first step, the object is rotated on a stage while fringe pattern image sequences are collected to reconstruct a 3-D surface model. The same detector is used subsequently to acquire images of the object trans-illuminated by the laser. In the next step, the surface model data is needed for mesh generation on the one hand and intensity normalization of the images, captured in trans-illumination mode, on the other. Finally, the mesh is used for FEM-based solving of the forward model of light propagation within the object.19 Fig. 3Workflow of a DOT system with integrated PDI and structured light projection. Hardware control, image acquisition, data reconstruction, and data analysis can be performed within one software application. 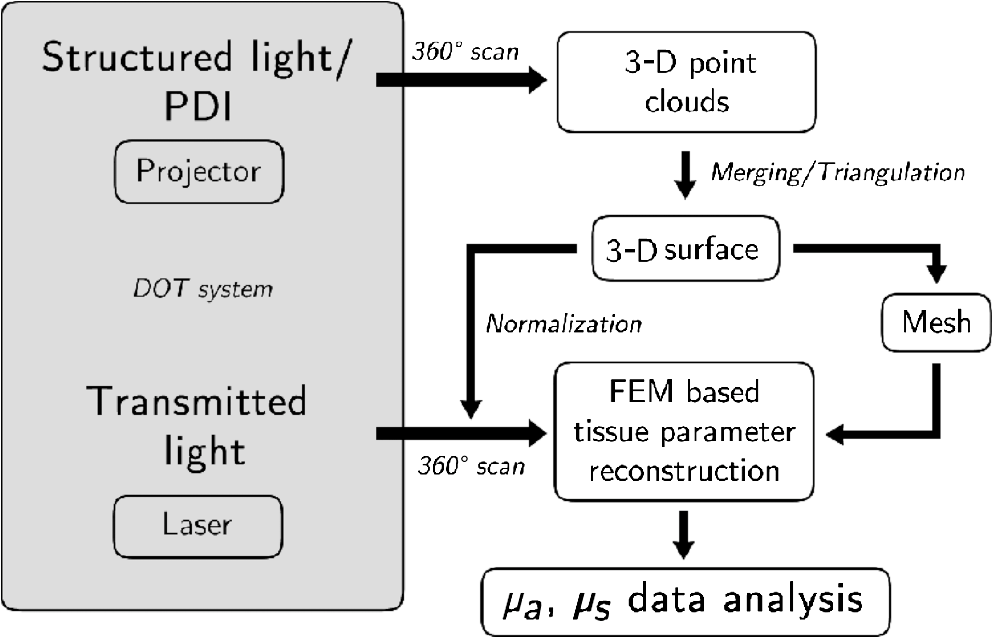 If the deviation between the solution of the forward model and the captured transmitted light data is minimized by parameter variation, the inversion of the forward problem can give an estimate for the distribution of the light absorption and scattering parameters and . All of the components are integrated in one experimental setup. 2.4.From Point Clouds to MeshIn order to provide suitable information for tissue reconstruction applications like NIRFAST and TOAST, surface meshes have to be constructed out of the acquired point clouds. Such meshes usually consist of polygons, which in most cases form triangles for easier storage, rendering, and further processing of the data. Depending on the required accuracy, the density of points can be reduced first to reduce computing time. For the point cloud and surface reconstruction operations, the “Point Cloud Library”26 is used. It provides implementations of several algorithms for both surface reconstruction and point cloud filtering/smoothing. For numerical iterative optimization purposes the “GNU Scientific Library” is used.33 3.ResultsTo specify and to validate the method, the following measurements were performed: both a nontransparent metallic cylinder and a semitransparent cylinder made of Agar-Agar were scanned in order to determine the accuracy of the proposed method and demonstrate the advantages of PDI within the system. Additional scans of more complex non and semitransparent objects were carried out. The resulting volume meshes are presented in Sec. 3.4. 3.1.Accuracy of the Method for Nontransparent ObjectsTo determine the accuracy of the 3-D scanning unit, a metallic cylinder of known radius was scanned from different angles. The resulting point clouds were merged into a 360-deg surface cloud. The final point cloud is shown in Fig. 4. For this measurement, the cylinder was aligned so that its symmetry axis coincides with the system’s rotation axis. Since the orientation of the rotation axis is known from the calibration procedure, it is possible to compare the distance of every point to the rotation axis with the actual cylinder radius. As presented in Fig. 5, the computed point cloud is in good agreement with the real shape of the cylinder. The mean error is 3.2% with a standard deviation of 2%, which is a satisfying result. Fig. 5Measurement of a test cylinder made of metal (). The upper plot shows the computed radius for every point in comparison to the real cylinder radius, which is drawn as dashed line. The lower plot illustrates the relative error for every point. The mean error is 3.2% (dashed line) with a standard deviation of 2%. Note that the point indices are sorted by ascending -values.  3.2.Accuracy of the Method for Semitransparent ObjectsSimilar tests were performed on a semitransparent Agar-Agar cylinder (2% Agar-Agar Kobe I, Company Carl Roth GmbH Karlsruhe) of radius . In order to determine the influence of PDI on the quality of the 3-D reconstruction, these measurements were carried out with and without using the PDI method. The following images illustrate the resulting point clouds of both measurements in comparison. Figure 6 demonstrates that the absence of PDI leads to major reconstruction errors. This observation can be quantified by analyzing the cylinder radius as described in Sec. 3.1. As shown in Fig. 7(a), the usage of the PDI method suppresses most of the reconstruction errors. In addition, using PDI reduces the mean relative error from 19.3 to 7.4%. However, the errors still show a larger dispersion about the mean as compared to the metal cylinder. All the quantitative results are summarized in Table 1. Fig. 6(a) Point cloud reconstruction of an Agar-Agar cylinder with a radius using PDI technique. (b) Point cloud of the same cylinder measured without using PDI.  Fig. 7Measurements of an Agar-Agar cylinder () with and without PDI. The dashed lines indicate the ideal cylinder radius in the upper and the mean errors in the lower plots (a) PDI measurement of an Agar-Agar cylinder. The mean error is 7.4% with a standard deviation of 7.9% (b) NonPDI measurement of the same cylinder. Here the mean error is 19.3% with a standard deviation of 60.5%. Note the different scaling of the y-axis. Point indices are sorted by ascending -values in both cases. 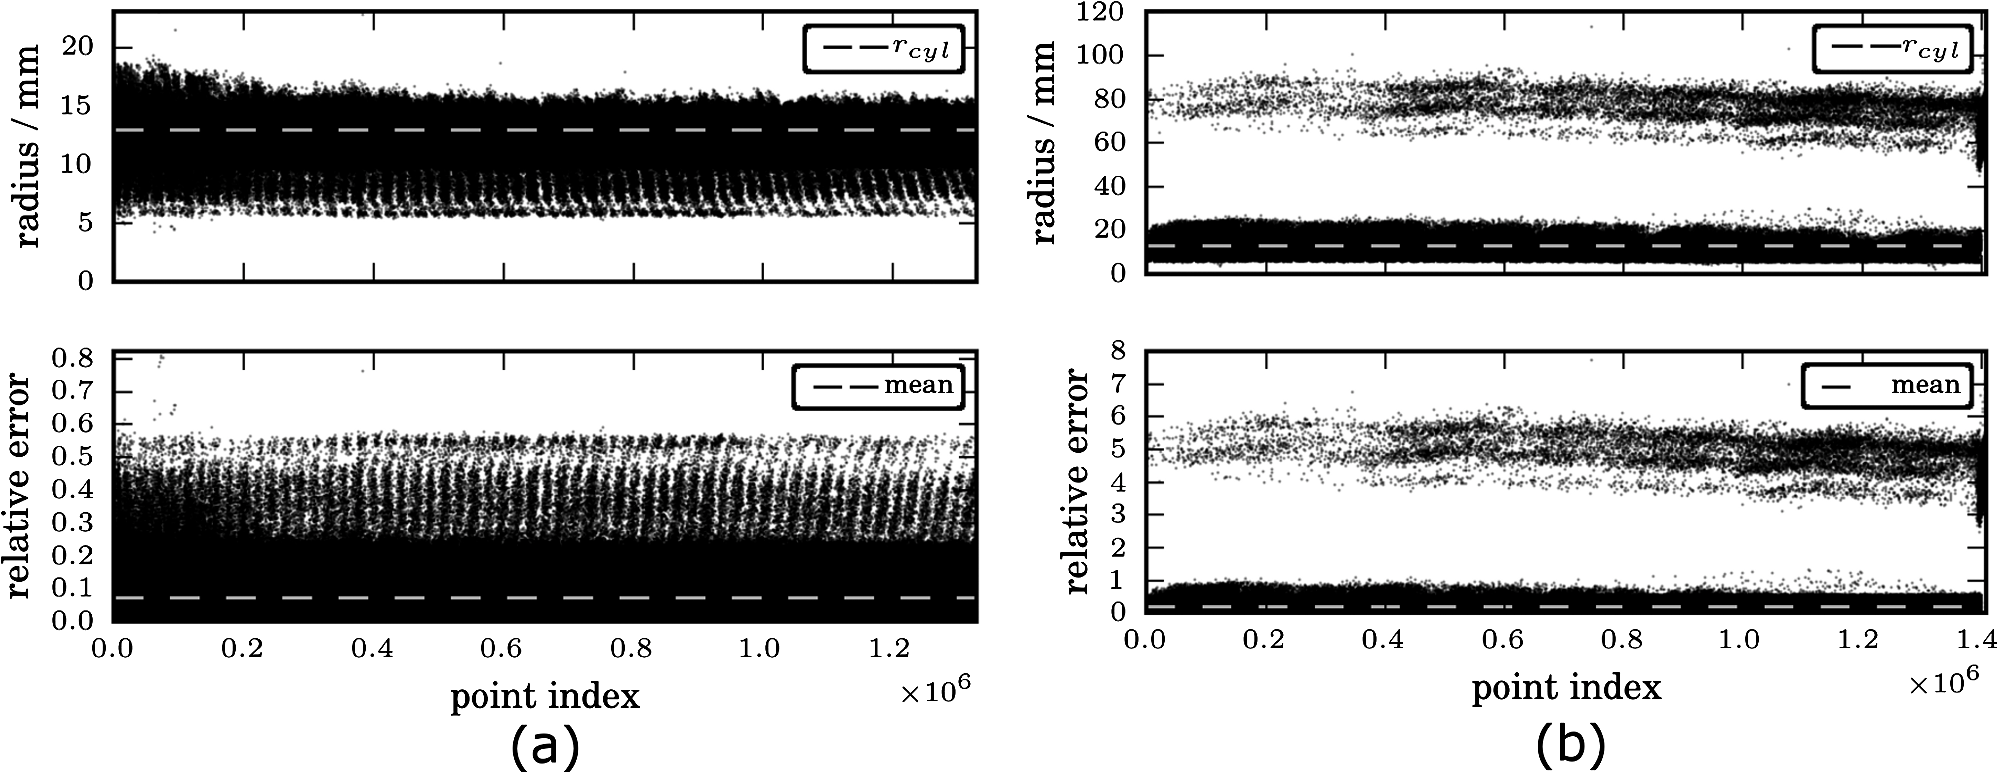 Table 1Validation results.
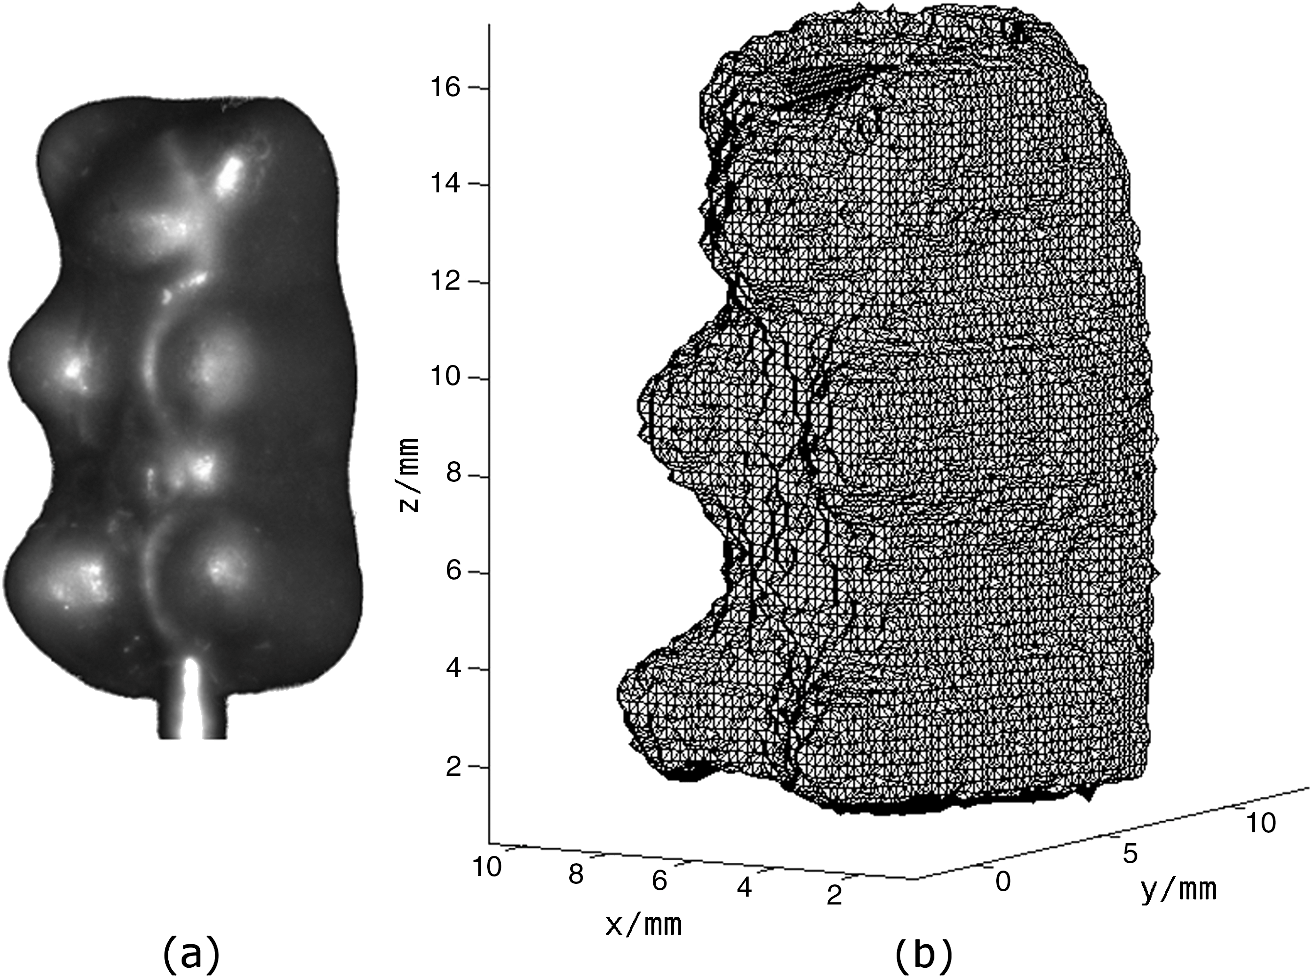
Based on these results, we conclude that the usage of PDI clearly improves the surface scans. However, our point cloud reconstructions of semitransparent objects do not reach the quality of nontransparent objects. 3.3.Meshing of Nontransparent ObjectsBoth a photography of a nontransparent object (here a plastic mouse phantom) and the corresponding point cloud captured with the introduced setup via structured light, are shown in Fig. 8(a) and 8(b), respectively. Fig. 8(a) Photo of the phantom. (b) The point cloud image of the phantom. (c) and (d) Triangulated surface meshes with different node distances.  Such surface point clouds captured from different angles were merged into a 360-deg surface point cloud of the sample. We then used a triangulation algorithm implemented in NIRFAST to find a 3-D volume mesh for further processing. Preliminary results are shown in Fig. 8(c) and 8(d) with different node distances. 3.4.Meshing of Semitransparent ObjectsThe main application of our approach is to handle tissue-like and semi-transparent objects using PDI. Figure 9(a) and 9(b) show both a photography of a typical HARIBO Gold-bear (HARIBO of America, Inc., Baltimore, MD) and its corresponding mesh as calculated from point cloud data obtained with our setup. As shown in Sec. 3.2, the absence of PDI leads to significant reconstruction errors and therefore the best results can be achieved by using PDI within a DOT system. 4.ConclusionOur setup provides a quick and cost-effective method to obtain a pure 3-D surface structure of an object within a DOT application concerning both hardware and software. Such surface scans including setup calibration, scanning and data processing can typically be finished within less than 10 min. Hardware components like polarisation filters for PDI applications and a structured light pattern projector are added to an existing DOT system. It has to be mentioned that projector-camera calibration is challenging for a camera field of view with sub-centimeter size. The same detector is used for the transmitted and structured light image capturing. Furthermore, hardware control, image acquisition, data reconstruction, and data analysis are integrated into one software application. With our method, the images’ intensities acquired through contactless trans-illumination of tissue can be corrected to simulate planar objects. Optical fibers and contact gel are not needed because photon propagation between object and detector can be calculated using the surface model data. Most importantly, the 3-D surface information can be used to generate a volume mesh to model the object for FEM-based image reconstruction software like NIRFAST and to supersede MRI or CT analysis. AcknowledgmentsSupported by a research grant of the University Medical Center Gießen and Marburg (UKGM). ReferencesL. V. WangH.-I. Wu, Biomedical Optics: Principles and Imaging, John Wiley & Sons, Inc., New Jersey
(2007). Google Scholar
A. H. Hielscheret al.,
“Near-infrared diffuse optical tomography,”
Dis. Markers, 18 313
–337
(2002). DMARD3 0278-0240 Google Scholar
R. B. SchulzJ. RipollV. Ntziachristos,
“Noncontact optical tomography of turbid media,”
Opt. Lett., 28
(18), 1701
–1703
(2003). http://dx.doi.org/10.1364/OL.28.001701 OPLEDP 0146-9592 Google Scholar
W. F. CheongS. A. PrahlA. J. Welch,
“A review of the optical-properties of biological tissues,”
IEEE J. Quant. Electron., 26
(12), 2166
–2185
(1990). http://dx.doi.org/10.1109/3.64354 IEJQA7 0018-9197 Google Scholar
A. N. Bashkatovet al.,
“Optical properties of human skin, subcutaneous and mucous tissues in the wavelength range from 400 to 2000 nm,”
J. Phys. Appl. Phys., 38
(15), 2543
–2555
(2005). http://dx.doi.org/10.1088/0022-3727/38/15/004 JPAPBE 0022-3727 Google Scholar
S. van de Venet al.,
“Diffuse optical tomography of the breast: initial validation in benign cysts,”
Mol. Imag. Biol., 11
(2), 64
–70
(2009). http://dx.doi.org/10.1007/s11307-008-0176-x 1536-1632 Google Scholar
H. Xuet al.,
“Near-infrared imaging in the small animal brain: optimization of fiber positions,”
J Biomed. Opt., 8
(1), 102
–110
(2003). http://dx.doi.org/10.1117/1.1528597 JBOPFO 1083-3668 Google Scholar
N. Deliolaniset al.,
“Free-space fluorescence molecular tomography utilizing 360-deg geometry projections,”
Opt. Lett., 32
(4), 382
–384
(2007). http://dx.doi.org/10.1364/OL.32.000382 OPLEDP 0146-9592 Google Scholar
V. Ntziachristoset al.,
“Looking and listening to light: the evolution of whole-body photonic imaging,”
Nat. Biotechnol., 23 313
–320
(2005). http://dx.doi.org/10.1038/nbt1074 NABIF9 1087-0156 Google Scholar
J. Ripollet al.,
“Fast analytical approximation for arbitrary geometries in diffuse optical tomography,”
Opt. Lett., 27
(7), 527
–529
(2002). http://dx.doi.org/10.1364/OL.27.000527 OPLEDP 0146-9592 Google Scholar
F. Nouiziet al.,
“3-D modeling for solving forward model of no-contact fluorescence diffuse optical tomography method,”
Proc. SPIE, 7369 73690C
(2009). http://dx.doi.org/10.1117/12.831677 PSISDG 0277-786X Google Scholar
V. NtziachristosR. Weissleder,
“Experimental three-dimensional fluorescence reconstruction of diffuse media by use of a normalized born approximation,”
Opt. Lett., 26
(12), 893
–895
(2001). http://dx.doi.org/10.1364/OL.26.000893 OPLEDP 0146-9592 Google Scholar
S. Srinivasanet al.,
“A coupled finite element-boundary element method for modeling Diffusion equation in 3-D multi-modality optical imaging,”
Biomed. Opt. Express, 1
(2), 398
–413
(2010). http://dx.doi.org/10.1364/BOE.1.000398 BOEICL 2156-7085 Google Scholar
Q. Fanget al.,
“Nonlinear image reconstruction algorithm for diffuse optical tomography using iterative block solver and automatic mesh generation from tomosynthesis images,”
Proc. SPIE, 6081 60810O
(2006). http://dx.doi.org/10.1117/12.662689 PSISDG 0277-786X Google Scholar
M. Chuet al.,
“Light transport in biological tissue using three-dimensional frequency-domain simplified spherical harmonics equations,”
Phys. Med. Biol., 54
(8), 2493
–2509
(2009). http://dx.doi.org/10.1088/0031-9155/54/8/016 PHMBA7 0031-9155 Google Scholar
S. L. JacquesB. W. Pogue,
“Tutorial on diffuse light transport,”
J. Biomed. Opt., 13
(4), 041302
(2008). http://dx.doi.org/10.1117/1.2967535 JBOPFO 1083-3668 Google Scholar
P. Gonzalez-RodriguezA. D. Kim,
“Comparison of light scattering models for diffuse optical tomography,”
Opt. Express, 17
(11), 8756
–8774
(2009). http://dx.doi.org/10.1364/OE.17.008756 OPEXFF 1094-4087 Google Scholar
J. RipollV. Ntziachristos,
“Iterative boundary method for diffuse optical tomography,”
J. Opt. Soc. Am. A Opt. Image Sci. Vis., 20
(6), 1103
–1110
(2003). http://dx.doi.org/10.1364/JOSAA.20.001103 JOAOD6 1084-7529 Google Scholar
H. Dehghaniet al.,
“Near infrared optical tomography using NIRFAST: algorithm for numerical model and image reconstruction,”
Comm. Numer. Meth. Eng., 25 711
–732
(2009). http://dx.doi.org/10.1002/cnm.v25:6 CANMER 0748-8025 Google Scholar
B. Dogdaset al.,
“Digimouse: a 3-D whole body mouse atlas from CT and cryosection data,”
Phys. Med. Biol., 52
(3), 577
–587
(2007). http://dx.doi.org/10.1088/0031-9155/52/3/003 PHMBA7 0031-9155 Google Scholar
B. W. PogueK. D. Paulsen,
“High-resolution near-infrared tomographic imaging simulations of the rat cranium by use of a priori magnetic resonance imaging structural information,”
Opt. Lett., 23
(21), 1716
–1718
(1998). http://dx.doi.org/10.1364/OL.23.001716 OPLEDP 0146-9592 Google Scholar
M. SchweigersS. R. Arridge,
“Optical tomographic reconstruction in a complex head model using a priori region boundary information,”
Phys. Med. Biol., 44
(11), 2703
–2721
(1999). http://dx.doi.org/10.1088/0031-9155/44/11/302 PHMBA7 0031-9155 Google Scholar
S. S. GorthiP. Rastogi,
“Fringe projection techniques: whither we are?,”
Optic. Laser. Eng., 48
(2), 133
–140
(2010). http://dx.doi.org/10.1016/j.optlaseng.2009.09.001 OLENDN 0143-8166 Google Scholar
A. Kus,
“Implementation of 3-D optical scanning technology for automotive applications,”
Sensors, 9
(3), 1967
–1979
(2009). http://dx.doi.org/10.3390/s90301967 SNSRES 0746-9462 Google Scholar
J. Burkeet al.,
“Reverse engineering by fringe projection,”
Proc. SPIE, 4778 312
–324
(2002). http://dx.doi.org/10.1117/12.473547 PSISDG 0277-786X Google Scholar
R. B. RusuS. Cousins,
“3-D is here: Point Cloud Library (PCL),”
in IEEE International Conf. on Robotics and Automation (ICRA),
1
–4
(2011). Google Scholar
M. BornE. Wolf, Principles of Optics, Cambridge University Press, Cambridge, United Kingdom
(1998). Google Scholar
T. Chenet al.,
“Polarization and phase-shifting for 3-D scanning of translucent objects,”
in IEEE Computer Society Conf. on Computer Vision and Pattern Recognition,
1
–8
(2007). Google Scholar
J. S. Tyoet al.,
“Target detection in optically scattering media by polarization-difference imaging,”
Appl. Opt., 35
(11), 1855
–1870
(1996). http://dx.doi.org/10.1364/AO.35.001855 APOPAI 0003-6935 Google Scholar
M. P. Roweet al.,
“Polarization-difference imaging: a biologically inspired technique for observation through scattering media,”
Opt. Lett., 20
(6), 608
–610
(1995). http://dx.doi.org/10.1364/OL.20.000608 OPLEDP 0146-9592 Google Scholar
J. SalviJ. PagesJ. Batlle,
“Pattern codification strategies in structured light systems,”
Pattern Recogn., 37
(4), 827
–849
(2004). http://dx.doi.org/10.1016/j.patcog.2003.10.002 PTNRA8 0031-3203 Google Scholar
D. LanmanG. Taubin,
“Build your own 3-D scanner: 3-D photography for beginners,”
in ACM SIGGRAPH 2009 Courses, 36th international Conf. and Exhibition on Computer Graphics and Interactive Techniques,
1
–87
(2009). Google Scholar
M. Galassiet al., GNU Scientific Library Reference Manual, 3rd ed.Network Theory Limited, Bristol, United Kingdom
(2009). Google Scholar
|