|
|
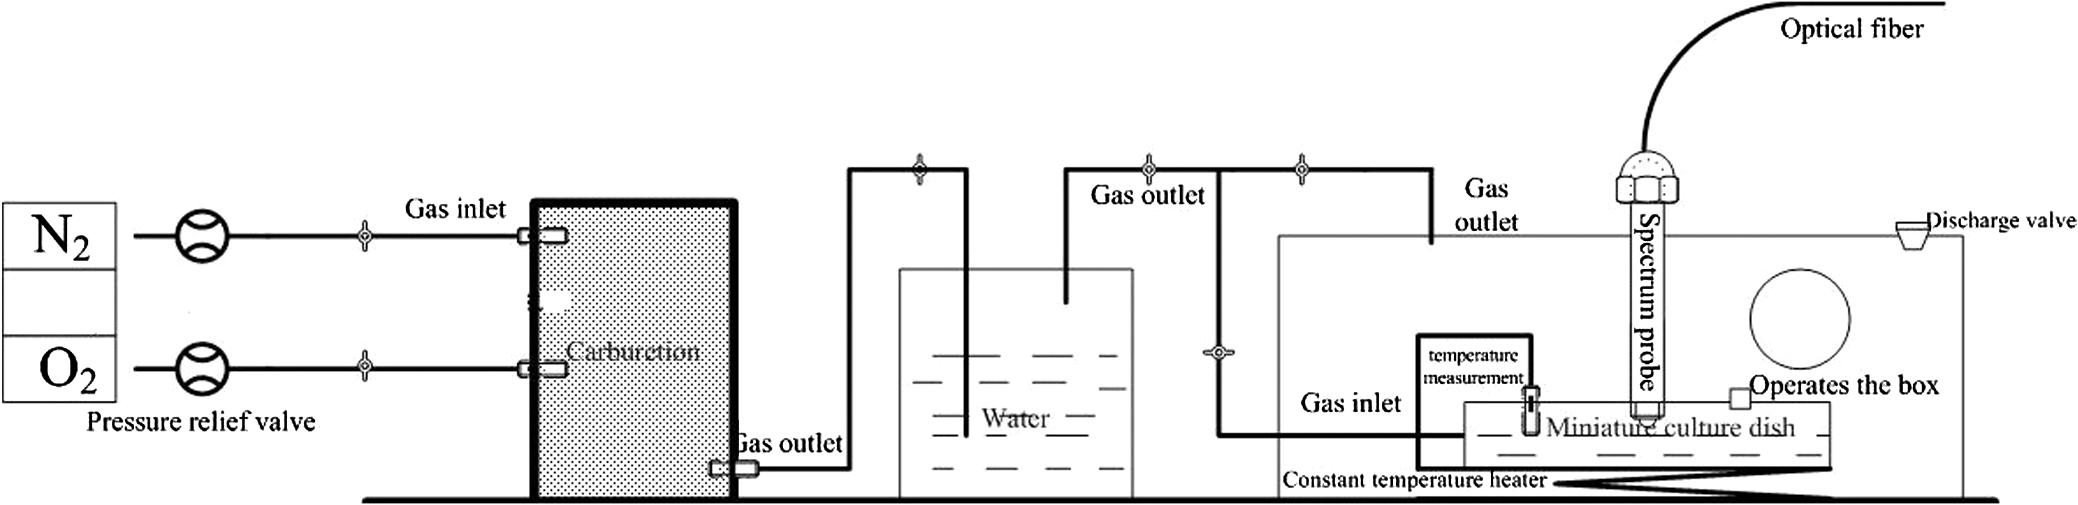
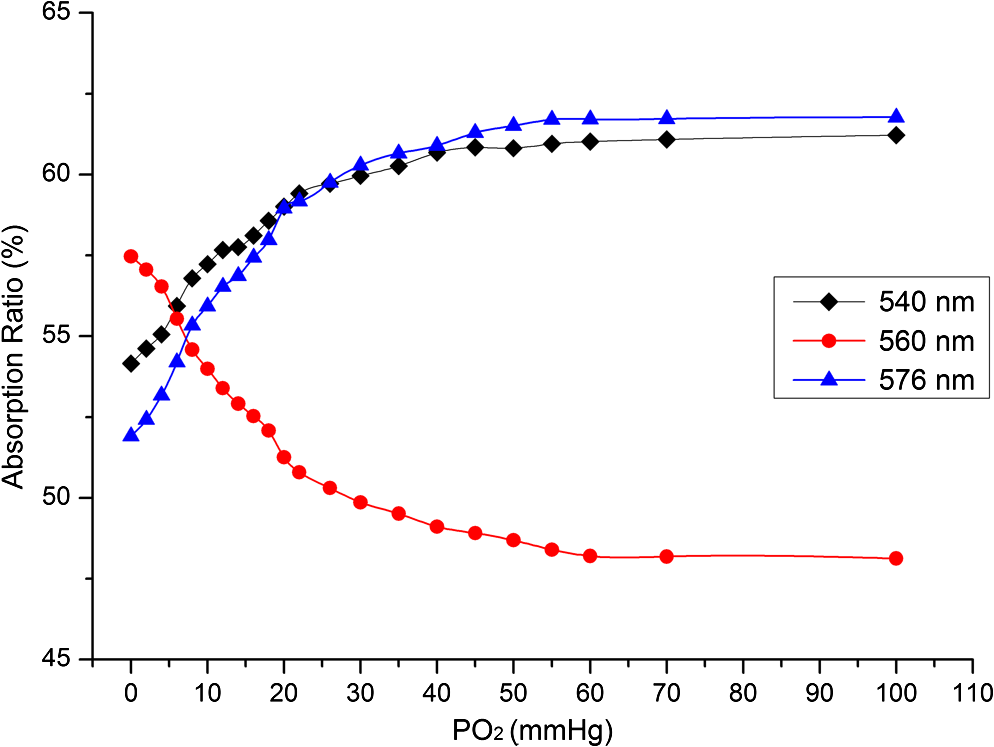
1.IntroductionHemoglobin (Hb) is an important biomolecule that transports and in vertebrates. Human Hb (HbA), which has an tetramer structure and exhibits positive cooperativity in oxygen binding, has been extensively investigated using various methods.1 X-ray crystallographic studies have demonstrated the presence of two quaternary structures of Hb, namely, the (tense) and (relaxed) states, which correspond to low- and high-affinity states, respectively,2,3 and whose typical structures are known as deoxy-Hb and oxy-Hb. As the main conformation of deoxy-Hb, the state has a lower affinity with oxygen compared with the state. The oxygen binding of Hb is cooperative—in terms of a reversible transition between the two quaternary structures, the switching of which takes place at a certain number of bound ligands.4–6 Hb is a type of allosteric protein that can regulate its biological activity through interactions between subunits, making binding easier when oxygen molecules have already combined.7–14 The positive cooperativity in oxygen binding makes it possible to transport oxygen effectively in vivo. The state of Hb is determined by oxygen partial pressure (: the tension force that is caused by the dissolved oxygen) levels. The fractional saturation of the hemoglobin () is approximately 0.97 in the pulmonary alveoli, whose is 100 mm Hg, while the is approximately 0.25 in the capillaries of working muscles, whose is 20 mm Hg.15 The combination of the first oxygen molecule with a subunit triggers a structural change in the globin, which makes it easier to select the next oxygen molecule. When blood flows to organs with low levels of , Hbs with high levels of oxygen saturation (the volume ratio between the oxy-hemoglobin and the effective hemoglobin, which is mainly decided by the oxygen partial pressure) begin to release oxygen molecules. The release of the first oxygen molecule alters the structure of the tetramers, thereby easily setting the other oxygen molecules free,16 which results in an increase in the concentration of deoxy-Hb. The clinical manifestation of the tissue hypoxia (which mainly refers to the hypotonic hypoxia and circulatory hypoxia) is an increase in deoxy-Hb concentration and induces a series of physiological and pathological phenomena, in which cyanosis is one of the most common forms. When the deoxy-Hb concentration of the human blood capillary is more than , a bluish discoloration of the skin and mucous membranes may appear because of the inadequate oxygenation of the blood,17 which could be observed in areas that have thinner skin, less pigmentation, and sufficient blood capillaries, such as the lips, apex nasi, genal region, auricle, and tips of the fingers or toes. Cyanosis is dependent on an absolute amount of reduced Hb present in the capillary bed. Factors that can lead to the low binding rate of oxygen molecules to Hb in the blood may cause cyanosis. Apart from these, many other accompanying symptoms could also be monitored. Among these are expiratory dyspnea, which occurs predominantly in cardiopulmonary diseases; acropachy, which is always seen in congenital heart diseases of the cyanotic types; and disturbance of consciousness, which always occurs in drug or chemical poisoning, shock, respiratory failure, and severe cardiac dysfunction.18,19 Venous blood and arterial blood differ essentially in their levels, with the values being approximately 37 to 40 mm Hg and 80 to 110 mm Hg, respectively. The Hb oxygen saturation levels of venous blood and arterial blood correspond to approximately 64% and 96%, respectively.20 Normally, because arterial blood is bright red and venous blood is dark red, differences between them can be identified by a variation in color that is observable by the naked eye. The methods used to detect the level of oxygen supply in the clinical treatment could fall into two major categories: the electrochemistry method and the optical method. Although they use different principles, the measuring results of the two methods represent the oxygen saturation of the arterial blood. The measurement procedure of the electrochemical method is arterial blood sampling by artery puncturing or intubation and then electrochemical analysis with the blood gas analyzer. Though the measuring results are relatively accurate, the patient must be suffering and can’t realize the continuous monitoring. Compared with the electrochemistry method, the optical method is much more widely used for its continuous nondestructive measuring features, and finger cot oxygen saturation is one of the most typical examples. The measuring principle of it is based on the fact that the light absorption amount of the arterial blood changes along with the arteriopalmus. It regards the light of 660 and 940 nm as the incident light and calculates the blood oxygen saturation by measuring the light transmission intensity of the organization. In addition to these, there are many other near-infrared tissue oximeters being researched, such as spatially resolved spectroscopy and time-resolved spectroscopy. Because of the strong tissue-penetrating ability of near-infrared spectroscopy, these methods are always used in the deep tissue, such as the detection of the oxygen supply levels of the brain and muscles.21–25 The current techniques for measurement include the oxygen electrode method (such as the oxygen surface electrode and the polarographic needle oxygen electrode) and the fiber optic oxygen sensor. The oxygen electrode method has been widely used in the industry and agriculture, and it could realize the detection of multi-layer tissues in scientific experiments by changing the penetration depth,26 but it has not been used in clinical detection, because the results are obtained by inserting the electrode into the tissue. The fiber optic oxygen sensor could detect the by using the fluorescence of the ruthenium complex, because the degree of the fluorescence quenching is associated with the oxygen concentration or the level in the film. This method could detect the dissolved oxygen and the of the atmosphere, but it has not been used in clinical tissue detection, because of its high traumatic feature. In summary, variations in in organs will ultimately be reflected by specific color changes, even though they are sometimes not observable by the naked eye. Based on this, the relationship between specific spectral changes in tissue and the related levels warrants detection, which makes it possible to estimate the simply by measuring spectroscopic alterations in the tissue. This study would provide a strong foundation for further investigation of the proposed method for painless and harmless early detection of oxygen deficiency diseases. 2.Materials and Methods2.1.Separation and Purification of HbBlood was extracted from volunteers with via anticoagulant treatment with Liquaemin Sodium (Xin Rui Biological Technology Company, Shanghai, China). Samples were centrifuged at 1,500 rpm and 4°C for 10 min to remove upper white blood cells and soterocyte, and then washed with normal saline at the rate of three times. Hb was obtained by mixing with tetrachloride and double distilled water at the proportion of and centrifugation at 3,000 rpm for 10 min after 30 min of shaking. The upper liquid was specifically sampled. The hemoglobin was extracted to reduce the interference from the scattering effects of the red cell suspension during the experiment. The concentration of the Hb solution was measured using the HiCN method. 2.2.Control ofwas controlled by stabilizing the fluid flow of in and regulating the flow of after the internal air of the whole container was replaced with as shown in Fig. 1. The value of the Hb solution was measured with an Oxi3310 dissolved oxygen meter (WTW Company, Germany) (). The data could be read automatically, which made it easier to read the value when the flow changed. 2.3.Measurement of the Absorption Spectra and Extinction CoefficientsThe transmitted spectra of Hb under different levels were measured by setting the transmissivity of PBS () at 100%, and Hb samples were prepared by diluting the extracted Hb with PBS (pH 7.4) at the rate of . The primary equipment used to detect the transmitted spectra of Hb was a USB4000 UV/VIS fiber optic spectrometer and a T300-RT-UV-VIS transmission dip probe (American Ocean Optics). LS-1 Tungsten Halogen Light Source (American Ocean Optics) (wavelength 360 to 2,000 nm) was used as the excitation light source, and it was switched on approximately 1 min before the detection step to guarantee the stability of the spectra. The platform and accessories were connected by optic fiber. The parameters for the detection step were set as follows: integration time (the time required for the optic spectrometer to complete a full scanning), 3.7 ms; average times, 10; and flatness, 5. The gas tightness of the equipment was checked before the experiment, and the natural light was shielded. When the solution is irradiated by a cluster of monochrome incident light with known strength, some light is absorbed, whereas other light goes through the solution. The relationship between the absorption ratio () and transmissivity () can be described as Extinction coefficients represent the degree of attenuation of electromagnetic waves that is equal to the relative attenuation value caused by absorption and scattering when the electromagnetic waves spread in the medium for unit distance. The extinction coefficient () of Hb solution can be expressed as where is the optical path length, and is the concentration of the Hb solution. To reduce the interference from scattering effects of the red cell suspension, the hemoglobin was measured in vitro. The optical path length was decided by the thickness of the hemoglobin solution, which was 4 mm in this experiment.2.4.Measurement of the Reflectance Spectra of the Human Nail Fold Under Ischemic ConditionsThe reflectance spectra of the nail folds of 10 healthy adults were detected to determine whether the specific relationship between spectroscopic changes and the related discovered in the Hb solution could be applied in tissue. As shown in Fig. 2, the LS-1 Tungsten Halogen Light was used as the equal-energy source, and the WS-1 standard reflection version (American Ocean Optics) was used to normalize it, with its reflectivity defined as 100%. An R400-7 reflection probe (American Ocean Optics) ( to 800 nm) was used to collect the visible reflectance spectra of the nail folds by irradiating it to the nail folds vertically. As emotion, exercise, smoking, and drinking all affect skin temperature, which might ultimately influence the reflectance spectra of tissues, the subjects who volunteered to participate in this study were asked to relax for 10 to 20 min before the measurements to keep their breathing even and moods stable. The subjects were asked to place their hands flat at the same level as their heart, and contact between the skin and the probe was set such that a squeezing effect did not occur to avoid any unnecessary influence caused by different contact pressures.27,28 Meanwhile, the ischemic conditions of the nail folds were constructed by pressurizing the femoral vein to maintain the pressure at the level of 40 mm Hg higher than the systolic blood pressure of the healthy adults. Data were recorded every 3 s until the subjects’ fingers began to feel numb, during which the room temperature was kept within a range of 23 to 25°C, and interference from natural or irradiation light was avoided. This experiment has strictly followed the requirements of the Institutional Review Board, which has been approved it. The volunteers who participated in this study all gave informed consent, and no volunteers were harmed during this experiment. 3.Results3.1.Variation in the Extinction Coefficient Curve of Hb Under in Normal AtmosphereFigure 3 shows the extinction coefficient curve of Hb under in normal atmosphere, in which two specific high peaks at 540 and 576 nm and a specific valley at 560 nm can be observed. The extinction coefficient value of the high peaks was approximately , whereas that of the valley was approximately . In addition, a higher extinction coefficient value within the range of 380 to 420 nm was detected. When the wavelength was higher than 600 nm, the extinction coefficient of the Hb tended toward . 3.2.Changes in the Absorption Spectra of Hb Under Different LevelsThe absorption spectra of Hb changed regularly when decreased from more than 100 to 0 mm Hg (Fig. 4). When was higher than 100 mm Hg, three characteristic absorption bands were detected at 540, 560, and 576 nm. The absorption ratios at 540 and 576 nm were approximately 61.5% and 62%, respectively, forming two high absorption spectral peaks, whereas the absorption ratio at 560 nm was approximately 48.5% and constituted a specific absorption valley. Along with a decrease in , the two high absorption spectral peaks decreased gradually, whereas the absorption valley at 560 nm increased. When was reduced to approximately 0 mm Hg, the two high absorption spectral peaks disappeared completely, whereas the absorption spectral valley had a hypochromic shift of 8 to 10 nm and formed a specific high absorption spectral peak at approximately 550 nm, with an absorption ratio of approximately 58.5%. 3.3.Variation in the Absorption Spectra of Hb at Fixed Wavelengths When ChangedFigure 5 shows the absorption spectra of Hb observed at 540, 560, and 576 nm when decreased from higher than 100 to 0 mm Hg. The maximum absorption ratios at 540 and 576 nm were approximately 61% and 61.9%, respectively, whereas the minimum value at 560 nm was approximately 48%. The variation in the absorption spectrum of Hb at 560 nm was much smaller when was within the range of 60 to more than 100 mm Hg, whereas the absorption spectra at 540 and 576 nm decreased slowly when decreased from higher than 100 to 55 mm Hg. With a further decrease in , the absorption spectra at 540 and 576 nm began to descend, whereas that at 560 nm began to ascend. When was reduced to approximately 0 mm Hg, the minimum values of the absorption ratios at 540 and 576 nm appeared, which were approximately 54% and 52%, respectively, whereas the absorption ratio at 560 nm achieved its maximum value of approximately 57.5%. In the process of decreasing from higher than 100 to 0 mm Hg, the variation range of the absorption spectrum at 576 nm was much larger than that of the absorption spectra at 540 and 560 nm, indicating that the absorption spectrum at 576 nm was much more sensitive to alterations in . The curve-fitting results between the absorption ratios of hemoglobin at 540, 560, and 576 nm and their related levels are shown in Fig. 6. The coefficients of determination ( ) of the three were 0.9952, 0.9949, and 0.9928, respectively, indicating that the curve had a good fit to the data, which could testify to the feasibility of detection by measuring its absorption spectra. 3.4.Variation in the Reflectance Spectra of the Nail Fold Under Ischemic ConditionsSpecific changes in the reflectance spectra of the microcirculation under ischemic conditions were observed by detecting the reflectance spectra of the nail fold. Because all subjects demonstrated the same characteristics of spectra during ischemia and only deviation in the reflection spectra, the spectra curve (Fig. 7) was plotted with the median of the 10 sets. Two specific reflectance valleys at 540 and 576 nm and a high reflectance spectral peak at 560 nm were detected. With an increase in the ischemia time, the of the nail fold began to decrease, and the reflectance spectra at 540, 560, and 576 nm completely increased, during which the rising degrees at 540 and 576 nm were much larger than that at 560 nm. At approximately 100 s, the specific reflectance valleys at 540 and 576 nm disappeared completely, whereas the high reflectance spectral peak at 560 nm had a hypochromic shift of 8 to 10 nm, which resulted in the appearance of a reflectance spectral valley at approximately 550 nm. Fig. 7Variation in the reflectance spectra of the nail fold under ischemic conditions, in which the decrease of the is represented by the increasing of the pressurization time. 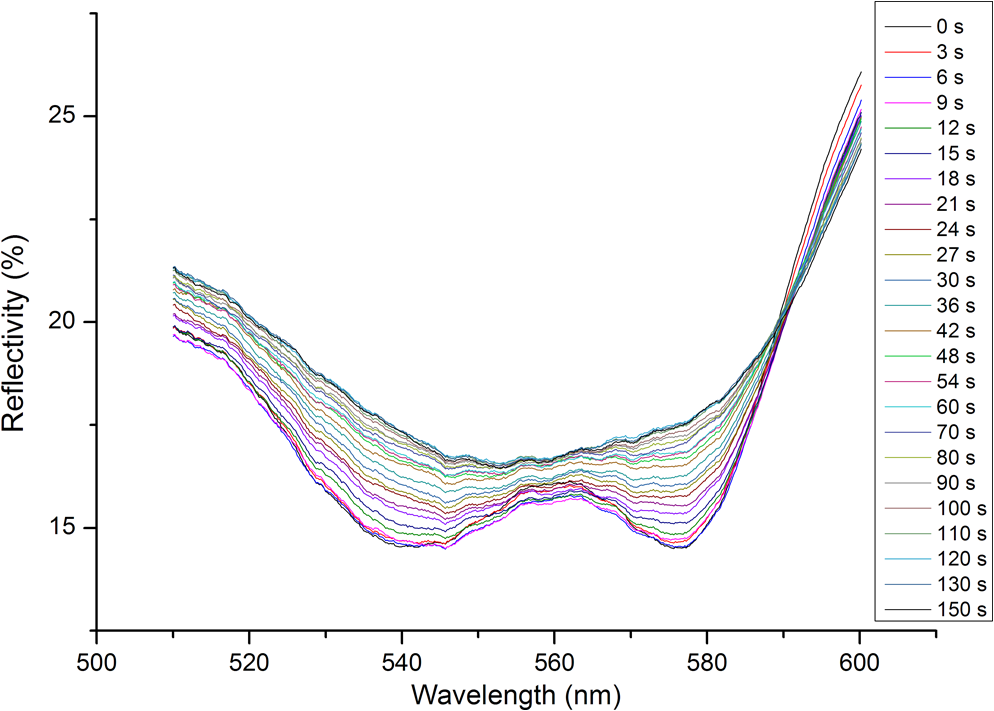 The deviation in the reflection spectra and the deviation in the tolerant times can be attributed to the different characteristics of the subjects. 4.DiscussionResearch on non-invasive continuous monitoring methods for vascular oxygen supply dates to before World War II and has developed rapidly because of the demands of military aviation. Whatever the cause of diseases, the death of patients is ultimately caused by the lack of oxygen transported to the brain and heart. Thus, continuous monitoring of tissue oxygen supply is a terrifying race against time, which is also why oxygen supply should be measured during clinical treatments. In recent years, with the development of clinical care, the importance of tissue oxygen supply monitoring has been increasingly recognized, and finger cot oxygen saturation testing is one of the most widely used methods for continuous monitoring of tissue oxygen supply in clinical applications. As we have expected, a specific relationship between the color appearance and of the Hb solution in vitro exists. The absorption spectra of Hb under different levels showed a specific variation tendency of absorption spectra of Hb when decreased from higher than 100 to 0 mm Hg, in which the absorption ratio of Hb at given wavelengths changed regularly as the changed. At particular wavelengths, such as 540 or 576 nm, when decreased from higher than 100 to 0 mm Hg, exactly one spectral absorption coefficient value corresponded with the of Hb (Figs. 4 and 5), which made it possible to detect the of Hb by simply measuring its absorption ratio at given wavelengths. When tissue was irradiated by equal-energy light, some light went through or was absorbed by the object, whereas the rest was scatter-reflected by it. As some tissues are non-transparent bodies and the light intensity that goes through tissues is too weak to be taken into account, the variation tendency of the reflectance spectra is opposite that of the absorption spectra of the tissues. Therefore, the validation experiment performed by measuring the reflectance spectra of the nail folds confirmed the feasibility of this corollary on the other side: With an increase in the ischemia time (corresponding to a decrease in tissue ), the reflectance ratios at 540 and 576 nm for the microcirculation system increased regularly (Fig. 7) and corresponded to the reductions in the absorption ratio of Hb (Figs. 4 and 5). The absorption spectra of Hb under different levels showed that the absorption spectral valley at approximately 560 nm had a hypochromic shift of 8 to 10 nm when decreased from higher than 100 to 0 mm Hg, which accounts for the colorimetric difference between arterial blood and venous blood. The dominating research objects of the specific extinction coefficient peaks were the two within the range of 492 to 577 nm, in spite of the existence of a more apparent peak within 380 to 420 nm. This can be primarily explained by the fact that the weighting coefficient of the range of 492 to 577 nm was hundreds of times larger than that of the other range, although the extinction coefficient values of the former range were approximately one-third as large as that of the latter range, as shown in the weighting tables of CIE tristimulus values. When the light source is standard illuminant , the weighting efficiencies of and at 400 nm are 0.136 and 0.014, respectively, whereas the corresponding values at 560 nm are 6.069 and 8.583,29 indicating that the range of 492-577-nm (green wave) light significantly contributes to the color of the blood compared with the 380-420-nm (violet) light based on the colorimetric theories. In addition, the new detection method could be used to explain some physiological and pathological phenomena, with the appearance of cyanosis given as an example. The normal concentrations of Hb are 110 to in adult females and 120 to in adult males. Cyanopathy appears when the concentration of deoxy-Hb in the human capillary is in excess of and is approximately 40 mm Hg by estimating the oxygen dissociation curve of Hb. The absorption ratios of Hb at 540, 560, and 576 nm change greatly when is lower than 40 mm Hg, indicating alterations in quaternary structure, which makes it easier for the oxygen molecules to dissociate from the Hb subunits. The specific relationship between the absorption spectra and the of Hb (Fig. 5) suggests that patients might have cyanopathy when the absorption ratio of Hb at 576 nm is lower than approximately 61%. Recently, the finger cot oxygen saturation technique has been increasingly used in clinical tissue oxygen supply monitoring, the principle of which is fixing the probe on the finger vertically and regarding the finger as a medium for transparent storage of Hb, using 660 and 940 nm near-infrared as incident light sources to measure the light transmission of the organ. Although it makes it easier to realize clinical tissue oxygen supply monitoring, the finger cot oxygen saturation technique has imperfections. As blood oxygen saturation is obtained using the unshrinking artery as the background and the shrinking artery as the foreground, the measurement results of this method are nothing but the Hb oxygen saturation of the small arteries when the vessel constricts. The results of the clinical measurement can show that the finger cot oxygen saturation technique can only detect oxygen saturation of the arterial blood.30 This has fatal flaws, such as relative result lags that make it difficult to evaluate and reflect organ blood oxygen saturation in time. The principle of the new detection method described in this study significantly differs from the finger cot oxygen saturation technique, for the changes in tissue during the constriction and dilation of blood vessels could actually be reflected through the alterations in the specific absorption spectra of Hb in the capillary bed, which could be realized by detecting the reflectance spectra of tissue at the Hb-specific absorption wavelengths. Because of the strong penetrability of the near infrared light, the near infrared tissue oximeters (including spatially-resolved spectroscopy and time-resolved spectroscopy) are always used to detect the oxygen supply level of the deep tissue (such as brain and muscles) and could not be used in the detection of the shallow blood vessels. Both the oxygen electrode method and the fiber optic oxygen sensor could detect the dissolved oxygen and the of the atmosphere, and the oxygen electrode method could even realize the tissue detection in scientific experiments, but neither has been used in clinical detection, because of their high traumatic feature. For the selection of the target wavelength (500 to 600 nm), which could arrive at the capillary layer of the dermis, the new detection method has its advantage in the detection of the capillary bed in the shallow organizations, such as lips and nail folds, the detection of which has certain clinical values in the diagnosis of hypoxia caused by cardiovascular diseases. The level of oxygen supply could be determined by detecting the of a particular point in tissue. This would be used to evaluate cardiovascular disease and other oxygen deficiency diseases indirectly. In addition, the scope of applicability of the new method is considerably wider than that of the cot oxygen saturation technique, because it could be used in such tissues as lips, tongue tip, and apex nasi, among others, not only in the finger. 5.ConclusionWe have plotted the absorption spectra of Hb when the decreases, and we have analyzed the specific absorption spectra of the Hb at a given wavelength. The specific relationship between the absorption ratio of Hb at a given wavelength and its related has been found, which has established a foundation for a new method to detect tissue during the constriction and dilation of blood vessels by detecting the reflectance spectra of tissue. This method has no relative result lags when compared with the finger cot oxygen saturation. Due to the conditional restrictions of the experiment, more accurate absorption ratios when disease occurs could not be obtained temporarily. Further research should be carried out, including specific spectral measurements of lip cyanosis for patients with cardiopulmonary insufficiency. AcknowledgmentsThis work was supported in part by the National Natural Science Foundation of China (Grant No. 30873238) and the Key Science and Technology Project of Guangdong Province of China (Grant No. 2007B031401010 and Grant No. 2011B031700056). ReferencesJ. MonodJ. WymanJ. P. Changeux,
“On the nature of allosteric transition: a plausible model,”
J. Mol. Biol., 12 88
–118
(1965). http://dx.doi.org/10.1016/S0022-2836(65)80285-6 JMOBAK 0022-2836 Google Scholar
M. F. Perutz,
“Stereochemistry of cooperative effects in haemoglobin: Haem–Haem interaction and the problem of allostery,”
Nature, 228
(5273), 726
–734
(1970). http://dx.doi.org/10.1038/228726a0 NATUAS 0028-0836 Google Scholar
M. F. Perutz,
“Regulation of oxygen affinity of hemoglobin: influence of structure of the globin on the heme iron,”
Annu. Rev. Biochem., 48 327
–386
(1979). http://dx.doi.org/10.1146/annurev.bi.48.070179.001551 ARBOAW 0066-4154 Google Scholar
M. F. Perutzet al.,
“Stereochemistry of cooperative mechanisms in hemoglobin,”
Cold Spring Harb Symp. Quant. Biol., 52 555
–565
(1987). http://dx.doi.org/10.1101/SQB.1987.052.01.063 CSHSAZ 0091-7451 Google Scholar
M. F. Perutz,
“Mechanisms regulating the reactions of human hemoglobin with oxygen and carbon monoxide,”
Annu. Rev. Physiol., 52 1
–25
(1990). http://dx.doi.org/10.1146/annurev.ph.52.030190.000245 ARPHAD 0066-4278 Google Scholar
R. G. ShulmanJ. J. HopfieldS. Ogawa,
“Allosteric interpretation of haemoglobin properties,”
Q. Rev. Biophys., 8
(3), 325
–420
(1975). http://dx.doi.org/10.1017/S0033583500001840 QURBAW 0033-5835 Google Scholar
K. Kanaoriet al.,
“T-quaternary structure of oxy human adult hemoglobin in the presence of two allosteric effectors, L35 and IHP,”
Biochimica et Biophysica Acta., 1807
(10), 1253
–1261
(2011). http://dx.doi.org/10.1016/j.bbabio.2011.06.004 0005-2736 Google Scholar
M. F. Perutz,
“Stereochemistry of cooperative effects in haemoglobin. The Bohr effect and combination with organic phosphates,”
Nature, 228
(5273), 734
–739
(1970). http://dx.doi.org/10.1038/228726a0 NATUAS 0028-0836 Google Scholar
J. KisterC. PoyartS. J. Edelstein,
“An expanded two-state allosteric model for interactions of human hemoglobin A with nonsaturating concentrations of 2, 3-diphosphoglycerate,”
J. Biol. Chem., 262
(25), 12085
–12091
(1987). JBCHA3 0021-9258 Google Scholar
J. KisterC. PoyartS. J. Edelstein,
“Oxygen-organophosphate linkage in hemoglobin A. The double hump effect,”
Biophys. J., 52
(4), 527
–535
(1987). http://dx.doi.org/10.1016/S0006-3495(87)83242-3 BIOJAU 0006-3495 Google Scholar
M. C. Mardenet al.,
“Effectors of hemoglobin. Separation of allosteric and affinity factors,”
Biophys. J., 57
(3), 397
–403
(1990). http://dx.doi.org/10.1016/S0006-3495(90)82556-X BIOJAU 0006-3495 Google Scholar
I. Lalezariet al.,
“New effectors of human hemoglobin: structure and function,”
Biochemistry, 29
(6), 1515
–1523
(1990). http://dx.doi.org/10.1021/bi00458a024 MIRBD9 0144-0578 Google Scholar
A. TsuneshigeS. ParkT. Yonetani,
“Heterotropic effectors control the hemoglobin function by interacting with its and states-a new view on the principle of allostery,”
Biophys. Chem., 98
(1–2), 49
–63
(2002). http://dx.doi.org/10.1016/S0301-4622(02)00084-4 BICIAZ 0301-4622 Google Scholar
T. Yonetaniet al.,
“Global allostery model of hemoglobin: modulation of -affinity, cooperativity, Bohr effect by heterotropic allosteric effectors,”
J. Biol. Chem., 277
(37), 34508
–34520
(2002). http://dx.doi.org/10.1074/jbc.M203135200 JBCHA3 0021-9258 Google Scholar
J. WangS. ZhuC. Xu, Biochemistry, 263 High Education Press, Beijing
(2002). Google Scholar
J. M. HoltG. K. Ackers,
“The hill coefficient: inadequate resolution of cooperativity in human hemoglobin,”
Meth. Enzymol., 455 193
–212
(2009). http://dx.doi.org/10.1016/S0076-6879(08)04207-9 MENZAU 0076-6879 Google Scholar
H. Hecht,
“Heart failure and lung disease,”
Circulation, 14 265
–290
(1956). http://dx.doi.org/10.1161/01.CIR.14.2.265 CIRCAZ 0009-7322 Google Scholar
C. LundsgaardD. D. Van Slyke,
“Cyanosis,”
Medicine, 2 1
–76
(1923). http://dx.doi.org/10.1097/00005792-192302000-00001 MEDIAV 0025-7974 Google Scholar
K. D. Carpenter,
“A comprehensive review of cyanosis,”
Crit Care Nurse, 13
(4), 66
–72
(1993). CCNUEV Google Scholar
S. Ogoh,
“The effect of phenylephrine on arterial and venous cerebral blood flow in healthy subject,”
Clin. Physiol. Funct. Imaging, 31
(6), 445
–451
(2011). http://dx.doi.org/10.1111/cpf.2011.31.issue-6 CPFICA 1475-0961 Google Scholar
M. Diopet al.,
“Comparison of time-resolved and continuous-wave near-infrared techniques for measuring cerebral blood flow in piglets,”
J. Biomed. Opt., 15
(5), 057004
(2010). http://dx.doi.org/10.1117/1.3488626 JBOPFO 1083-3668 Google Scholar
L. C. SorensenT. S. LeungG. Greisen,
“Comparison of cerebral oxygen saturation in premature infants by near-infrared spatially resolved spectroscopy: observations on probe-dependent bias,”
J. Biomed. Opt., 13
(6), 064013
(2008). http://dx.doi.org/10.1117/1.3013454 JBOPFO 1083-3668 Google Scholar
M. Kacprzaket al.,
“Time-resolved optical imager for assessment of cerebral oxygenation,”
J. Biomed. Opt., 12
(3), 034019
(2007). http://dx.doi.org/10.1117/1.2743964 JBOPFO 1083-3668 Google Scholar
S. Ijichiet al.,
“Quantification of cerebral hemoglobin as a function of oxygenation using near-infrared time-resolved spectroscopy in a piglet model of hypoxia,”
J. Biomed. Opt., 10
(2), 024026
(2005). http://dx.doi.org/10.1117/1.1899184 JBOPFO 1083-3668 Google Scholar
T. Hamaokaet al.,
“Quantification of ischemic muscle deoxygenation by near infrared time-resolved spectroscopy,”
J. Biomed. Opt., 5
(1), 102
–105
(2000). http://dx.doi.org/10.1117/1.429975 JBOPFO 1083-3668 Google Scholar
B. YuC. FengW. B. Hong,
“Characteristics and application of polarographic needle oxygen electrode,”
Journal of Zhejiang University, 25
(3), 266
–271
(1991). CHHPDK Google Scholar
J. ChaikenJ. Goodisman,
“On probing human fingertips in vivo using near-infrared light: model calculations,”
J. Biomed. Opt., 15
(3), 037007
(2010). http://dx.doi.org/10.1117/1.3431119 JBOPFO 1083-3668 Google Scholar
N. S. Eikjeet al.,
“Fiber optic near-infrared Raman spectroscopy for clinical noninvasive determination of water content in diseased skin and assessment of cutaneous edema,”
J. Biomed. Opt., 10
(1), 14013
(2005). http://dx.doi.org/10.1117/1.1854682 JBOPFO 1083-3668 Google Scholar
“Colour specification-The CIE 1931 standard colorimetric system and the CIE 1964 supplementary standard colorimetric system,”
(2012). http://www.jsa.or.jp/default_english.asp Google Scholar
Zhang Faping,
“The application of the finger cot oxygen saturation technique in the clinical care,”
Occupation and Health, 16
(3), 64
–65
(2000). Google Scholar
|