
|
|
1.IntroductionFluorescence correlation spectroscopy (FCS), a technique usually used to study particle diffusion in dilute solution, increasingly has been employed to assess the movement of diffusing particles in complex biological environments.1–5 FCS involves analysis of the temporal fluctuations in fluorescent emissions from a small, defined region of an illuminated sample and thereby measures number fluctuations. A unique characteristic of this method is that one can focus on the motions of fluorescent targets, while signals from nonfluorescent surroundings can be ignored. For this reason, FCS is increasingly used to study particles moving within complex environments, such as investigating the diffusion of molecules in crowded media,6,7 polymer gels,8–10 and in living cells.11–13 FCS also has been used to learn about the diffusion of viruses in biofilms,14 and to study fluorescent targets moving within embryos15,16 and tissue.17 A characteristic of such complex environments is that very often they are optically dense. Thus, even when extraneous fluorescence is negligible, the optical properties of the sample may complicate interpretation of FCS data. For example, if the refractive index of the sample differs significantly from that of a simple aqueous solution, the use of an oil immersion lens, or the incorrect choice of cover slip, can lead to a distortion of the shape and size of the optical volume into which particles diffuse, yielding erroneous results.18 Significant errors also can arise when detector and illuminating apertures are improperly chosen.19 Here, we consider how an FCS measurement can be affected if the sample properties result in significant scattering of the incident light. This may be of particular concern when FCS is used to study complex media such as biofilms, tissues, live cells, or gels. In order to emulate an optically dense environment, we studied the effects of multiple scattering occurring within solutions of nonabsorptive, spherical beads. In particular, we measured FCS autocorrelation functions of Atto 488 dye molecules diffusing in solutions of polystyrene latex beads, which acted as scatterers. Analysis of our data indicated that for the chosen experimental set-up, expansion of the illuminated volume due to the scattering of the incident light resulted in only a small increase in diffusion time, irrespective of scatterer concentration or size. To further analyze our experimental results and to characterize the beam profile distortion, we performed Monte-Carlo simulations and calculated the migration paths of photons incident on a three-dimensional (3-D) cubic box filled with spherical beads (thus modeling our experimental set-up). A geometrical layout was chosen in which the light was focused into a cone, representing an idealization of the FCS excitation profile generated with a microscope objective (Fig. 1). We simulated beam profiles expected in hypothetical solutions of microscopic particles that scatter preferentially in the forward direction and calculated the effects of degree of scattering, represented by the scattering coefficient, , of the incident focused beam of photons that traverse the medium. Fig. 1Cartoon illustrating photon transport within a region populated with spherical scattering beads. The input parallel flux of photons, here shaped into a cone at the port of entry, mimics the focusing effect of a microscope objective.  The most significant effects observed were a broadening of the beam along the axial direction and reduction of the incident intensity at the focal point, whereas only small changes in the scattering profile in the tangential directions were discerned. Hence, broadening of the volume in the axial direction accounted for the effect of volume increase on diffusion time, but this is small because diffusion events in the radial direction are the predominant source of fluctuating signal in FCS measurements. 2.FCS TheoryTypically, time autocorrelation functions are calculated from the temporal fluctuations of the fluorescent signal, , emitted by the sample. The intensity-intensity autocorrelation functions, , are then analyzed to determine physical parameters, the quantity of interest frequently being the translational diffusion coefficient of fluorescent targets. Delineation of the illuminated volume from which the detected fluorescence emanates is necessary in order to interpret the data. In simple FCS applications, a Gaussian functional form for the intensity profile of the incident and detected beams, , is often assumed, with and characterizing, respectively, the width of the beam spot on the focal plane and its length along the optical axis defined by the direction of the beam. These parameters usually are determined from FCS measurements of fluorophores having known diffusivities. Their values are then used in the analysis of FCS signals collected from the samples under investigation. This scheme works well as long as the solutions remain optically clear. However, in some instances one might need to account for possible distortion of the incident beam profile due to the scattering of light by the surrounding medium. In general, for the case of single fluorescent particles, one should be able to fit the autocorrelation function to a mathematical expression of the form , where is a function of parameters , related to the movement of the targets, and parameters , which describe the geometrical structure of the region from which the detected fluorescence arises. The quantity represents the average number of particles in that region, which in ideal cases corresponds to the excitation volume. When the sample is illuminated with a 3-D Gaussian beam, one can derive the following expression for the autocorrelation function: for freely diffusing, monodisperse particles. In Eq. (1), denotes an instrumental constant and depends on the profile of the detected Gaussian beam; and are characteristic “diffusion times” along the radial and axial directions, respectively, where is the translational diffusion coefficient of the particles. Note that, if , the expression in Eq. (1) can be reduced to that of two-dimensional (2-D) diffusion along the radial plane, this often being an appropriate approximation when measuring motion on, or within, a thin membrane.20In addition to the parameters , , and , the average fluorescence, , is obtainable from an FCS measurement. Here , which is proportional to , is recorded directly from the photodetector, whereas can be estimated independently from the limiting value of the amplitude of the correlation function, , which according to Eq. (1) is equal to . In contrast, and are determined from fitting the correlation function with the expression in Eq. (1). Another parameter inferred from the autocorrelation function is the apparent brightness per fluorescent particle, which is defined as: The quantity , which indicates the apparent number of emitted photons per individual fluorescent particle at a given incident beam intensity, will change if the incident beam is attenuated. However, will depend on the effective illuminated and detected volumes, both of which might be distorted due to scattering from the medium through which the particles move. We also express the apparent volume as where is the actual molar concentration of the fluorophore and is Avogadro’s Number. 3.Monte-Carlo SimulationsThe modeling of multiple scattering in optically turbid media has been the focus of many studies.21 In particular, photon diffusion models oftentimes are used to describe the effect of the scatterers when an incident beam impinges upon a highly turbid medium.22 However, it is much more challenging to calculate the effects of scatterers in the regime of intermediate turbidity, for which quasi-particle photonic approaches have been used23 and Monte-Carlo methods have been applied to simulate the migration of the photons.24 In this work, we consider multiply scattering media, though for the lowest scattering case () single scattering paths could also be present, thereby, rendering Monte-Carlo simulations a useful computational approach. In our simulations, we consider the incident excitation to be a parallel, cylindrical beam of light impinging the scattering medium through a focusing lens (Fig. 1). If we assume an ideal lens and consider scattering to be insignificant, the beam is shaped into a cone as it traverses the sample of interest. The sharpness of the cone and the size of the focal spot in the medium depend mainly on the numerical aperture of the microscope objective, the size of the incident beam, and the refractive index of the medium under consideration. Using the theory of Gaussian optics, one can calculate the size of the spot, which is subject to the diffraction limit. Two basic parameters determine the dispersion of the beam, namely the scattering coefficient and the directionality factor . The value corresponds to the homogeneous scattering of photons with equal probability into all scattering angles. For the case , the scattering is forward-biased with full transmission of the photon along its incident direction. 4.Materials and Methods4.1.Reagents and Sample PreparationA stock solution of Atto 488 dye (Sigma-Aldrich, St. Louis, MO) was prepared in deionized water at a concentration of 0.6 μM. Duke Standards™ polystyrene latex beads with diameters of 0.4 μm (), 1 μm (), and 3 μm () were purchased from Thermo Scientific (Fremont, CA). Various concentrations of polystyrene bead solutions were prepared by dilution in deionized water. The scattering properties of the solutions, such as the scattering coefficient, , and directionality factor, , were calculated with a program (“Mie Scattering Calculator,” developed by Scott Prahl) which can be found in the public domain at http://omlc.ogi.edu/calc/mie_calc.html. The polystyrene bead solutions were sonicated prior to measurements in order to avoid cluster formation. The solutions of Atto 488 and polystyrene beads of a desired diameter were then mixed to give a final concentration of 12 nM Atto 488 and bead concentration of 0.05% to 0.2% . Samples of 50 μl were transferred to CoverWell™ perfusion chamber gaskets (Molecular Probes, Carlsbad, CA) for FCS measurements. The chambers were sealed to avoid evaporation. 4.2.FCS MeasurementsMeasurements were made with a portable FCS instrument (Hamamatsu Corporation, Bridgewater, NJ; model C9413) containing a 473 nm LD-pumped solid-state laser, a high sensitivity photomultiplier tube with low afterpulsing, a 25 μm diameter pinhole for confocal detection, and a water-immersion objective (Olympus UApo 40X W/340; ). Built-in numerical code was used to correlate the time-sequence of detected photon counts. For most measurements, the 1 mW input laser beam was attenuated to 10 μW by a neutral density filter. The microscope objective was set so that the focused spot in each sample was at the same distance (100 μm) from the inner surface of the coverslip, in order to introduce the same amount of scattering. Acquisition times of approximately 200 s were used to optimize signal-to-noise ratio. All measurements were performed at 22°C. A minimum of six independent measurements were performed for each condition. The instrument was calibrated with Rhodamine 6G in water ( in water),25 by which was estimated to be . Time autocorrelation functions were fitted using the software package developed by Hamamatsu and included with the instrument. Short delay times were not fitted due to excessive noise from laser afterpulsing at delay times lower than 0.005 ms. The expression in Eq. (1) was used to fit all data. In all cases, the goodness of fit was judged by inspecting residuals. In addition, we expressed the apparent illuminated volume as where is the concentration of Atto 488 as measured via absorbance (; SpectraMax Plus, Molecular Devices). 4.3.Monte-Carlo CalculationsMonte-Carlo simulations were undertaken to assess the effects of multiple light scattering on the shape of the illuminating beam. We used a quasi-particle description of light and computed the movement of photons in an environment, which we envision as being crowded with individual scatterers whose scattering properties can be varied. The illuminated volume was taken as an optically homogeneous continuum and the photon intensity within the sample was evaluated by dividing the scattering medium into a high-resolution grid. Consonant with the optical diffraction limit, we set the grid-size to , where denotes the index of refraction of the nonscattering background (e.g., water) and is the wavelength of the monochromatic incident beam (473 nm). The Monte-Carlo code allowed us to track paths of photons, where we approach a stable path distribution as increases to a large number. In most of our simulations, was photons, providing accurate representations of the scattering paths of the photons. In order to determine how an increase in scattering properties of the medium affects the illuminated volume profile, we considered a medium of increasing scattering coefficient, , 20, and a constant directionality factor, . 5.Results5.1.Fluorescence Correlation SpectroscopyFCS correlation functions for Atto 488 were collected in solutions of polystyrene latex beads. The dye molecule, Atto 488, was chosen as a representative small particle, because it does not interact with the beads and thus, allows us to explore an optical phenomenon, namely the effect of multiple scattering on the FCS measurements. The bead concentration and size determined the multiple scattering introduced into the system as represented by the reduced scattering coefficient, (Table 1). An increase in the size or concentration of the scatterers leads to an increase in . Because solutions of polystyrene beads are frequently used and are well-characterized scattering media that do not absorb light in the visible spectrum,26–28 we were able to model scattering environments in a controlled and predictable manner. We performed absorbance measurements () to confirm that the solutions were multiply scattering [Fig. 2(a)]. In accordance with the “opaque” appearance of the solutions [Fig. 2(b)], we observed a robust increase in optical density (OD) with increase in polystyrene bead concentration (), indicative of multiple scattering. Fig. 2Optical density of polystyrene beads as a function of polystyrene bead concentration. All beads were 3 μm in diameter. (a) The optical density at 488 nm showed a linear increase with increase in polystyrene bead concentration. (b) The polystyrene solution becomes visually more opaque with increase in bead concentration. 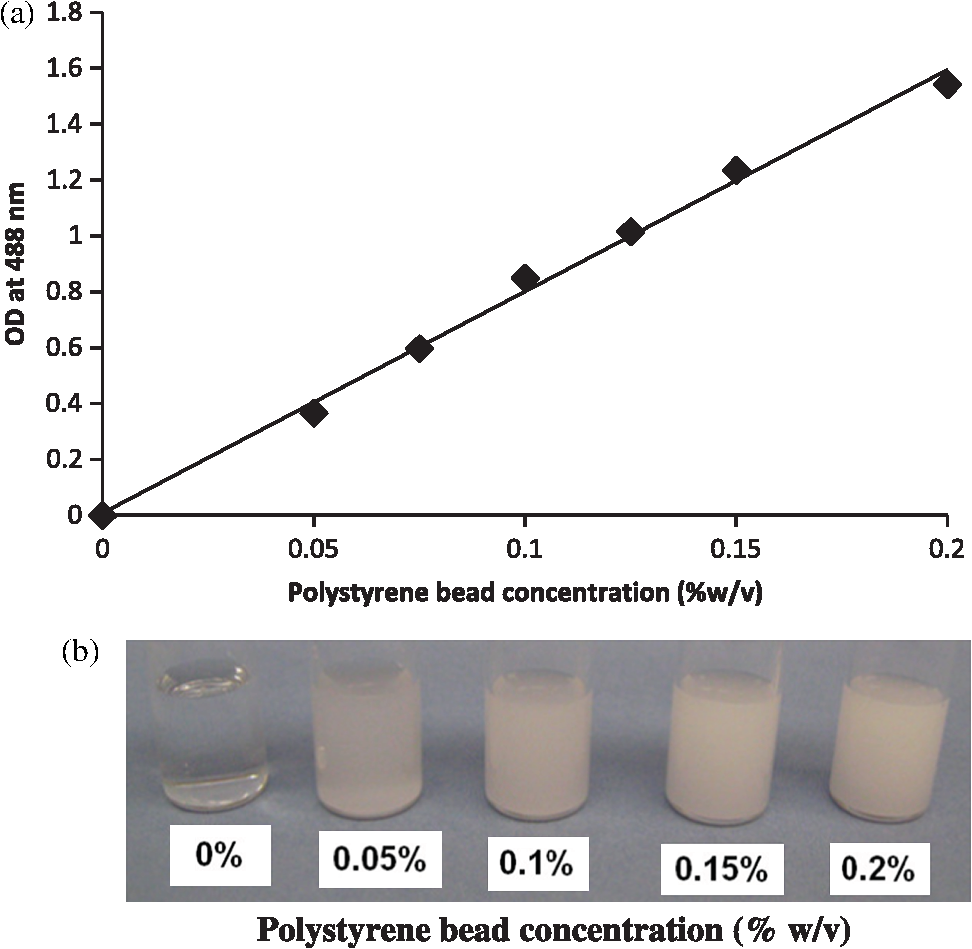 Table 1The reduced scattering coefficient, μs′= μs(1−g), as a function of polystyrene bead concentration (when bead diameter=3 μm) and diameter (when bead concentration=0.050% w/v). Both scatterer concentration and size affect the scattering properties of the solution, with size having the more profound effect.
It also has to be noted that the addition of polystyrene beads of various sizes and concentrations did not induce measureable pH changes and thus all solutions were prepared in deionized water as opposed to a buffered environment. In addition, we performed FCS measurements of Atto 488 in 1X phosphate buffered saline (PBS) solution of pH 7.4 and confirmed that the measured parameters, namely diffusion time, , apparent particle brightness, , and apparent number of fluorescent molecules, , were not statistically different from those in deionized water (data not shown). Using the expression in Eq. (1), we fit the measured correlation functions to determine the apparent diffusion times of Atto 488 in the various media. The correlation function of Atto 488 in water is well-fit by this 3-D expression, using , , and as fitting parameters (Fig. 3). We also used the 2-D expression obtained when , corresponding to the case of . Upon comparing the residuals of both fits, we note that the 3-D fit is slightly better. However, for most purposes the differences between the residuals of the 2-D and 3-D data fittings are insignificant [see Fig. 3(b) and 3(c)]. In Fig. 4 we show the correlation function [Fig. 4(a)], as well as the fitting residuals [Fig. 4(b) and 4(c)], for the case of Atto 488 diffusing in a 0.2% polystyrene bead () solution. We again fit the correlation function with the 2-D expression of Eq. (1) () and the 3-D expression (in which the -value is fixed to that determined from fitting the FCS correlation of Atto 488 in water). Both the 2-D and 3-D fit show similar residuals, indicating the irrelevance of the -component to the fluorescence fluctuations. Fig. 3(a) Measured normalized FCS autocorrelation function of Atto 488 in water plotted against the delay time. Autocorrelation function residuals as a measure of the goodness of the fit for (b) the 2-D expression and (c) 3-D expression. Note the slightly better fit with the 3-D expression in Eq. (1) than with the 2-D expression where .  Fig. 4(a) Measured normalized FCS correlation function of Atto 488 in 0.2% polystyrene bead solution. Autocorrelation function residuals as a measure of the goodness of the fit for (b) the 2-D expression and (c) 3-D expression. In this case the fit with the 2-D expression in Eq. (1) () is equivalent to the full expression, indicating the irrelevance of the direction (i.e., axial diffusion).  To further investigate the effect of multiple light scattering on the apparent fluorophore diffusivity, we plotted the diffusion times, normalized by the diffusion time of Atto 488 in water, , as a function of bead () concentration [Fig. 5(a)]. Note that an increase in bead concentration leads to a significant increase in scattering by the media (Table 1). A marginal 10% decrease in apparent diffusivity was observed between Atto 488 in water and Atto 488 in the bead solution, with no significant differences between the diffusivities of Atto 488 in bead solutions of different concentrations. The highest concentration of polystyrene beads that we were able to use was 0.2% , due to high solution opacity and loss of FCS signal when this concentration was exceeded. It has to be noted that this concentration limit is dependent on the chosen laser power, dye concentration, and detection slit size. By increasing any of the above, FCS measurements could be achieved even in media of higher scattering properties. However, adjustment of these parameters has to be done with caution, as an increase in laser power, for example, could lead to other measurement artifacts such as illuminated volume saturation, activation of triplet states, and photobleaching. In addition, working in the dilute particle regime, where the overall physical interaction between the fluorophores and the beads is small, allowed us to exclude the effect of crowding on the diffusivity of Atto 488. Fig. 5(a) Apparent diffusion times of Atto 488, plotted against polystyrene bead concentration. Note the associated changes in reduced scattering coefficient expressed in Table 1. (b) Apparent brightness of Atto 488 decreases as a function of polystyrene bead concentration because of multiple scattering that affects the FCS beam profile. (c) Illuminated volume, , increases as a function of polystyrene bead concentration due to multiple scattering that affects the FCS beam profile. The error bars represent SD for a minimum of six independent measurements. 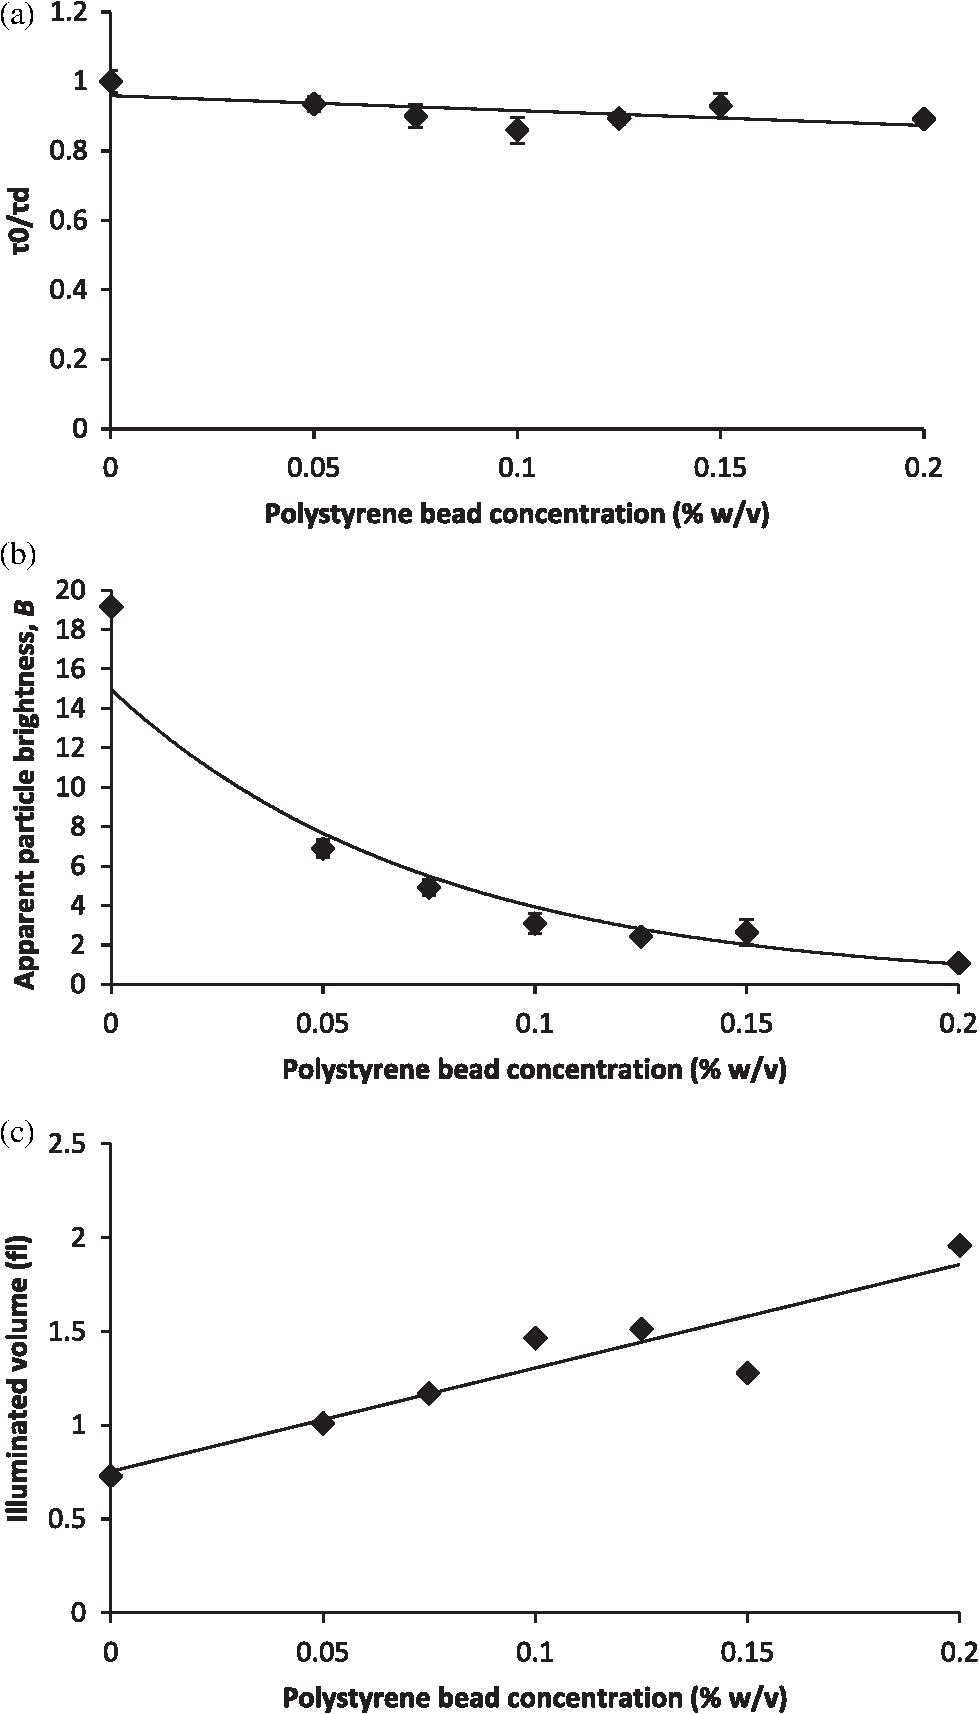 Over the concentration range studied here, the values of appear to be very close [Fig. 5(a)]. Due to the opaque appearance of the solutions [see Fig. 2(b)], we hypothesize that the slight decrease in fluorophore diffusivity is due to multiple light scattering from the media. When similar experiments were performed in optically clear media containing Ludox™ beads (colloidal silica, ) or Ficoll 70 (polymer of MW 70,000 Da and ),29 a decrease in diffusivity was observed only when a threshold bead concentration associated with crowding was obtained (data not shown). From our FCS measurements of Atto 488, we also determined changes of and as a function of polystyrene bead concentration (). In Fig. 5(b) we plot the apparent particle brightness, , of the fluorophore, which is the value of the brightness [see Eq. (2)] scaled by its value in water, . The figure shows a systematic decrease of apparent particle brightness with an increase in bead concentration. In order to rule out possible effects of quenching of the Atto 488 fluorescence by the polystyrene beads, which would affect the measured apparent particle brightness, we measured the fluorescence of Atto 488 in water and in the presence of the beads. As a control, we also measured the fluorescence of the beads alone. We employed the same dye and bead concentrations that were used in our FCS measurements (data not shown). Upon correcting for minimal fluorescent signal from the polystyrene beads, we did not see a difference in the fluorescence of Atto 488 in the presence of the beads at any bead concentration, indicating that fluorescence quenching is not responsible for the decrease in apparent particle brightness. We also estimated the change in effective illuminated volume, , as a function of polystyrene bead concentration [Fig. 5(c)] where, as before, is the actual fluorophore concentration, is Avogadro’s number, and is the measured apparent number of fluorophores which, on average, are in the effective detected volume [see Eq. (1)]. We estimated that the illuminated volume in 0.2% polystyrene beads solution linearly increased by 62% from that in water. Taken together, the results in Fig. 5 indicate that 62% in volume increase leads to only a 10% decrease in apparent diffusivity. Finally, we analyzed the effect of polystyrene bead diameter, namely 0.4, 1, and 3 μm, where the particle size significantly affecting the solutions’ scattering properties (concentration for all ; refer to Table 1 for values), on Atto 488 diffusivity, apparent particle brightness, and effective illuminated volume size (Fig. 6). As expected, our results indicated that normalized diffusion time did not change with increase in particle size, [Fig. 6(a)], while the apparent particle brightness decreased [Fig. 6(b)], and the illuminated volume increased [Fig. 6(c)]. Fig. 6(a) Apparent diffusion times of Atto 488 plotted against polystyrene bead size. Note the associated changes in the scattering coefficient expressed in Table 1. (b) Apparent brightness of Atto 488 decreases as a function of polystyrene bead size because of multiple scattering that affects the FCS beam profile. (c) Illuminated volume also increases as a function of polystyrene bead size due to multiple scattering. The error bars represent SD for a minimum of six independent measurements. 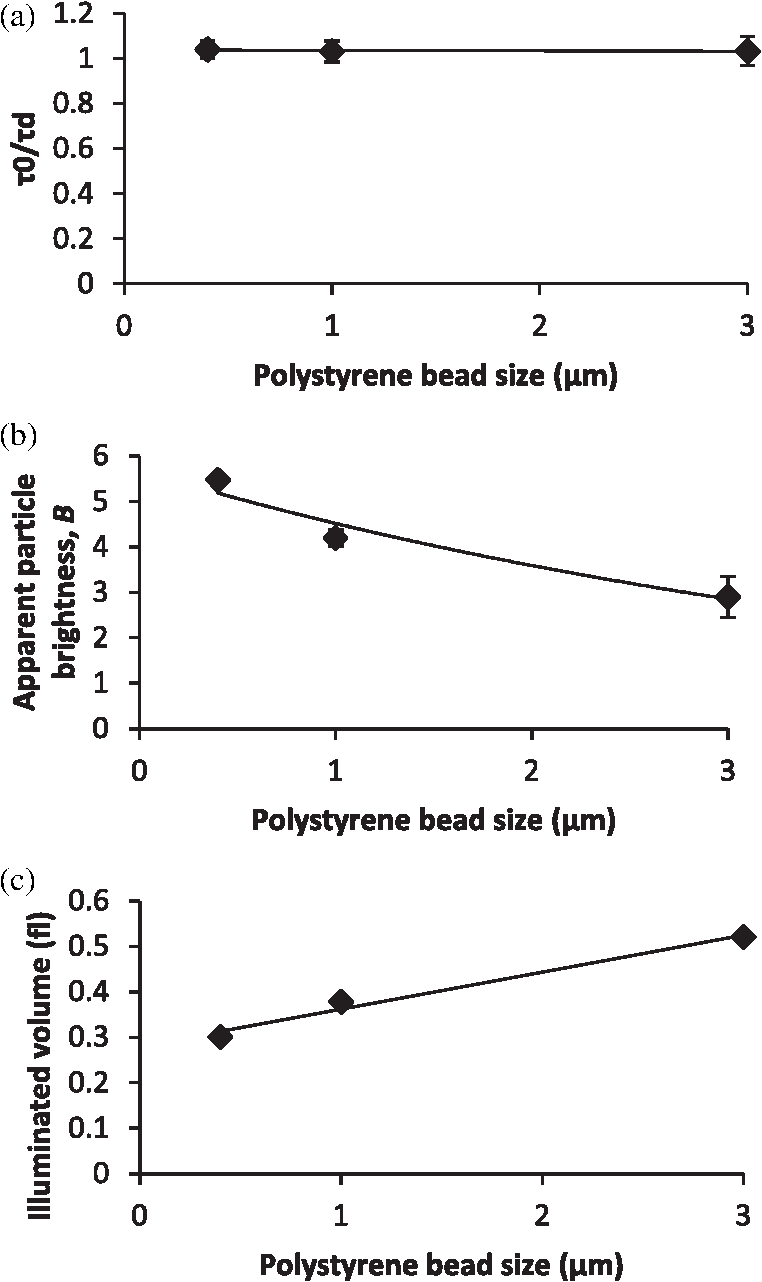 5.2.Monte-Carlo ResultsTo illustrate the significance of scattering on an incident focused beam, we show in Fig. 7 the spatial distributions of the photons (i.e., the beam profiles), calculated for various values of the scattering coefficient (, 10, 20, ) when . These values were chosen arbitrarily but encompass the and values used in our FCS experiments. Here, we see how increased scattering will eventually degrade the confocal spot. We observe systematic smearing of the focal spot due to changes in the photon paths as the scattering coefficient increases. Qualitatively, similar results are obtained in simulations when (data not shown). Fig. 7Simulated beam profile intensity (in logscale), shown along a plane containing the -axis, as a function of the scattering coefficient, : (a) (no scatterers); (b) ; (c) ; and (d) . As the photons are exposed to media of increasing scattering, the profiles appear to broaden. In these calculations the anisotropy coefficient was taken to be 0.9 in order to emulate that of the polystyrene bead solutions.  Additional information on the distributions shown in Fig. 7 can be obtained from curves of the intensity profiles along the axial plane (i.e., a plane perpendicular to the focusing lens and traversing the focal spot) and along the radial plane (i.e., a plane parallel to the focusing lens and traversing the original focal spot). In Fig. 8 we show these profiles, normalized to their maxima, for the different values of the scattering coefficient. Figure 8 confirms the increased smearing of the beam along the -axis with increase of the scattering coefficient. It also shows the radial profile at the nominal focal point, indicating no loss in the symmetry of the curves along the radial direction of the focal spot. Moreover, we see that the intensity at the focal point is decreased due to scattering of the light as the beam penetrates the sample. It is clear that with increasing the beam flattens along the direction and the effective width associated with beam spreading in the lateral directions also increases. However, the effect on the diffusion time is muted because the intensity in the center of the beam greatly exceeds that in the wings. Additionally, the effective focal point moves away from the nominal focal point when the scattering increases, but even for the most highly scattering case considered here, the change in focal position is relatively small. Fig. 8Intensities shown in Fig. 7, here presented as beam profiles. Symbol designated solid line: intensity along the -axis (perpendicular to the lens), shown as a function of the scattering coefficient, , where , 10, 20, and . Note the broadening and skewness of the profiles with increasing values of ; Solid line: intensities along a line parallel to the radial plane and passing through the focal point of the lens. Note the symmetrical profiles. 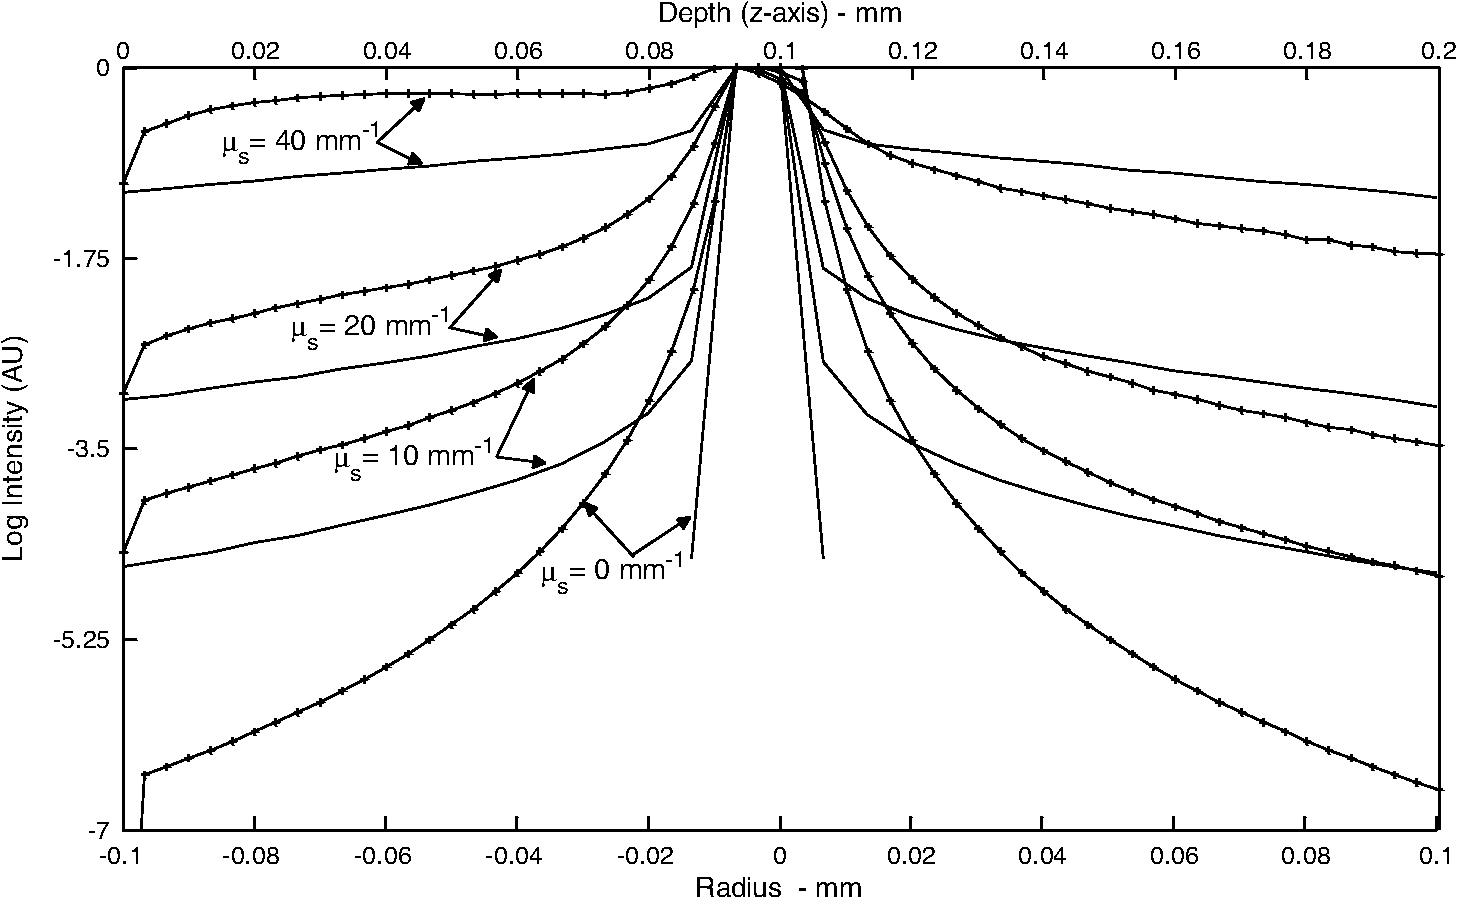 It is important to emphasize that Figs. 7 and 8 relate to media of sufficiently high optical turbidity to preclude collection of autocorrelation data for our FCS experimental set-up. With our equipment, the threshold for collecting data with meaningful signal-to-noise ratio in reasonable time was found to be 0.2% bead concentration when using 3 μm diameter beads, which corresponds to of and of 0.88. Therefore, the effects of multiple scattering on the illuminated beam profile in our system were less dramatic than seen in Figs. 7 and 8. It has to be noted, that our Monte-Carlo analysis is incomplete because we have considered only effects of scattering on the incident beam and not the emitted light. However, the primary purpose of the simulations is to understand generalities about the effects of multiple scattering, in particular the relative importance of changes in the scattering volume in the directions parallel to and perpendicular to the axis of the incident beam (see discussion following Figs. 4 and 7). On the basis of the results shown in Fig. 8, one might infer that any additional volume distortion due to scattering of the emitted photons will generally be small, since the number of photons collected from the edge of the illuminated volume will be negligible and further dispersed by their travel back to the detector. 6.DiscussionTurbid media may give rise to scattering of light, which can distort the profile of an incident beam. For FCS studies of fluorescent particles moving in such media, the distortions may introduce artifacts since the characteristics of the beam profile could affect data analysis.19,30 For example, it has been demonstrated that enlargement of the illuminated volume due to excitation saturation can lead to an artificial increase in probe diffusion times.31 Thus, the goal of this paper was to provide insight on the effect of multiple scattering in FCS measurements, particularly with respect to measured particle diffusion times. In addition, we performed Monte-Carlo simulations in order to illustrate the effects of scattering on the beam profile. As a model system, we considered a fluorescent probe diffusing in a solution of nonfluorescent multiply scattering polystyrene latex beads, and asked how the FCS parameters , , , , , and , which are defined in Eqs. (1) and (2), are affected by the level of scattering of the nonfluorescent medium. In order to avoid the effect of crowding on the above parameters, experiments were performed only in the dilute concentration regime, i.e., polystyrene beads, where the movement of the fluorophores was not significantly affected by the presence of the scattering beads. By examining the effect of scatterer concentration on the fluorophore diffusion times, we found only a minimal decrease in apparent Atto 488 diffusivity in the presence of the beads [Fig. 5(a)]. Similarly, Atto 488 diffusion was unaffected by scatterer size [Fig. 6(a)]. The conditions pertaining here to the most extreme case (0.2% polystyrene beads, ) are representative of a multiply scattering environment with a scattering coefficient, , of and . For comparison, of biological tissues is in the range ,32,33 and of undiluted homogenized milk and 20% solids Intralipid (an optical phantom of multiple scattering) are , and , respectively.34 Thus, our model system exhibited biologically relevant scattering properties, albeit on the lower end of the spectrum, and allowed us to explore the effect of scattering in a systematic and reproducible manner. For the conditions studied, we found a significant decrease in apparent particle brightness due to attenuation of laser beam intensity [Figs. 5(b) and 6(b)]. We also observed an increase in apparent particle number, , indicating an increase in effective illuminated volume [see Figs. 5(c) and 6(c)]. Equation (1) helps us understand the connection between diffusion and illuminated volume profile. In Eq. (1), for which the illuminated volume is modeled as a Gaussian beam profile in both the radial and axial directions, we see that the correlation function is more sensitive to diffusion into the radial than in the axial direction. Thus, if the volume increase were related to volume distortion predominantly in the axial direction, diffusion time would be minimally affected. Overall, for the system studied here, it appears that a critical loss of intensity happens at a sufficiently low degree of multiple scattering that significant change in diffusion coefficient due to modification of the scattering volume could not be detected. We utilized Monte-Carlo simulations in order to visualize and quantify the illuminated volume profile. For simplicity, rather than using a Gaussian approximation for the beam profile, we employed a simplified geometrical configuration where the original profile (no scattering) is shaped as a cone, yielding triangular profiles along the axial or radial directions. Quantities equivalent to the parameters and in Eq. (1) were defined as the variances of the intensity profiles, and calculated numerically. The simulations indicate that scattering indeed affects and differently, showing that broadening along the axial direction, , is more pronounced than along the radial plane, . Additionally, although in principle it is necessary to fit the data with three parameters, the profile along the direction can be so flat () that its contribution to the correlation function would be insignificant. Our FCS measurements corroborate this result. In general, the intensity at the focal spot could drop substantially in multiply scattering media, as indicated by our FCS measurements of apparent particle brightness. For fluorescent probes present at the focal spot, this intensity reduction means fewer incident photons available for exciting the probes, which will be reflected as a diminution of the measured average fluorescence intensity, . Moreover, the fluorescently emitted photons will undergo scattering as they migrate back to the detector. The majority of the photons that reach the detector will be those that originated within the excitation cone of the delivery optics. When using a single lens for both the exciting and emitted photons, the loss of those fluorescent photons due to scattering could be similar to that of the incident photons. Our Monte-Carlo simulations indicate, though, that the mean penetration depth of photons is relatively unaffected by scattering, suggesting little shift of the focal plane. Thus, to first order, there should be no need to adjust the original location of the detection image-plane. We emphasize that our simulations were performed using spherical, nonabsorptive beads and a simplified geometrical configuration for the optical focusing path. However, these approximations should not affect the qualitative results of our calculations. Although absorption could lower the number of photons that travel deep into the scattering sample and thereby further reduce the apparent fluorescence emission per particle, such considerations could be investigated by simulations similar to those presented here. Finally, our results have greater generality in that, although represented for particular scattering media (, 20, and ), they pertain to other values of and that have identical values of scaled scattering lengths, . 7.ConclusionsMultiple scattering is characteristic of many complex biological media such as tissues, cells, and biofilms. Due to the increased interest in using FCS for estimating probe diffusion in such environments (particularly single-photon FCS), assessment of artifacts associated with such measurements is necessary. Thus, in this work we modeled a multiply scattering environment in a controlled manner by using polystyrene latex beads of various concentrations and sizes. We hypothesized that scattering will distort the illuminated beam profile and, consequently, will increase the illuminated volume and the probe diffusion times. As expected, our results indicate that scattering leads to an increase in apparent illuminated volume. However, as shown by our Monte-Carlo simulations, the volume distortion was primarily in the axial direction and therefore affected the measured probe diffusion time less than expected. Multiple scattering from the medium also leads to a decrease in apparent particle brightness such that, in our FCS set-up, low signal-to-noise ratio led to loss of correlation function for a threshold scattering parameters of and . Collectively, our results indicate that multiple scattering by itself does not cause significant FCS measurement artifacts, in particular altered diffusion times. Single-photon FCS is an excellent technique for measuring probe diffusivity in such complex environments, as long as an autocorrelation function is obtainable and the medium is homogeneous over length scales several times larger than the dimensions of the incident beam. AcknowledgmentsThis work was supported by funds from the Intramural Research Program of the Eunice Kennedy Shriver National Institute of Child Health and Human Development, National Institutes of Health. It was also supported by funding from the National Science Foundation (NSF Grant #0630388) and the National Aeronautics and Space Administration (NASA Grant #NNX09AU90A). ReferencesW. W. Webb,
“Fluorescence correlation spectroscopy: inception, biophysical experimentations, and prospectus,”
Appl. Opt., 40
(24), 3969
–3983
(2001). http://dx.doi.org/10.1364/AO.40.003969 APOPAI 0003-6935 Google Scholar
E. L. Elson,
“Quick tour of fluorescence correlation spectroscopy from its inception,”
J. Biomed. Opt., 9
(5), 857
–864
(2004). http://dx.doi.org/10.1117/1.1779234 JBOPFO 1083-3668 Google Scholar
E. HausteinP. Schwille,
“Fluorescence correlation spectroscopy: novel variations of an established technique,”
Annu. Rev. Biophys. Biomol. Struct., 36
(1), 151
–169
(2007). http://dx.doi.org/10.1146/annurev.biophys.36.040306.132612 ABBSE4 1056-8700 Google Scholar
R. Rigler,
“Fluorescence and single molecule analysis in cell biology,”
Biochem. Biophys. Res. Commun., 396
(1), 170
–175
(2010). http://dx.doi.org/10.1016/j.bbrc.2010.04.070 BBRCA9 0006-291X Google Scholar
M. A. DigmanE. Gratton,
“Lessons in fluctuation correlation spectroscopy,”
Annu. Rev. Phys. Chem., 62 645
–668
(2011). http://dx.doi.org/10.1146/annurev-physchem-032210-103424 ARPLAP 0066-426X Google Scholar
E. DautyA. S. Verkman,
“Molecular crowding reduces to a similar extent the diffusion of small solutes and macromolecules: measurement by fluorescence correlation spectroscopy,”
J. Mol. Recognit., 17
(5), 441
–447
(2004). http://dx.doi.org/10.1002/(ISSN)1099-1352 JMORE4 1099-1352 Google Scholar
S. P. ZustiakR. NossalD. L. Sackett,
“Hindered diffusion in polymeric solutions studied by fluorescence correlation spectroscopy,”
Biophys. J., 101
(1), 255
–264
(2011). http://dx.doi.org/10.1016/j.bpj.2011.05.035 BIOJAU 0006-3495 Google Scholar
A. Michelman-Ribeiroet al.,
“Structural changes in polymer gels probed by fluorescence correlation spectroscopy,”
Macromolecules, 37 10212
–10214
(2004). http://dx.doi.org/10.1021/ma048043d MAMOBX 0024-9297 Google Scholar
S. P. ZustiakH. BoukariJ. B. Leach,
“Solute diffusion and interactions in cross-linked poly(ethylene glycol) hydrogels studied by fluorescence correlation spectroscopy,”
Soft Matter, 6
(15), 3609
–3618
(2010). http://dx.doi.org/10.1039/c0sm00111b 1744-683X Google Scholar
T. Stylianopouloset al.,
“Diffusion of particles in the extracellular matrix: the effect of repulsive electrostatic interactions,”
Biophys. J., 99
(5), 1342
–1349
(2010). http://dx.doi.org/10.1016/j.bpj.2010.06.016 BIOJAU 0006-3495 Google Scholar
M. Weisset al.,
“Anomalous subdiffusion is a measure for cytoplasmic crowding in living cells,”
Biophys. J., 87
(5), 3518
–3524
(2004). http://dx.doi.org/10.1529/biophysj.104.044263 BIOJAU 0006-3495 Google Scholar
S. A. KimK. G. HeinzeP. Schwille,
“Fluorescence correlation spectroscopy in living cells,”
Nat. Methods, 4
(11), 963
–973
(2007). http://dx.doi.org/10.1038/nmeth1104 1548-7091 Google Scholar
H. T. HeD. Marguet,
“Detecting nanodomains in living cell membrane by fluorescence correlation spectroscopy,”
Annu. Rev. Phys. Chem., 62 417
–436
(2011). http://dx.doi.org/10.1146/annurev-physchem-032210-103402 ARPLAP 0066-426X Google Scholar
R. Briandetet al.,
“Fluorescence correlation spectroscopy to study diffusion and reaction of bacteriophages inside biofilms,”
Appl. Environ. Microbiol., 74
(7), 2135
–2143
(2008). http://dx.doi.org/10.1128/AEM.02304-07 AEMIDF 0099-2240 Google Scholar
S. R. Yuet al.,
“Fgf8 morphogen gradient forms by a source-sink mechanism with freely diffusing molecules,”
Nature, 461
(7263), 533
–536
(2009). http://dx.doi.org/10.1038/nature08391 NATUAS 0028-0836 Google Scholar
X. Shiet al.,
“Probing events with single molecule sensitivity in zebrafish and Drosophila embryos by fluorescence correlation spectroscopy,”
Dev. Dyn., 238
(12), 3156
–3167
(2009). http://dx.doi.org/10.1002/dvdy.v238:12 DEDYEI 1097-0177 Google Scholar
J. LeeS. MasatoU. KiminoriJ. Mochida,
“Measurement of diffusion in articular cartilage using fluorescence correlation spectroscopy,”
BMC Biotechnol., 11
(1), 19
(2011). http://dx.doi.org/10.1186/1472-6750-11-19 1472-6750 Google Scholar
J. Enderleinet al.,
“Performance of fluorescence correlation spectroscopy for measuring diffusion and concentration,”
Chemphyschem., 6
(11), 2324
–2336
(2005). http://dx.doi.org/10.1002/(ISSN)1439-7641 CPCHFT 1439-4235 Google Scholar
S. T. HessW. W. Webb,
“Focal volume optics and experimental artifacts in confocal fluorescence correlation spectroscopy,”
Biophys. J., 83
(4), 2300
–2317
(2002). http://dx.doi.org/10.1016/S0006-3495(02)73990-8 BIOJAU 0006-3495 Google Scholar
L. Wawreziniecket al.,
“Fluorescence correlation spectroscopy diffusion laws to probe the submicron cell membrane organization,”
Biophys. J., 89
(6), 4029
–4042
(2005). http://dx.doi.org/10.1529/biophysj.105.067959 BIOJAU 0006-3495 Google Scholar
J. M. SchmittA. H. GandjbakhcheR. F. Bonner,
“Use of polarized light to discriminate short-path photons in a multiply scattering medium,”
Appl. Opt., 31
(30), 6535
–6546
(1992). http://dx.doi.org/10.1364/AO.31.006535 APOPAI 0003-6935 Google Scholar
D. ContiniF. MartelliG. Zaccanti,
“Photon migration through a turbid slab described by a model based on diffusion approximation. I. theory,”
Appl. Opt., 36
(19), 4587
–4599
(1997). http://dx.doi.org/10.1364/AO.36.004587 APOPAI 0003-6935 Google Scholar
L. T. Perelmanet al.,
“Photon migration of near-diffusive photons in turbid media: a Lagrangian-based approach,”
J. Opt. Soc. Am. A Opt. Image Sci. Vis., 14
(1), 224
–229
(1997). http://dx.doi.org/10.1364/JOSAA.14.000224 JOAOD6 0740-3232 Google Scholar
F. JaillonH. Saint-Jalmes,
“Scattering coefficient determination in turbid media with backscattered polarized light,”
J. Biomed. Opt., 10
(3), 034016
(2005). http://dx.doi.org/10.1117/1.1924715 JBOPFO 1083-3668 Google Scholar
D. MagdeE. L. ElsonW. W. Webb,
“Fluorescence correlation spectroscopy. II. an experimental realization,”
Biopolymers, 13
(1), 29
–61
(1974). http://dx.doi.org/10.1002/(ISSN)1097-0282 BIPMAA 0006-3525 Google Scholar
L. Niemanet al.,
“Optical sectioning using a fiber probe with an angled illumination-collection geometry: evaluation in engineered tissue phantoms,”
Appl. Opt., 43
(6), 1308
–1319
(2004). http://dx.doi.org/10.1364/AO.43.001308 APOPAI 0003-6935 Google Scholar
O. Siimanet al.,
“Immunophenotyping using gold or silver nanoparticle-polystyrene bead conjugates with multiple light scatter,”
Cytometry, 41
(4), 298
–307
(2000). http://dx.doi.org/10.1002/(ISSN)1097-0320 CYTODQ 0196-4763 Google Scholar
J. X. ChengE. O. PotmaS. X. Xie,
“Coherent anti-Stokes Raman scattering correlation spectroscopy: probing dynamical processes with chemical selectivity,”
J. Phys. Chem., 106
(37), 8561
–8568
(2002). http://dx.doi.org/10.1021/jp025774b JPCHAX 0022-3654 Google Scholar
D. VenturoliB. Rippe,
“Ficoll and dextran vs. Globular proteins as probes for testing glomerular permselectivity: effects of molecular size, shape, charge, and deformability,”
Am. J. Physiol. Renal Physiol., 288
(4), F605
–F613
(2005). http://dx.doi.org/10.1152/ajprenal.00171.2004 1931-857X Google Scholar
Y. H. Fooet al.,
“Factors affecting the quantification of biomolecular interactions by fluorescence cross-correlation spectroscopy,”
Biophys. J., 102
(5), 1174
–1183
(2012). http://dx.doi.org/10.1016/j.bpj.2012.01.040 BIOJAU 0006-3495 Google Scholar
A. NagyJ. WuK. M. Berland,
“Observation volumes and {gamma}-factors in two-photon fluorescence fluctuation spectroscopy,”
Biophys. J., 89
(3), 2077
–2090
(2005). http://dx.doi.org/10.1529/biophysj.104.052779 BIOJAU 0006-3495 Google Scholar
Y. Yanget al.,
“Quantitative analysis of estimated scattering coefficient and phase retardation for ovarian tissue characterization,”
Biomed. Opt. Express, 3
(7), 1548
–1556
(2012). http://dx.doi.org/10.1364/BOE.3.001548 2156-7085 Google Scholar
V. Tuchin, Tissue Optics: Light Scattering Methods and Instruments for Medical Diagnosis, 882 2nd edn.SPIE Press, Bellingham, WA
(2007). Google Scholar
M. D. Waterworthet al.,
“Optical transmission properties of homogenised milk used as a phantom material in visible wavelength imaging,”
Australas Phys. Eng. Sci. Med., 18
(1), 39
–44
(1995). AUPMDI 0158-9938 Google Scholar
|
|||||||||||||||||||||||||||||


