|
|
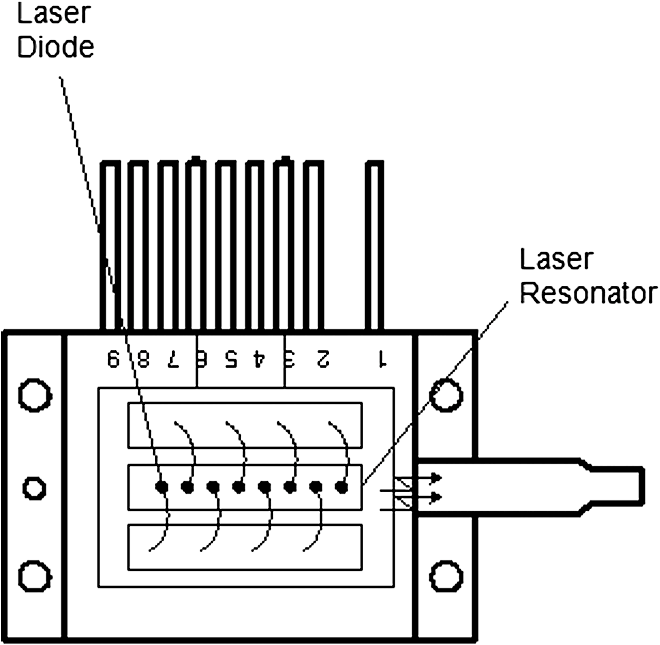
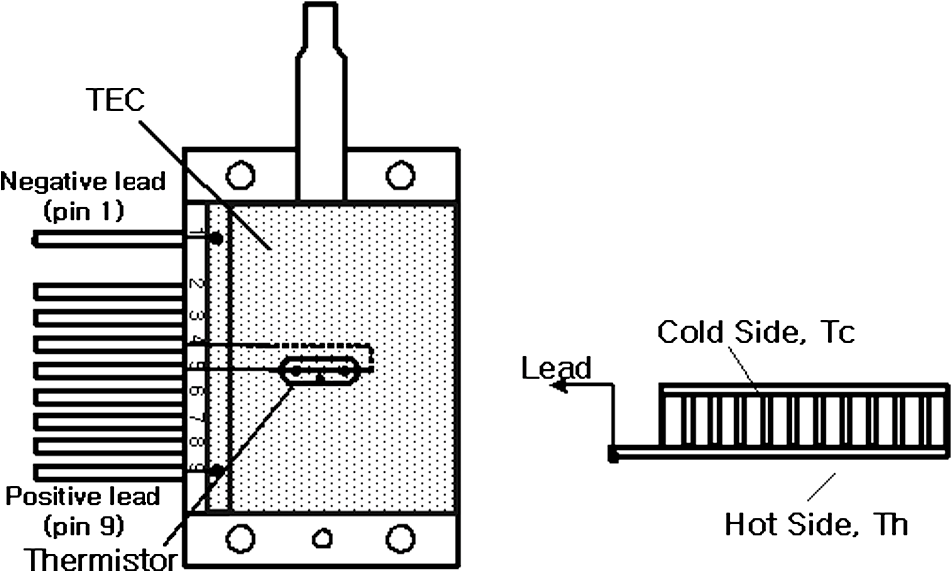
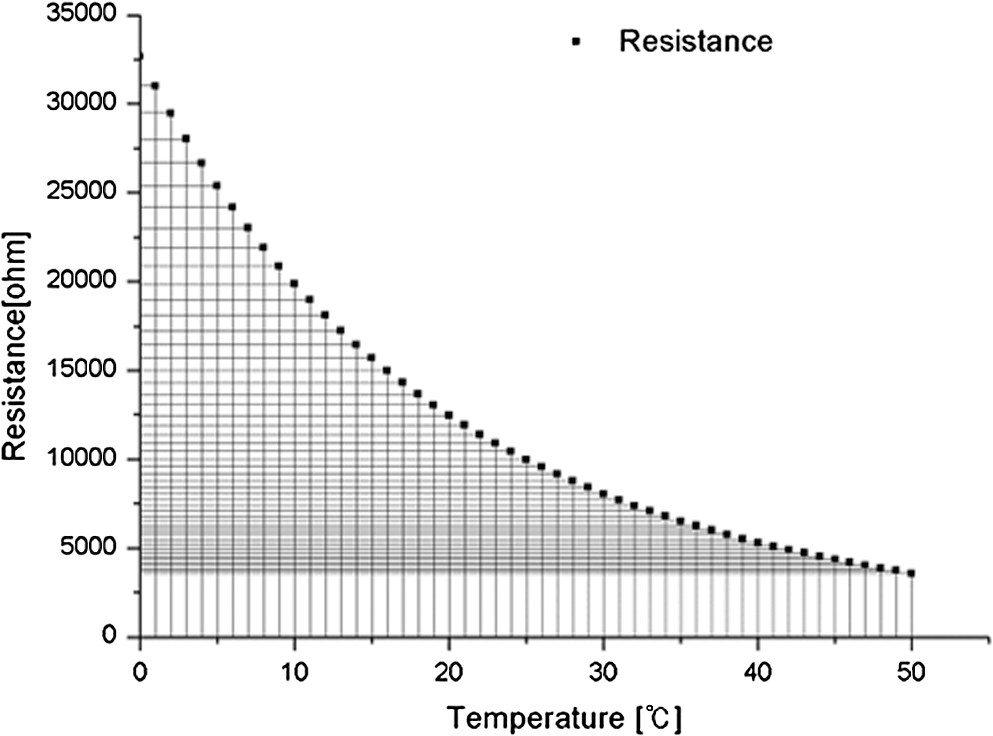
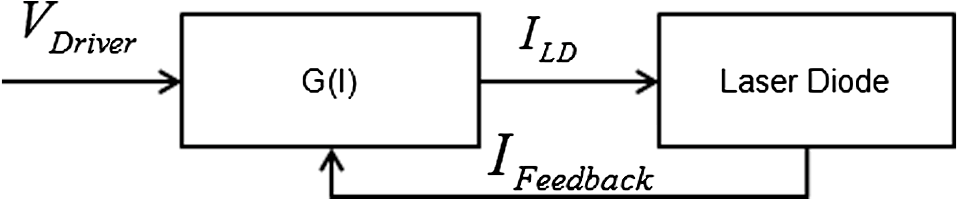
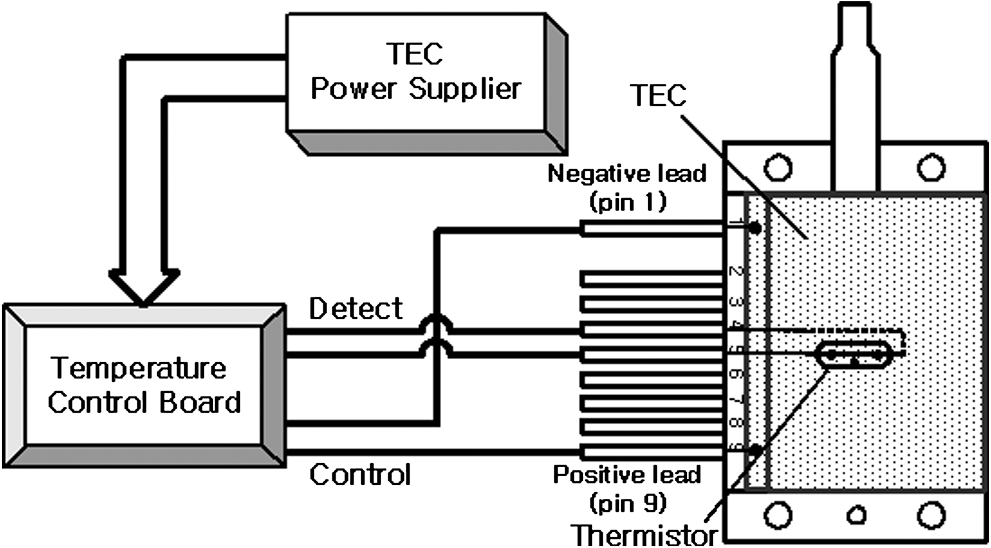
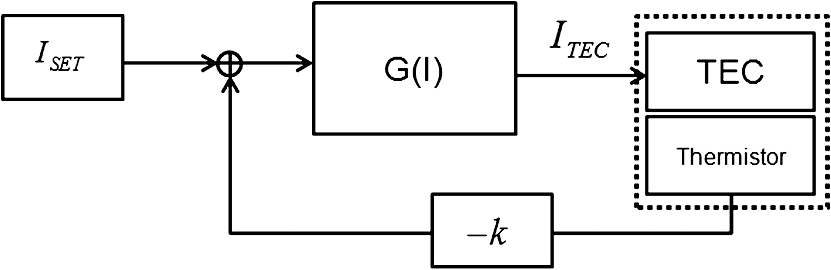
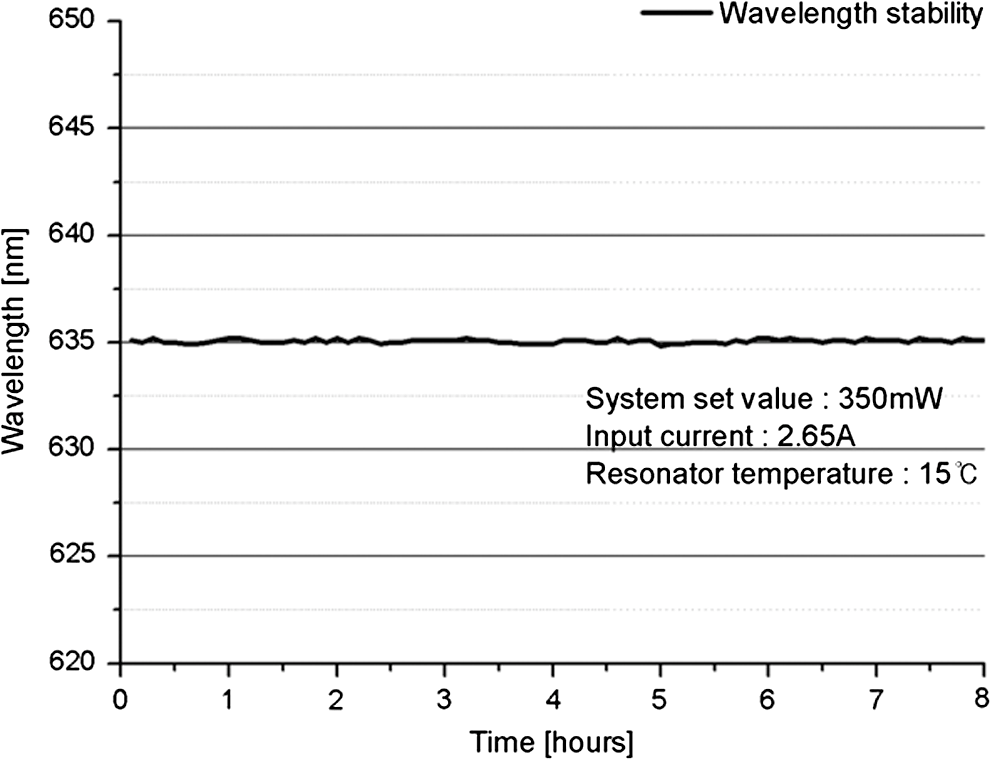
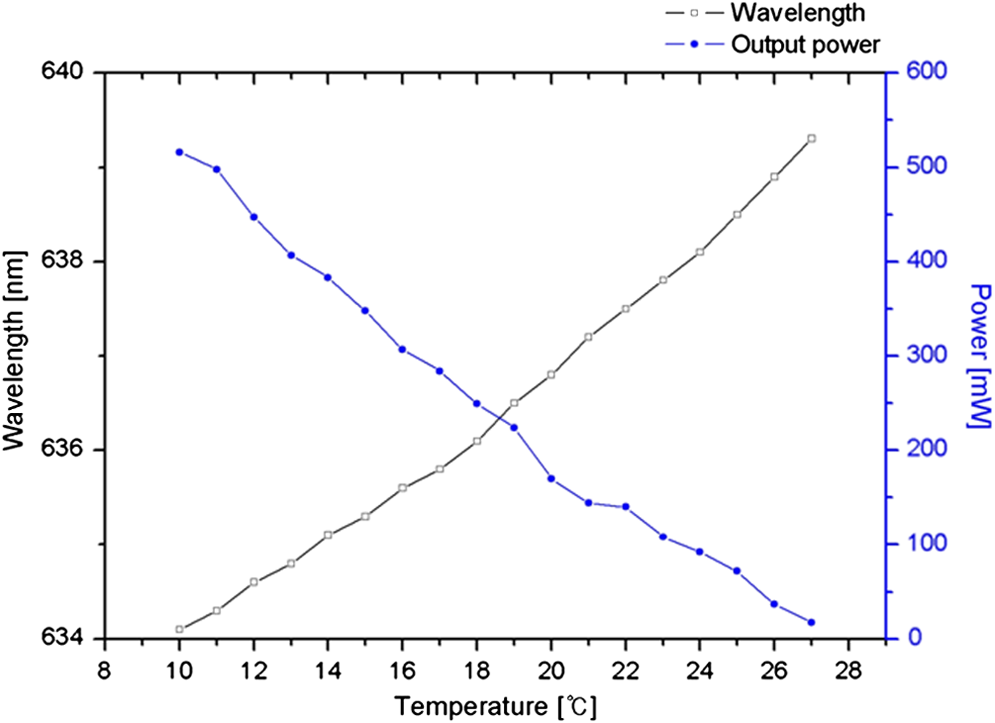
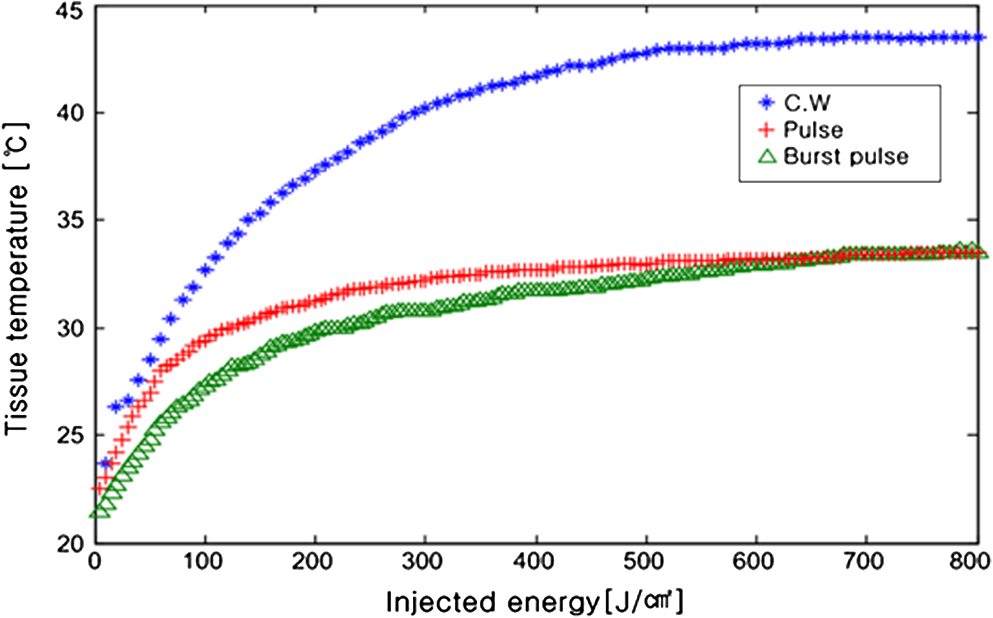
1.IntroductionPhotodynamic therapy (PDT), which induces a photochemical reaction in tissues, has recently been used as a treatment method for cancer. This method does not have the side effects such as decreased immunity, hair loss, pain, or mutations that can accompany conventional cancer treatments such as chemotherapy, surgery, or radiotherapy.1–7 In addition, PDT has the advantage of being selective for cancer tissues, while organs and normal tissues are preserved in their original state.8–12 The density of photosensitizers (PS) in a tumor, the excited photometric quantities injected into the tissue, and the amount of molecular oxygen in the organic tissue are factors that affect the results of photodynamic cancer treatment.12–15 These three parameters must be optimally regulated in their application to cancer treatment. Based on the density of the agent, the optimal injection dose can be determined through clinical experiments. In addition, the laser light source for cancer treatment is an important element. The laser system for PDT has optimal performance when the following characteristics are satisfied. First, the optical wavelength should be set at the maximum absorption point of the PS. Second, the wavelength of the laser should be held constant, regardless of the temperature and duration of the treatment. Third, the optical permeability of the organic tissue should be deep. Fourth, the output of the laser should be precise. Fifth, irreversible thermal damage to the tissues surrounding the tumor should not occur due to the optical radiation of the laser. Finally, the PDT laser system should prevent oxygen deficiency caused by photodynamic reactions.16 In this study, an optimal laser system was developed for cancer treatment and the performance of this system was evaluated. By measuring the system circuits, variability, and stability of the optical wavelength with changes in duration and laser resonator temperature, the precision of the optical output, control performance of the optical radiation mode, and temperature characteristics were obtained for organic tissue. 2.System Design2.1.Laser Resonator ConfigurationThe laser system was designed to produce an effective and stable optical wavelength of 635 nm at 1.5 W using a temperature controller. Precise and stable laser output was achieved using digital-to-analog (D/A) and current-to-voltage (I-V) converters, which produced 150-level laser output resolution. The laser system was configured using a microprocessor controller that integrated and controlled the optical radiation mode control circuits.2,3 The IEC 60601-2-22 standard was applied to the control user interface designed as an LCD touch screen, which was used to carry out safety management. A laser resonator with 1.5-W optical output with maximum source biases of 4 A and 2.46 V and a semiconductor laser diode with a output wavelength were installed (Fig. 1). Radiation duration ranged from 1 ms to 6000 s. In addition, a thermoelectric cooler (TEC) and thermistor were installed to cool the resonator and sense the temperature on the inside of the resonator next to the semiconductor laser chip, which radiates through the laser. The bias current had a threshold of a 2.2-A region for the forward bias. Figure 2 presents the transfer function of the laser resonator from the 2.4-A to the 4-A region, demonstrating effective output. Equation (1) gives the transfer function of the laser resonator: The laser output and wavelength of the diode laser resonator can be affected by the operational temperature. To produce a 635-nm optical wavelength, the inside temperature of the resonator should be maintained at 15°C. The TEC installed inside the laser resonator was a semiconductor element making use of the Seebeck–Peltier effect that can control a maximum 27.5 W of thermal load at maximum values of 5.3 A and 8.1 V (Fig. 3).The thermistor was used to observe the temperature of the laser module and operate the cooling device. The response voltage varied with the bias voltage of the thermistor and had a 10-kΩ resistance at 25°C. Figure 4 presents the temperature change versus thermistor resistance. The change in the resistance of the thermistor with temperature (K) follows the Steinhart–Hart equation for temperature (Fig. 4): where is the resistance (Ω) at temperature . A, B, and C are determined through a calibration process. The thermistor constants A, B, and C were , , and .This equation can be rearranged for temperature in °C as follows: The resistance of the thermistor was configured at 15,710 Ω by setting the current input to maintain a constant temperature of 15°C.Figure 5 illustrates the configuration of the PDT laser system. The system consists of the main control section, which integrates and controls the entire laser system, the laser generation and radiation control section, the user interface section, the safety device section, and the laser output section. 2.2.Signal Processing Control SectionThis section controls the entire function of the system and consists of the main controller, a D/A converter, and an I-V converter. The microcontroller unit (MCU) used in this study was the AT89C55, an element of the 8051 family. In addition, a universal asynchronous receiver/transmitter (UART) serial port was used to communicate with the touch screen, which acted as the user interface. The D/A converter transformed the 8-bit laser output data acquired from the MCU to current values. The transfer function for the maximum current output of the D/A converter is as follows: where is the input value for the D/A converter.The laser output can be precisely controlled by adjusting the D/A output using the variable resistor of the I-V converter (). The transfer function for the I-V converter is as follows: This system used values of the 256-resolution 8-bit device to produce output of up to 1.5 W with a 10-mW unit. An I-V converter was used to convert the output current values.Figure 6 presents the outputs of the D/A and I-V converters. The final output of the I-V converter was the value obtained when the resistance of was configured at 1.7 kΩ to produce a maximum operating current of 4 A. The control input values from the touch screen were converted to timer interrupt values through the CPU. In addition, the radiation mode was implemented according to the input control time (Fig. 7). A photo-coupler was used to directly cut the bias to perform on/off operations for the laser module and pulse. The photo-coupler prevents damage to the laser diode from noise by separating the laser driver, irradiation mode controller, and main control circuits from the power source. 2.3.Laser Driver ConfigurationFigure 8 presents the configuration of the driver that controls the operation of the laser. The laser driver supplements the current source to the laser diode. The laser driver consists of a modulation input section, a current monitor section applied to the laser, and a current output section. In the modulation input section, the laser output and radiation mode are transferred from the main controller. The current output section applies the current to the laser resonator. The transfer characteristics of the laser driver consist of the voltage at the driver (), the input current to applied to the laser diode (), and the current () from the laser diode to the I-V converter (Fig. 9): where the applied input voltage to the laser driver becomes the loaded current to the laser diode.2.4.Temperature Controller ConfigurationThe power supply of the temperature controller is independent from that of the main controller. In addition, the temperature controller was designed to supply a forward bias current to the TEC module when the temperature increases above the selected value upon receiving data on the interior temperature of the resonator from the thermistor (Fig. 10). The temperature can be observed using the bias voltage of the thermistor as an input element. When the temperature of the laser module is higher than the selected temperature, cooling is conducted by applying a forward bias; a reverse bias is applied in the opposite case. As noted above, the temperature of the resonator is controlled by applying a semiconductor cooling method that makes use of the Seebeck–Peltier effect. The transfer characteristics for this method consist of the input current () for the previously selected temperature, the current () for the adjusted temperature, and the feedback value () (Fig. 11). Based on the temperature change in the laser diode, the input current to the temperature controller TEC can be calculated as follows: During instantaneous optical output or heat generation, such as when laser output or pulse mode is initiated, the temperature of the laser module increases rapidly. In addition, there is a slow response time when approaching stable state at the set temperature depending on the heat load and .2.5.System Control Main ProgramFigure 12 presents the complete flow chart on the initial display screen of the system. A selection screen is displayed on the touch screen when power is applied. The modes that can be selected by the user include continuous-wave (CW) mode, pulse mode, and burst-pulse mode. 2.6.CW, Pulse, and Burst-Pulse Radiation Mode ProgramThe initial display screen once a mode is selected requires user specification of the laser radiation settings or return to the main menu to select an alternative mode. The CW, pulse, and burst-pulse radiation modes are shown in Fig. 13. Laser radiation begins after entering the required power and radiation time through the keypad. In addition, output can be controlled by viewing information on each page. The on/off time for the pulse radiation mode is controlled using the interrupter of an 89c55 timer. In pulse mode radiation, the output time is configured after entering the required pulse on/off time. The burst-pulse radiation mode stores the pulse on-time and off-time as well as the duration on-time and off-time as individual variables. These values are used as input for the timer interrupter and control the radiation output. The burst-pulse mode is based on a pulse mode, but outputs the laser as pulse flux radiation, such as radiation-start/radiation-stop. This mode was designed to prevent thermal damage due to excess accumulation of optical energy in the laser and to provide sufficient oxygen. After the input stage, laser radiation begins; the settings can be changed by the user and alternative irradiation modes can be selected during radiation. 3.Experimental Methods and Results3.1.Stability of the Optical WavelengthStability of the optical wavelength was verified by measuring changes in the peak wavelength at 25.4°C laboratory temperature and 36% humidity. The measurement was performed for 8 h using an MS257 spectroscope with the slit open to 4 μm and a grating of . The laser output was set to 350 mW. The optical wavelength was a peak wavelength of 635 nm at 15°C in the laser resonator and was demonstrated to have stable operation within (Fig. 14). These results verified that the temperature controller successfully controlled the inside temperature of the laser resonator. At an optical wavelength of 635 nm, the wavelength stability was (), demonstrating a very stable state under clinically useful conditions for cancer treatment (Fig. 15). The temperature of the laser resonator affects the optical wavelength. Figure 16 presents shifts in the wavelength of the laser with the temperature of the laser resonator. The test conditions were the same as those during the wavelength stability test, as were the settings of the MS257 spectroscope. These results confirmed the stability of the optical wavelength with the temperature controller of the laser resonator. In addition, the suitability of the system for photodynamic treatments was demonstrated. 3.2.Stability of the Optical OutputVariations in optical output were measured for 8 h at 15°C resonator temperature and a laser output of 350 mW. The test was performed at 25.2°C laboratory temperature and 34% humidity for 8 h. Power measurement was conducted using a power meter (NOVA PD-300) with a filtered sensor able to measure a maximum value of 3 W. The optical output was highly stable with variation (Fig. 17). The relationship between the voltage and current applied to the laser resonator and the output power is shown in Fig. 18. An output of 350 mW at 15°C resonator temperature was produced when the voltage and current were maintained at 2.42 V and 2.6 A, respectively. The observed optical output stability of 0.3% can be considered the output stability of the laser driver. The laser output began to exceed the threshold value around the 2.2-A region and showed a linear relationship up to the 4-A region, which produced a maximum value of 1.52 W. The intensity of the laser output varied with the inside temperature of the resonator, with lower temperatures producing higher intensity of laser output. Conversely, the laser output was lower at higher temperatures of the resonator. Figure 19 presents the optical output intensity with temperature regardless of optical wavelength. Power output measurements were performed by setting the output to 350 mW in the user menu of the laser system. Figure 20 shows changes in the optical wavelength of the laser and actual optical output intensities with temperature changes. The measurements were performed at a fixed laser output of 350 mW. These results demonstrated that the temperature controller, which maintains a constant resonator temperature, and the current control device for the laser driver are key factors in the performance of the laser, because the optical wavelength and output intensities varied with temperature changes in the diode laser system. The PDT laser system introduced in this study is considered stable, with proper control of temperatures and currents, with a wavelength stability of and optical output stability of . 3.3.Radiation Control PerformanceFigures 21 and 22 present the pulse responses for laser pulse switching. The measurements were performed using the burst radiation mode with a laser output of 350 mW. Figure 23(a)–23(c) presents the results of measurements in the CW radiation mode, the pulse radiation mode, and the burst-pulse radiation mode; all three modes were precisely controlled. In the pulse radiation mode, the control signals were configured as follows: the pulse on-time was 10 ms, pulse off-time was 10 ms, duration on-time of the pulse flux was 1 s, and duration off-time was 1 s. The control signals for the burst radiation mode were configured as follows: the pulse on-time was 50 ms, pulse off-time was 50 ms, duration on-time of the pulse flux was 1 s, and duration off-time was 1 s. Fig. 23(a) Continuous-wave (CW) signal measurement. (b) Pulse signal measurement. (c) Burst-pulse signal measurement. 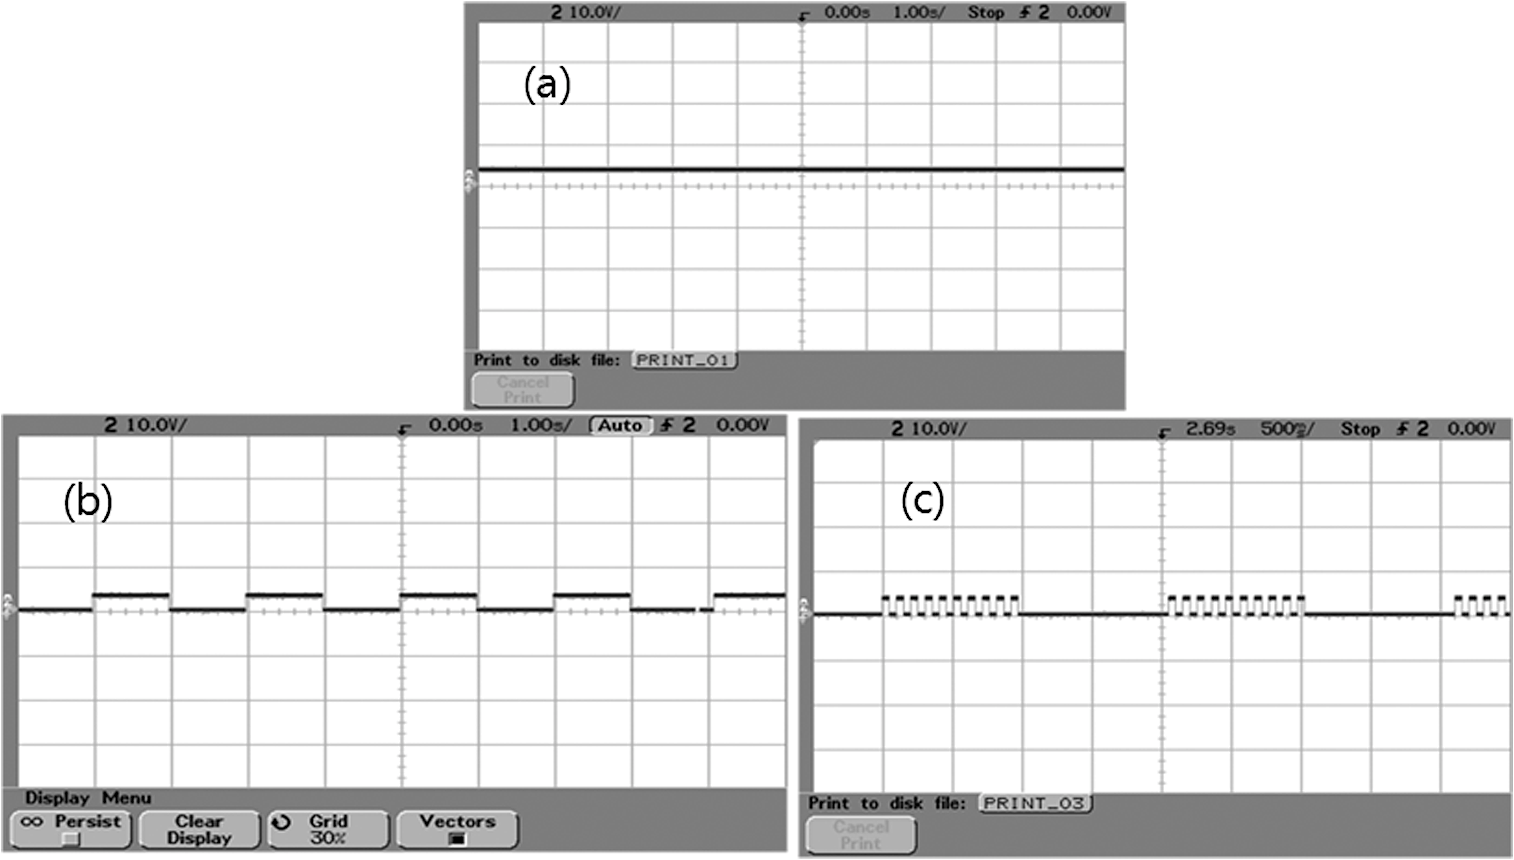 Based on these measurements, the radiation control performance was correct for each radiation mode. 3.4.Thermal Stability in In Vitro Pig Muscle TissueThermal safety was also evaluated for each of the three irradiation modes. A temperature sensor was inserted into pig muscle tissue at a depth of 5 mm, and temperature changes inside the tissue were measured by setting the laser beam to a power density of . The total injected energy density was for each radiation mode. Figures 24–26 present the thermal effects in each irradiation mode on the organic tissues and changes in the pig muscle tissues with injected optical energy and time. As shown in Fig. 24, CW radiation resulted in a rapid temperature increase in the initial stage of laser radiation, in which the temperature increased to 43.7°C, and a more gradual increase after 800 s. Moreover, there was irreversible thermal damage to the surface of the pig muscle tissue when optical injection was conducted at for 800 s. Optical injection in the pulse mode was conducted at for 1,600 s and a repetition rate of 50%. The results indicated a constant temperature of 33.5°C with no irreversible tissue damage (Fig. 25). The burst-pulse radiation mode resulted in a gradual increase in temperature during the initial stage of radiation to a constant temperature of 33.4°C to 33.5°C, with no irreversible damage to the tissue (Fig. 26). Figure 27 compares the tissue temperatures for the three radiation modes. Based on these results, the CW radiation mode presents the possibility of perforation or stricture, due to the greater thermal impacts of the PDT treatment. On the other hand, the pulse mode and burst-pulse mode exhibited very stable operational characteristics in pig muscle tissues. Table 1 presents the observed thermal effects on the pig muscle tissues. The temperature increase per was highest (0.27°C) in the CW mode, in which thermal energy continuously accumulates. The pulse radiation mode had a 0.27°C increase per , whereas the burst-pulse mode had the greatest thermal stability at 0.08°C increase per . Table 1Tissue temperature stability in the three radiation modes.
In the burst-pulse radiation mode, thermal effects were minimized with short pulse radiation of around 30 ms. Based on these results, the burst-pulse mode using a short pulse width may best protect the tissue from thermal and other irreversible damage. 4.Discussion and ConclusionsThis article reports design and testing of a PDT laser system using a laser diode with an optimized system that precisely controls optical wavelength, optical power, and optical irradiation modes for cancer treatment. The optical wavelength was stable at at the peak wavelength of 635 nm. In addition, the performance of the temperature controller, which affects the optical wavelength, was also demonstrated to be stable under the controlled system. In addition, clinical optimization of each irradiation mode was evaluated by measuring thermal properties in pig muscle tissue as an in vitro organic tissue. These results demonstrated the suitability of the system for cancer treatment. Stability of the optical output was verified within 0.3% for a maximum output of 1.52 W. The radiation control system achieved a rapid on-and-off response time of 500 μs for each pulse. In addition, precise control of the configured radiation mode, pulse phasing, and input time was accomplished. Using the CW mode, the temperature in the pig muscle tissue with total injected energy of was 43.7°C, which resulted in irreversible damage. However, the tissue temperatures were 33.5°C and 33.4°C to 33.5°C for the pulse and burst-pulse irradiation modes, providing safe treatment without tissue damage. The burst-pulse mode with a short wavelength exhibited a particularly low rate of temperature increase during the initial stage of laser radiation compared to the CW and pulse modes. The average temperature increases in pig muscle tissue per were 0.27°C for CW, 0.09°C for the pulse, and 0.08°C for the burst-pulse modes, or . When tissue is irradiated by laser light, heat is generated inside of the tissue due to absorption of the laser irradiation energy by the tissue during laser exposure. In accordance with the thermodynamics law, the temperature of the tissue will increase due to accumulation of heat in the tissue, and the temperature increase is given by: where () is the absorbed energy per unit volume, () is the density, and [] is the specific heat.17,18 As the absorbed energy induces a linear change in temperature , the sequence can be written. Therefore, the different laser irradiation modes result in different absorbed energy per unit volume of tissue.The present semiconductor diode PDT laser system, optimized by reducing variations in laser output and specific wavelength shifts, using pulsed and burst-pulsed laser irradiation modes, and operated with a TEC and thermistor, was developed to reduce thermal damage that may occur in the tissue during treatment. The results of in vitro measurements of tissue specimens indicate that the temperature increase depends on the irradiation mode of the laser system; the temperature increases for the pulsed and burst-pulsed laser irradiation modes are substantially lower than for CW laser irradiation. Consequently, this optimized PDT laser system may be used to reduce potential thermal damage during PDT in clinics through new pulse irradiation modes and controlled laser output. ReferencesB. C. Wilson,
“The physics of photodynamic therapy,”
Phys. Med. Biol., 31
(4), 327
–360
(1986). http://dx.doi.org/10.1088/0031-9155/31/4/001 PHMBA7 0031-9155 Google Scholar
H. S. Lim,
“Development and optimization of a diode laser for photodynamic therapy,”
Int. J. Laser Ther., 20
(3), 195
–203
(2011). Google Scholar
H. S. Lim,
“Design and evaluation of excitation light source device for fluorescence endoscope,”
Proc. SPIE, 7380 73805A
(2009). http://dx.doi.org/10.1117/12.822808 Google Scholar
T. Hasan, Fundamentals of Photochemistry and Photodynamic Therapy,
(1994–2000). Google Scholar
J. V. MooreC. M. WestC. Whitehurst,
“The biology of photodynamic therapy,”
Phys. Med. Biol., 42
(5), 913
–935
(1997). http://dx.doi.org/10.1088/0031-9155/42/5/012 PHMBA7 0031-9155 Google Scholar
A. A. StratonnikovN. V. ErmishovaV. B. Loschenov,
“Influence of red laser irradiation on hemoglobin oxygen saturation and blood volume in human skin in vivo,”
Proc. SPIE, 4257 57
–64
(2001). http://dx.doi.org/10.1117/12.434687 PSISDG 0277-786X Google Scholar
R. W. Waynant, Lasers in Medicine, CRC Press, Washington, DC
(2002). Google Scholar
T. SchunckP. Poulet,
“Oxygen consumption through metabolism and photodynamic reactions in cells cultured on microbeads,”
Phys. Med. Biol., 45
(1), 103
–119
(2000). http://dx.doi.org/10.1088/0031-9155/45/1/308 PHMBA7 0031-9155 Google Scholar
I. DriverC. P. LowdellD. V. Ash,
“In vivo measurement of the optical interaction coefficient of human tumors at 630 nm,”
Phys. Med. Biol., 36
(6), 805
–813
(1991). http://dx.doi.org/10.1088/0031-9155/36/6/008 PHMBA7 0031-9155 Google Scholar
A Clinical Manual: Photodynamic Therapy of Malignancies, CRC Press, Boca Raton, FL
(1992). Google Scholar
Photodynamic Tumor Therapy: 2nd and 3rd Generation Photosensitizers, Harwood Academic Publishers, New Delhi, India
(1998). Google Scholar
S. Guptaet al.,
“Cellular uptake, localization and photodynamic effects of haematoporphyrin derivative in human glioma and squamous carcinoma cell lines,”
J. Photochem. Photobiol. B, 69
(2), 107
–120
(2003). http://dx.doi.org/10.1016/S1011-1344(02)00408-6 JPPBEG 1011-1344 Google Scholar
A. L. McKenzie,
“Can diffusion be assumed in correcting for oblique incidence in laser photodynamic therapy?,”
Phys. Med. Biol., 31
(3), 285
–290
(1986). http://dx.doi.org/10.1088/0031-9155/31/3/008 PHMBA7 0031-9155 Google Scholar
S. L. Marcus,
“Photodynamic therapy of human cancer,”
Proc. IEEE, 80
(6), 869
–889
(1992). http://dx.doi.org/10.1109/5.149450 IEEPAD 0018-9219 Google Scholar
S. D. Song, Medical Applications of Lasers, Da Sung Press, Seoul, Korea
(2001). Google Scholar
A. A. StratonnikovA. Yu. DouplikV. B. Loschenov,
“Oxygen consumption and photobleaching in whole blood incubated with photosensitizer induced by laser irradiation,”
Laser Phys., 13
(1), 1
–21
(2003). Google Scholar
M. H. Niemz, Laser-Tissue Interactions, Springer-Verlag, Berlin Heidelberg
(2007). Google Scholar
R. Steiner, Laser and IPL Technology in Dermatology and Aesthetic Medicine, Springer-Verlag, Berlin Heidelberg
(2011). Google Scholar
|