
|
|
1.Introduction1.1.Red Blood Cell Aggregation and OxygenationRed blood cells (RBCs) tend to align face-to-face against one another and form structures commonly referred to as rouleaux. This phenomenon is known RBC aggregation. Proteins found in the plasma of whole blood (with fibrinogen being the main one) are reported to significantly impact RBC aggregation.1 In addition, aggregation can be induced in RBC suspensions of high molecular mass, water soluble polymers such as dextran and polyethylene glycol but not in simple salt solutions suspensions such as phosphate-buffered saline.2 The concentration and molecular mass of dextran have been reported to heavily influence the occurrence/inhibition of aggregation. The mechanism responsible for the formation of aggregates has not been elucidated. The bridging and depletion models are current hypotheses to explain RBC aggregation but conclusive evidence is still lacking.3,4 Regardless of the exact mechanism, there is general agreement on the correlation between RBC aggregation and elevated levels of fibrinogen and other macromolecules. Enhancements of RBC aggregation have been reported in numerous clinical conditions such as myocardial infarction, bacterial infection, type 2 diabetes, and sickle cell disease.2 There are multiple lines of evidence that suggest that RBC aggregation plays a role in modifying microcirculation blood flow5 and tissue oxygenation.6 Significant increases in blood viscosity have been reported in the presence of aggregation at low shear rates (during periods of very slow flow) developed in the myocardial circulation of patients with acute coronary syndromes.7 Moreover, the release of oxygen from RBCs is inhibited by the presence of aggregation and thickening of the plasma layer around the vessels contributing to increased viscosity.8 RBC aggregation plays a significant role in the oxygen diffusion process and the flow behavior of the RBCs which are of paramount importance in the transfer of oxygen from cells to tissues. 1.2.Assessing RBC Aggregation and OxygenationInformation about the aggregation time course and the strength of the forces holding the aggregates together are important for making clinical decisions. Currently, there is no widely accepted method for measuring RBC aggregation in situ. The difficulty primarily lies in not being able to define the “normal” range of RBC aggregation since that is determined by the nature of the measured aggregation parameters provided by the various approaches and instruments ex-vivo.9 For instance, one technique relies on measuring the rate at which the RBCs sediment from the plasma of whole blood. It is time consuming, does not provide information on the kinetics of the aggregation process and carries a strong hematocrit dependence which makes it difficult to differentiate aggregation from other hematocrit dependent disorders such as anaemia.10 Optical aggregometry techniques monitor time kinetics and the degree of aggregation by measuring the intensity of backscattered or transmitted light through a sample of blood as a function of time. Despite significant advancements, the technical requirements of each apparatus (especially with regards to the preparation of blood) render the results laboratory dependent.11 More importantly, there is no direct evidence to suggest that the indexes of aggregation provided by such measurements directly relate to in vivo conditions. Ultrasound (US) imaging has been used for assessing aggregation, primarily due to its noninvasiveness and wide availability. The presence of RBC aggregation alters the spatial organization of the scatterers which in turn produces detectable changes in US backscatter.12 A limiting factor of US imaging is the complex relationship between the US backscatter and the hematocrit; the backscatter reaches a peak at a certain hematocrit level depending on the interrogation frequency and decreases thereafter. The hematocrit at which this peak occurs depends on the US interrogation frequency. This phenomenon is due to the constructive or destructive interference of the scattered US waves which in turn depends on the spatial organization of the RBCs and their relationship to US interrogation frequency.13 Such a complex relationship makes it difficult to properly assess the aggregation of RBCs using US. None of the techniques described so far are capable of providing information about the state of oxygenation of RBCs which is influenced by the presence of aggregation. Monitoring blood oxygenation is important for managing a number of clinical situations where oxygenation levels fluctuate (i.e., during surgical interventions). Moreover, there have been reports that monitoring oxygenation can provide useful clinical information for evaluating the effects of chemotherapy and radiotherapy on tumors14 and monitoring healing of wounds.15 Currently, pulse oximetry remains the most widely used clinical technique but it is limited by poor spatial resolution and the inability to monitor vessels situated deep into the body due to increased light scattering.16 There is no imaging modality currently capable of detecting and characterizing the presence of RBC aggregation as well as assessing the oxygenation state of blood. 1.3.Photoacoustic Imaging and the Potential of Ultrasound Spectroscopy AnalysisWe propose using photoacoustic (PA) imaging for measuring changes that occur during RBC aggregation while simultaneously monitoring the oxygenation level of the RBCs. The underlying principle behind PA imaging is the generation of pressure transients from the thermo-elastic expansion of the medium resulting from the absorption of the incident optical irradiation.17 By detecting optically induced ultrasonic waves better resolution and depths greater than are easily achieved due to the weaker scattering of US waves.18 In addition, PA imaging also overcomes the poor soft tissue contrast associated with US imaging by probing the inherent optical absorption in tissue using lasers at wavelengths chosen to selectively target specific chromophores.19 One such chromophore is hemoglobin (Hb), the abundant protein complex located inside RBCs. Hb is responsible for oxygen transport in the circulation and its optical absorption is dependent on its binding to oxygen.20 PA imaging can image the concentration of Hb and compute the oxygen saturation by using multiple wavelengths. PA fluctuation flow cytometry has successfully shown that by monitoring the large increases in the PA signals, one can obtain insight into the pathological conditions leading to RBC aggregation such as the of circulating clots.21–23 In addition, PA imaging has been successful in monitoring blood oxygenation. The feasibility of PA for obtaining in vivo structural and functional information of the brain of rats as well as measuring the Hb concentration24 and oxygenation levels in the internal jugular vein of sheep25 and humans26 has been successfully demonstrated. Our group has developed theoretical models to investigate the effect of RBC aggregation27 and oxygenation28 on the PA signals as independent processes. In addition, experimental evidence of the detection of human and porcine aggregation with PAs was reported in a recent communication.29 PA and US images are reconstructed by displaying the amplitude of the radio frequency (RF) signals detected by ultrasonic transducers as brightness pixels. This approach renders the images (and data analysis) system dependent since the characteristics of the signals depend on the US transducers used and the amplification and filtering of these US signals; moreover, for the same US system, they depend on the instrumentation settings. In US imaging this is overcome by performing analysis of the backscattered RF signals from a region of interest (ROI) by taking into account how the instrumentation affects the RF signal in this ROI. The system dependence is taken into account by computing the power spectrum of the transducer pulse-echo response (typically obtained from a plane reflector) and subtracting it from the power spectrum of the ROI RF signals.30 The resulting spectrum (referred to as the normalized power spectrum) is often quasi-linear over the usable transducer bandwidth (typically to of the center frequency of the transducer). The linear regression of the normalized spectrum provides parameters such as the spectral slope (SS), intercept and midband fit (MBF, defined as the value of the linear fit evaluated at the midpoint of the analyzed transducer bandwidth). This type of analysis is known as ultrasound tissue characterization, a form of quantitative ultrasound (QUS) imaging. It has been shown theoretically and confirmed experimentally that the spectral parameters extracted from normalized power spectra can be related to structural tissue properties such as acoustic scatterer size and concentration.31 In addition to being used for ultrasound tissue characterization, such analysis has also been applied by our group for monitoring the morphological changes that occur during chemotherapy treatments of various tumor models.32 It is well known that the size of the optical absorbers in PA dictates the content of the power spectra in the frequency-domain.33 We postulate that the spectral analysis of PA RF signals (termed PA ultrasound spectroscopy or PAUS) will provide information about the structure of the optical absorber. In the case of RBC aggregation, by normalizing the power spectra obtained from nonaggregated and aggregated RBCs as in ultrasound tissue characterization techniques, the changes that occur during the aggregation process can be monitored and quantified. In addition, one can infer the oxygenation state of the nonaggregated and aggregated RBC samples by illuminating samples at multiple wavelengths where the optical absorption of oxygenated and deoxygenated hemoglobin (OHb and DHb, respectively) differs. 2.Theoretical ModelThe theoretical model is derived from the analytical solutions of the wave equation for simple geometries illuminated uniformly by a delta function laser pulse.33 In this case, the RBC is approximated as a spherical absorber and the PA pressure wave emitted from a single sphere and detected at a distance in the surrounding medium can be written as27,28 Equation (1) is written in terms of a dimensionless frequency which is defined as . Here, is the radius of the spherical absorber, is the angular frequency of the pressure wave, and is the speed of sound. The subscript and denote the sphere and surrounding fluid medium properties, respectively. The dimensionless quantities and represent the ratios of the sphere’s density and the speed of sound to the surrounding medium’s density and speed of sound, respectively. Similarly, is the optical absorption coefficient of the illuminated sphere, is the isobaric thermal expansion coefficient, is the heat capacity per unit mass, is the optical radiation intensity which varies sinusoidally in time, and is the wave number of the surrounding fluid medium. In the case of more than one absorber, the pressure field from collections of absorbers can be written as the superposition of the waves emitted from each absorber. This approach has been extensively used in modeling the interaction of ultrasonic waves with RBC aggregates.34,35 For modeling the PA pressure waves from collections of RBCs it is assumed that all the absorbers within a given ROI are optically illuminated simultaneously irrespective of their spatial position. In calculating the pressure field of such collections of RBCs, multiple scattering of the acoustic waves generated is not taken into account, nor is acoustic attenuation. With these assumptions, the PA pressure generated from a collection of RBCs can be written as the linear superposition of the spherical waves emitted by the individual absorbers27,28 The superposition of the spherical waves is accounted by the summation term of Eq. (2). Here, represents the position vector of the ’th absorber in a ROI which contains absorbers. If the observation distance is large compared to the size of the ROI, Eq. (2) can be written as27,28 In practice, PA signals are detected by an ultrasonic transducer that has a finite bandwidth which inherently filters out many of the frequency components of the PA signal. Equation (3) does not take into account this finite transducer bandwidth (i.e., the pressure signal calculated is non band-limited). The finite transducer bandwidth can be taken into account by incorporating the transducer frequency profile into Eq. (2) as a Gaussian function.36 Equation (3) then becomes the expression for the band-limited (BL) PA pressure field for a collection of RBCs by multiplying its pressure by the Gaussian function representing the transducer frequency profile29,37 Here, is the pressure field computed by Eq. (3), is the center frequency of the transducer, and the width of the Gaussian function is related to the receiving bandwidth of the transducer (chosen to be 60%) by . The time domain PA pressure can be derived by taking the inverse Fourier transform of Eqs. (3) and (4). 3.Materials and Methods3.1.Simulation MethodsThe detailed description of the simulation methods employed to generate the PA signals from nonaggregated and aggregated RBC samples is described in detail in recent reports by our group.27,28 For the sake of completeness, the framework of the simulation methods will be discussed here in brief followed by a more detailed account of the modifications of the model for the purposes of this study. In this study, two-dimensional (2-D) simulations were performed to investigate the dependence of the PA signals and their respective power spectra on RBC aggregation and oxygenation level. The size of the ROI was chosen to be . This can be thought of as a 2-D cross-section of a three-dimensional (3-D) sample containing RBCs. The contributions of the white blood cells and platelets were ignored due to their much smaller concentration and negligible optical absorption compared to RBCs.24 The spatial locations of the nonaggregated RBCs were generated using a Monte Carlo-based technique known as random sequential adsorption.38 The spatial coordinates of the RBCs were randomly proposed within the 2-D ROI and were accepted only if they did not overlap with existing cells under periodic boundary conditions. This procedure was repeated until all the RBCs at a given hematocrit (defined as the ratio of the area of occupied by the cells to the total area of the ROI) had a fixed position. For generating aggregated RBC samples, a regular packing scheme was used to arrange individual RBCs into aggregates. Specifically, a hexagonal close packing scheme was used to form aggregates by positioning the individual RBCs in a hexagonal packing arrangement. The aggregate was then randomly and repeatedly placed within the ROI. For each cluster, the radius of gyration () was computed as a means for quantifying the mean aggregate size. It was calculated by using the square of the distances of the cells from the center of the cluster. Once the spatial positioning of the nonaggregated and aggregated RBCs was completed, the inverse Fourier transform of Eqs. (3) and (4) was computed to obtain the non band-limited and BL PA signals. The RBCs simulated in the study were porcine RBCs. They were approximated as fluid spheres with a volume of and radius .39 The density of the cell and the surrounding fluid (water) were taken as and , respectively. The speed of sound inside the cell was and in the medium. The thermal parameters and the intensity of the incident optical irradiation were all chosen to have a value of 1 since they only control the amplitude of the signals and not the spectral features. The PA signal amplitude (SA) is heavily dependent on the optical absorption of the RBC samples (nonaggregated and aggregated). The optical absorption depends on the concentration of Hb protein inside the RBC and most importantly on the protein’s oxygenation state. Since approximately 189 million Hb molecules reside within a single porcine RBC, the concentration of Hb inside a single cell was calculated to be .40 Hb can bind up to 4 molecules of oxygen and its optical absorption coefficient can be estimated by employing the following relationship: , where is the extinction coefficient for each Hb molecule (which depends on its oxygenation level).20 For this study, the simulated blood samples (nonaggregated and aggregated) were assumed to be either entirely oxygenated or entirely deoxygenated. By taking into account the extinction coefficients at 750 and 1064 nm for both OHb and DHb, the optical absorption coefficients were calculated and utilized in computing the pressure field given by Eq. (3). Table 1 presents the estimated absorption coefficients used in this simulation study.20 Table 1Absorption coefficients for oxygenated and deoxygenated RBCs.
The effect of hematocrit and aggregation level was examined in addition to the oxygenation state of the samples at both wavelengths. For each hematocrit level, three different levels of aggregation were simulated. The smallest (1.96 μm) value corresponds to the nonaggregated case. Since the simulations were based on a Monte Carlo method, placing the exact same number of RBCs within a given aggregate becomes difficult so the values for each hematocrit level are not identical. Table 2 summarizes the aggregation levels (characterized by ) for each hematocrit level simulated in this study. Table 2Hematocrit and aggregation levels simulated in this study.
3.2.Blood Sample PreparationThe guidelines on handling the blood were followed in accordance to the recommendations of the International Society for Clinical Hemorheology and the European Society for Clinical Hemorheology and Microcirculation.41 Fresh porcine blood from the femoral vein of Yorkshire pigs (Comparative Research, Toronto, Ontario) was drawn into spray-coated potassium EDTA vacutaners (Becton, Dickinson and Company, Franklin Lakes, New Jersey). The blood was centrifuged (1500 g, 6 min at room temperature) to separate the plasma and the buffy coat. Isotonic photsphate buffered saline (PBS) was used to wash the RBCs two times. The packed RBCs were then suspended in PBS in order to achieve three hematocrit levels (10%, 20%, and 40%). For each hematocrit level, aggregation was induced by replacing PBS with a solution of Dextran-70 (Sigma-Aldrich, St. Louis, Missouri) dissolved in PBS. By changing the concentration of the Dextran-PBS [(Dex)] solution, varying degrees of aggregation were achieved. For this study, the [Dex] used were 1%, 3%, and 8% (wt/vol). The presence of aggregation was assessed using an Olympus CKX41 optical microscope (Olympus Canada Inc., Markham, ON). Representative images of nonaggregated and aggregated RBCs [at 3% (Dex)] are shown in Fig. 1. All blood samples were kept in contact with air prior to experimentation and all experiments were completed within 4 h of blood sampling. Prior to loading the samples inside the tube containers, the blood samples were thoroughly mixed in order to achieve homogeneity. 3.3.Experimental SetupThe Imagio Small Animal PA imaging device (Seno Medical Instruments, Inc., San Antonio, Texas) was used to measure all the PA signals analyzed in this study. The system consisted of a Q-switched, pulsed Nd:YAG laser delivered through an articulated arm (beam diameter 9 mm, pulse width 6 ns, pulse repetition rate 10 Hz, maximum fluence ). The acoustic receiver consisted of a focused (29.5 mm focal length), 4 channel, annular array transducer with a center frequency of 5 MHz, and a bandwidth of 60%, as measured by using a hydrophone. The transducer was mounted 60 mm coaxially to the laser allowing for raster scanning over the entire ROI. The blood samples were loaded into cylindrical tubes (Norton Performance Plastic, Akron, Ohio) with 0.5 mm inner diameter. A vertical raster scan was performed over the entire tube length (10 cm). At each location, the laser fired 4 pulses and the received PA RF signals were averaged to produce a single PA RF line. A total of 20 signals were recorded for each blood sample irradiated at 750 and 1064 nm. In order to obtain the transducer frequency response profile for the PA measurements, a 200-nm-thick gold film was used. The film was deposited onto a thin microscope cover slide with no annealing. The thin gold film was used because it has a broad PA power spectrum as well as a flat response in the known bandwidth of the receiving transducer thus providing a good measure of the transducer response in PA measurements. The laser was raster scanned over an area of at both 750 and 1064 nm wavelengths using the same power settings as the PA measurements of the blood samples. A total of 20 PA signals were recorded for each wavelength. 3.4.Data AnalysisThe signal analysis methodology described here was applied to both the theoretical and experimental signals. Each PA signal recorded was multiplied by a Hamming window in order to localize the signal either in the theoretical model (ROI ) or the sample holder (0.5 mm) and to minimize spectral leakage. For each signal (80 simulated signals and 20 experimental signals), the SA was computed by integrating the envelope of each signal (obtained by taking the Hilbert transform). The average and standard deviation of the SA was then computed along with the standard deviation. For each PA signal, the Fourier transform was computed using the Matlab Fast Fourier Transform algorithm (The MathWorks, Inc., Natick, Massachusetts) before converted to a logarithmic (dB) scale. The power spectra for each theoretical and experimental signal were then normalized to the frequency response of the transducer used. The theoretical spectra were subtracted from the Gaussian function (converted to dB scale) used to model the transducer frequency response [Eq. (4)] to emulate the steps used in the analysis of the experimental signals. The experimental spectra were subtracted from the gold film spectrum for the appropriate illumination wavelength. Linear regression was performed on the quasi-linear, normalized power spectra over the bandwidth of the transducer. The SS and MBF were computed from the linear fit of each normalized spectrum. Averages of each of these parameters along with the standard deviations were computed. The normality of the data was confirmed using a Shapiro-Wilk test with used as the criterion for normality. An unpaired -test was used to compare the PA SA and spectral parameters obtained from nonaggregated and aggregated RBCs. A -value of 0.05 or less was used to establish statistically significant differences. 3.5.Estimation of Oxygen SaturationThe oxygen saturation () for a sample of blood can be estimated by illuminating the sample with two optical wavelengths ( and ) and measuring the PA SA at each wavelength.24 Assuming that OHb and DHb are the dominant absorbers at the two wavelengths, the was calculated by Here, is the difference in the extinction coefficients for each wavelength of illumination ( and ). SA represents the average amplitude of the experimental PA signals. The was calculated for all measured PA signals and reported as percentage. 4.Results4.1.Simulated Power SpectraFigure 2 shows the simulated average power spectra obtained from the PA signals of 80 nonaggregated (top row) and aggregated (bottom row) RBC random configurations illuminated. The RBC samples were fully oxygenated and were illuminated at 750 nm. For the nonaggregated non band-limited case, the spectral power generally increases over all frequencies when the hematocrit was increased [Fig. 2(a)]. In the power spectra, the dominant peak of each spectrum was observed at . The spectral power increased by at 260 MHz for each doubling of the hematocrit level. When the finite transducer bandwidth was taken into account, most frequencies and spectral features present in the non band-limited spectra were filtered out as shown in Fig. 2(b). Using the frequency response of a 5 MHz center frequency transducer to filter the non band-limited spectra resulted in the BL power spectra which approximately resembled the transducer frequency profile. The spectral power at 5 MHz increased by 1.7 dB for each doubling of the hematocrit level. In order to normalize the power spectra, the BL spectra were divided by the Gaussian-shaped transducer frequency response [Fig. 2(c)]. The normalized spectra were linear around the 5 MHz, transducer sensitivity region and a linear regression line was fitted in order to obtain the SS and MBF. Fig. 2Simulated power spectra for oxygenated nonaggregated and aggregated RBC configurations illuminated at 750 nm. Top row: (a) non band-limited power spectra for nonaggregated RBCs at three hematocrit levels, (b) BL, and (c) normalized power spectra of (b). Bottom row: (d) non band-limited power spectra for aggregated RBCs at three aggregation levels and 40% hematocrit, (e) BL, and (f) the normalized power spectra of (e). The vertical black lines of (c) and (f) represent the usable receiver bandwidth over which linear regression was performed. 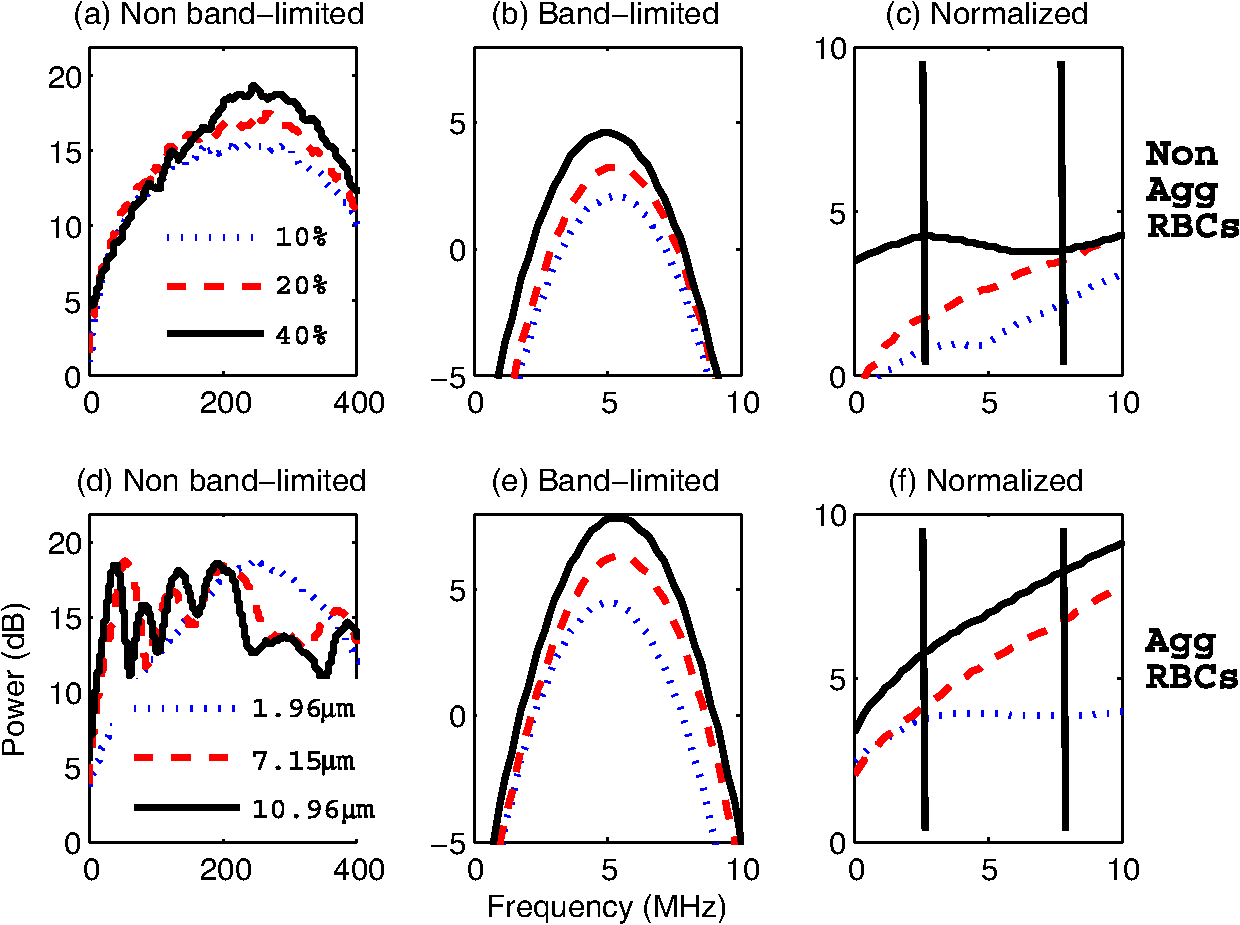 The aggregated, non band-limited power spectra are shown in Fig. 2(d) for samples at 40% hematocrit and for different aggregate sizes. As the size of the aggregates (measured by ) increased, the frequency at the peak of the spectrum decreased. Specifically, the frequency of the peak of the power spectrum for the NA case (1.96 μm) was 260 MHz, 45 MHz for the 7.15 μm, and 30 MHz for the 10.96 μm aggregates. The BL spectra for the aggregated samples are shown in Fig. 2(e). The spectral shifts present in the non band-limited case were no longer identifiable and the overall shape resembled the transducer frequency profile (similar to the nonaggregated case [Fig. 2(b)]. At 5 MHz, the spectral power increased by 1.8 and 3.3 dB for the 7.15 and 10.96 μm aggregates compared to the nonaggregated sample. The normalized spectra for the aggregated samples shown in Fig. 2(f) were fitted to a linear regression line and the spectral parameters were obtained. 4.2.Quantitative Parameters for Simulated SamplesA quantitative summary of the SA, SS, and MBF for the simulated exposures at 750 nm is shown in Fig. 3. All graphs are plotted as a function of hematocrit for each aggregate size ( of 2, 8, and 11 μm) and oxygenation state (oxy and deoxy). As shown in Fig. 3(a), the SA increases monotonically with increasing hematocrit for all aggregation and oxygenation levels. Specifically, the increase is for each doubling of hematocrit level. The SA for all deoxygenated samples is higher than oxygenated ones (). An increase of is observed for aggregated samples compared to nonaggregated ones for both oxygenation states and all hematocrit levels (). Fig. 3(a) SA, (b) SS, and (c) MBF for the 750 nm laser exposure as a function of hematocrit, aggregate size, and oxygenation level. The error bars (too small to be seen) denote the standard deviation for 80 PA signals or spectra. 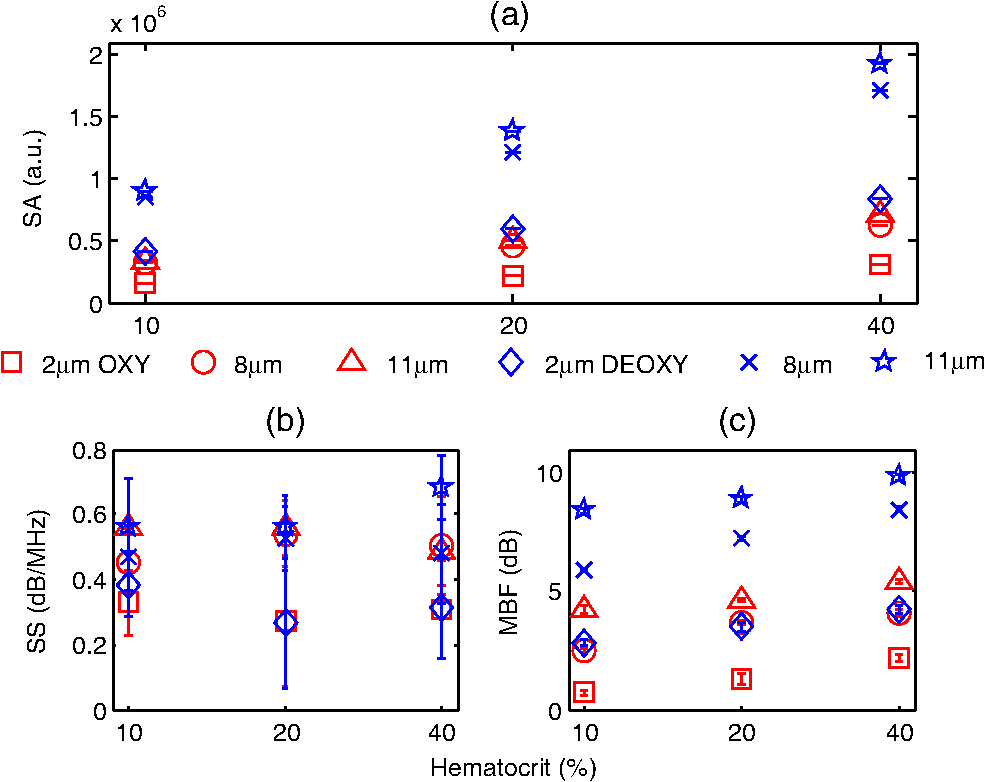 The SS (obtained from the line of best fit to the normalized spectra) is shown in Fig. 3(b) for the 750 nm exposure. As the hematocrit increased, the SS did not change in a statistically significant manner when comparing the nonaggregated with aggregated samples (). The trend was similar for both oxygenated and deoxygenated samples. In addition, there was no statistically significant change when comparing the nonaggregated samples with aggregated samples (8 and 11 μm) (). For the nonaggregated samples, the average SS over all hematocrit levels was . In the case of the MBF [Fig. 3(c)], there was a monotonic increase with increasing hematocrit level in a very similar manner to the increase in PA SA. The MBF increased by for each doubling of the hematocrit level for all aggregation levels and both oxygenation states. Aggregated samples had an MBF than nonaggregated samples at all hematocrit and oxygenation states (). The quantitative summary of the SA, SS, and MBF for the other exposure analyzed (1064 nm) are shown in Fig. 4. All oxygenated samples had a SA greater than the deoxygenated samples () and increased by for each doubling of hematocrit level for all aggregate sizes [Fig. 4(a)]. The aggregated samples were higher in SA compared to nonaggregated samples for all hematocrit and oxygenation levels (). Compared to the 750 nm exposure, the oxygenated RBC samples at 1064 nm had a SA greater at all aggregation and hematocrit levels (). The trend was reversed for the deoxygenated samples with the SA being greater for the 750 nm exposure (). Fig. 4(a) SA, (b) SS, and (c) MBF for the 1064 nm laser exposure as a function of hematocrit, aggregate size and oxygenation level. The error bars (too small to be seen) denote the standard deviation for 80 PA signals or spectra.  The SS [shown in Fig. 4(b)] followed similar trends to the 750 nm exposure with no statistically significant changes between nonaggregated and aggregated samples when the hematocrit increased from 10 to 40% (). Oxygenated and deoxygenated samples were not statistically significantly different from one another (). The average SS over all hematocrit levels was . For every doubling of the hematocrit level, the MBF increased by for all aggregation and oxygenation states at 1064 nm laser exposure [Fig. 4(c)]. An increase was observed when comparing the aggregated with nonaggregated samples at all hematocrit and oxygenation (). The MBF of the oxygenated RBC samples at 1064 nm was higher than the 750 nm () while the MBF of deoxygenated samples at 1064 nm was lower than the 750 nm counterpart (). The trend was true for all hematocrit and aggregation levels. 4.3.Experimental SA and Oxygenation LevelThe experimentally measured PA SA and [calculated using Eq. (5)] for all samples is shown in Fig. 5. For both wavelengths of illumination 750 nm [Fig. 5(a)] and 1064 nm [Fig 5(b)], the SA increased monotonically with increasing hematocrit. The increase was for each doubling of the hematocrit level. As the aggregation level was varied [by changing (Dex)], the PA SA exhibited a nonlinear trend. The maximum SA was achieved for a [Dex] of 3% for all hematocrit levels. The 1% and 8% [Dex] exhibited nearly identical SA (). The SA for nonaggregated samples [(Dex) 0%] was at least smaller than the aggregated samples at all hematocrit levels, for both wavelengths of illumination (). At the 750 nm exposure, the SA was greater than the 1064 nm exposure for all samples measured (). Fig. 5Experimentally measured PA SA and levels for all RBC samples. The error bars denote the standard deviations of 20 PA signals. Top row: PA SA for the (a) 750 nm and (b) 1064 nm exposures. Bottom row: (c) for all RBC samples illuminated at both wavelengths.  Figure 5(c) shows the calculated by utilizing Eq. (5) with both exposure wavelengths. linearly increased with increasing hematocrit with an average increase of for each doubling of the hematocrit level. At the 3% [Dex], was at the highest level higher than the nonaggregated case (). The 1% and 8% [Dex] levels were virtually identical at all hematocrit levels and higher than the nonaggregated samples (). 4.4.Experimental Spectral ParametersThe spectral parameters measured at both exposure wavelengths are shown in Fig. 6. As seen in Fig. 6(a) and 6(b), the SS does not change with increasing hematocrit (). At both wavelengths of illumination the SS values were approximately equal. The SS decreases by a factor of 7 when the [Dex] was 3% compared to the nonaggregated case when [Dex] was 0% at all hematocrit levels. The SS at 3% [Dex] is lower than the 1% and 8% [Dex] (). Fig. 6Experimentally measured SS and MBF for all RBC samples. The error bars denote the standard deviations of 20 PA signals. Top row: SS for the (a) 750 nm and (b) 1064 nm exposures. Bottom row: MBF for the (c) 750 nm and (d) 1064 nm exposures. 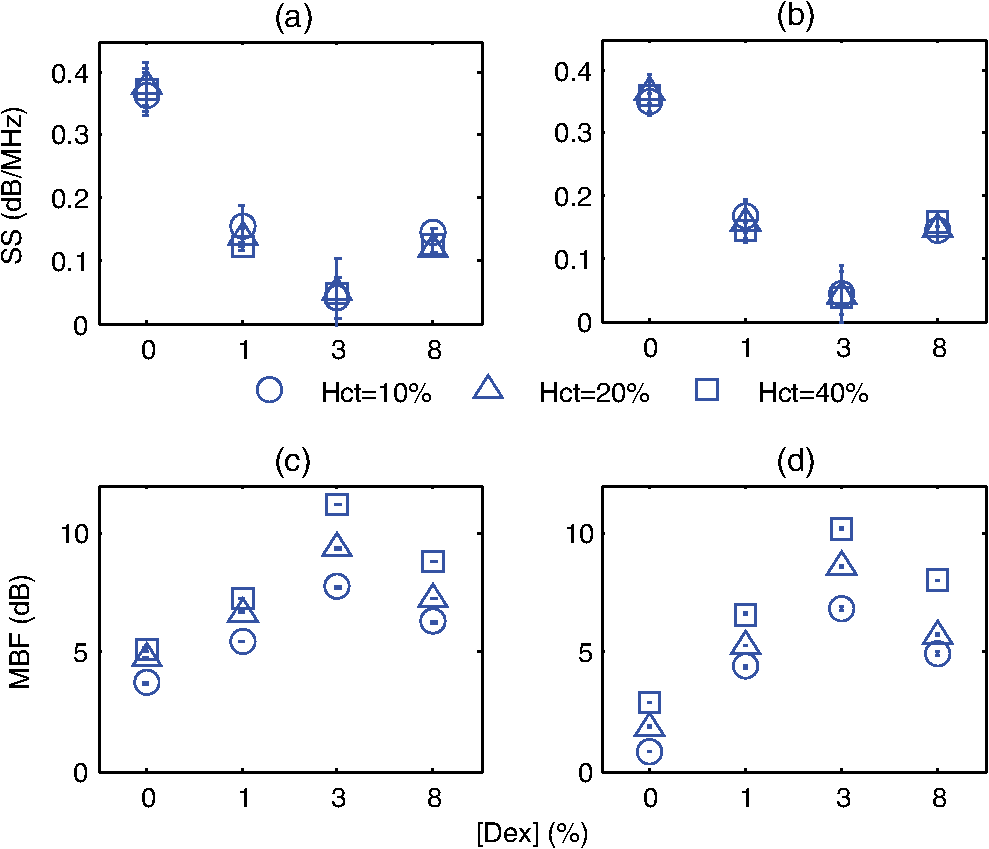 The MBF for both wavelengths of illumination is shown in Fig. 6(c) and 6(d). It monotonically increased with increasing hematocrit and it reached a maximum value for the 3% [Dex]. For both wavelengths, the increase was for each doubling of the hematocrit levels. At 3% [Dex] the MBF was higher than the nonaggregated case () and higher than the 1% and 3% [Dex] (which had approximately the same MBF) (). Such trend was true for both wavelengths. The MBF for the 750 nm exposure was higher than the 1064 nm exposure at all hematocrit and aggregation levels (). 5.Discussion and ConclusionsThe findings of this study demonstrate the potential of PAUS for detecting and monitoring changes due to the aggregation of RBCs while providing information on their oxygenation levels. The theoretical model developed here examined how the aggregation level and oxygenation status of RBCs affect the spectral features of the PA signals detected. By investigating both phenomena simultaneously, we have extended the theoretical model already developed for studying aggregation and oxygenation independently.27,28 The theoretical model was further improved by taking into account the effect of a finite transducer bandwidth on the PA signals and power spectra. This allows comparisons with experimental data with more fidelity since PA experiments are conducted using transducers with a finite frequency response. Furthermore, the PAUS parameters derived in this paper are an improvement to another study by our group which provided the proof of principle experiments for using PA to detect the presence of aggregation.29 In addition, by utilizing a commonly used experimental protocol using Dextran to induce various levels of aggregation,41 this study tests the capability of PA for detecting and monitoring changes that occur during RBC aggregation while providing information on the oxygenation status of the samples. Performing PA at multiple wavelengths also allows for simultaneous measurements of the average oxygenation level of the RBCs during aggregation. Currently, no other method that is capable of detecting the aggregation of RBCs and measuring the simultaneously. Reports in the literature have suggested a decrease in the release of oxygen during the presence of RBC aggregation, altering the tissue oxygenation status.6,42,43 This is consistent with the experimental results generated in the study [Fig. 5(c)]. Furthermore, by normalizing the power spectra with the transducer frequency response, the system dependencies of the detection process can be removed. By using methods of analysis derived from ultrasound tissue characterization,30,31 a quantitative method can be potentially developed for assessing the size and concentration of RBC aggregates. The theoretical model developed here is part of the first ever study of the effect of RBC aggregation and oxygenation level on the PA RF signals and their respective power spectra. Beginning with the nonaggregated RBCs [Fig. 2(a)], the monotonic increase observed in the SA with increasing hematocrit has been confirmed by other experimental studies.44 Increasing the number of optical absorbers increases the spectral power (and SA) linearly since it is calculated from the linear superposition of the spherical wavelets emitted from each individual RBC. The straightforward relationship between SA and hematocrit at these clinically relevant detection frequencies [Eq. (3)] is an advantage of PA imaging over its US counterpart for the study of RBC concentration. In US imaging, the backscattered power dependence on hematocrit is nonlinear and it depends on the spatial distribution of the RBCs and the interrogating US frequency.13 This renders the hematocrit assessment using US backscattering coefficient (BSC) measurements difficult. PA imaging has significant advantages when it comes to measurements of RBC aggregation, which is a hematocrit-dependent process. In PA imaging the size of the optical absorber is responsible for controlling the dominant frequency of the power spectrum.33 As shown in Fig. 2(d), PA spectra can differentiate RBC aggregates based on their sizes. When RBCs aggregate, the spatial separation of the individual RBCs approaches the thermal diffusion limit which is controlled by the physical parameters of the RBCs and surrounding medium.17 This may cause the entire aggregate to act as an individual PA source even though the generation of the PA signal is still due to the absorption of the individual RBCs. This provides the opportunity to differentiate sizes of absorbing objects based on the spectral content of PA RF signals. However, despite the fact that the non band-limited results presented in Fig. 2(a) and 2(d) suggest significant changes in power spectra due to the presence of RBC aggregation, they are simply ideal, theoretical representations of a more complex process. US transducers have a finite receiving bandwidth that inherently filters out many of the frequency components generated from PA sources.24 The results presented in Fig. 2(b) and 2(e) demonstrate how the transducer affects the PA signals received: the dominant spectral features predicted by the non band-limited equations are no longer present. Nevertheless, by using a 5 MHz transducer that is commonly used for PA measurements, significant changes in the power spectra of nonaggregated and aggregated RBCs are predicted. The experimentally measured power spectra also conducted with a 5 MHz center frequency transducer closely resembled the shape of the transducer frequency response, as predicted. Our group has also conducted PA measurements on single RBCs with high frequency transducers (center frequency 205 and 375 MHz) and the bandwidth of the transducer has been shown to significantly affect features of the recorded PA signals.45 Normalizing power spectra by the transducer frequency response provides a means of obtaining quantitative parameters which are related to structural features of the samples being interrogated. The normalized power spectra shown in Fig. 2(c) and 2(f) can be fitted to a line over the usable transducer bandwidth and regression analysis can provide the SS and MBF. The results obtained could be loosely interpreted using what is already known from ultrasound tissue characterization. In ultrasound tissue characterization, the SS is primarily related to the US scatterer size and shape. The MBF is a measure of the US backscatter and primarily depends on the scatter cross section and concentration.31 In the case of PA imaging, the absorber size and concentration can also be related to parameters that can be obtained from the spectroscopic analysis of PA signals. It was possible to distinguish between the various hematocrit and aggregation levels using the MBF parameter. The monotonic increase in the MBF with increasing hematocrit is in accordance to the trends followed by the PA SA. This is expected since the MBF is a measure of absorber (i.e., RBC) cross section and concentration. In addition, as the aggregation level increased, the MBF significantly increased compared to the nonaggregated case. That is because the signal strength for aggregated RBCs in the low frequency regime increases compared to the nonaggregated case [Fig. 2(c)]. However, the model did not predict significant changes in the SS as a function of hematocrit or aggregation level [Figs. 3(b) and 4(b)]. Experimental measurements of the spectral parameters also reveal significant differences between nonaggregated and aggregated RBC samples (Fig. 6). As predicted by theory, a monotonic increase in the MBF with increasing hematocrit was measured. Moreover, the MBF was at a maximum when the size of the aggregate is at a maximum (3% [Dex]). The decreases in the SS as the [Dex] increased can be interpreted by the increase in the aggregate sizes which are controlled by the [Dex]. The SS parameter is a measure of the scatterer size in ultrasound tissue characterization and it decreases with increasing scatterer size.31 Theoretical results also predict similar changes for individual absorbers.33 At 3% [Dex] the SS is at a minimum for both wavelengths which suggests that the size of the aggregate is at a maximum [Fig. 6(a) and 6(b)]. Other experimental assessments of the effect of [Dex] on RBC aggregation have shown the largest sizes forming with a [Dex] of 3%.46 Our group has independently assessed the viscosity of the RBC samples at the same [Dex] as the current study and obtained very good correlations with the experimentally measured PA SA.29 The SS for the nonaggregated case at all hematocrit levels is nearly identical to the SS predicted by the theoretical results (). This suggests that the theoretical model developed here could be used to predict the frequency dependence of experimental PA signals. At the frequency regime where the experimental transducer is most sensitive (), the experimental spectra and the nonaggregated theoretical spectra show good agreement between the experimental and theoretical SS parameter. Experimentally and at these frequencies, a collection of nonaggregated RBCs inside a cylindrical container could be, to a good approximation, be seen as a collection of absorbing spheres much like what is simulated. For the aggregated case, the spectral parameters derived from the model and obtained in experiments could not be directly compared since the aggregated RBCs are likely not accurately represented by the hexagonal packing arrangement used in simulations. However, this simple approximation of the aggregate structures and their spatial agreement has provided rich insights into how PA can be used to monitor RBC aggregation. The presence of the largest aggregates was indicated by the significant increases in the MBF when comparing the nonaggregated samples to the aggregated ones [Fig. 6(c) and 6(d)]. The largest MBF was observed for the 3% [Dex] samples at all hematocrit levels. This is expected since the MBF is a direct measure of the PA SA and is dependent on the absorber concentration. The observable changes in the MBF reflect the linear relationship that exists between RBC concentration and the strength of the PA signal measured at these detection frequencies. This is a clear advantage of PA imaging for measuring RBC aggregation since other techniques are not sensitive enough to measure hematocrit levels of aggregated RBC samples.10 The theoretical SS showed significant differences compared to the experimentally measured one, likely because aggregated RBCs are not accurately represented by the hexagonal packing arrangement used in the simulations. RBC aggregates observed experimentally showed both a combination of rouleux and spherical clusters of varying sizes, as shown in Fig. 1. It is thus expected that the detected signals will be a result of the combination of the PA response of aggregates of different shapes and sizes. The theoretical model does not take into account the varying sizes of aggregates nor does it simulate the more realistic rouleaux or clusters that are observed experimentally. For direct comparisons with experiment, the theoretical model should be improved to take into account the more appropriate 3D structures of the aggregates. PAUS can be used to measure the oxygenation level of RBC samples in addition to monitoring their aggregation. The theoretical results obtained from fully oxygenated and deoxygenated samples at two illumination wavelengths demonstrate the potential of PA for differentiating the oxygenation levels of RBC samples. The changes in SA and MBF are significant enough to differentiate between the two oxygenation levels (Figs. 3 and 4). Differences between oxygenated and deoxygenated samples at both wavelengths correspond to the differences that exist between the absorption coefficients at each wavelength. The theoretical results suggest that two-wavelength PA allows to measure while simultaneously assessing the presence of RBC aggregation. As seen in Fig. 5(c), the PA measurements suggest increases by more than 20% when RBCs aggregate, which is consistent with the hypothesis that aggregation decreases the ability of the RBCs to release oxygen to the surrounding environment. Such an observation has important implications for oxygen transfer from RBCs to surrounding tissues. In the presence of RBC aggregation, the plasma layer surrounding the RBCs which helps reduce the frictional interaction with the endothelial cells of the blood vessels increases in thickness.42 This impairs the diffusion of oxygen to the surrounding tissues thus increasing the level. Such increases have been measured experimentally using a microscope system coupled with a spectrophotometer.6 The reported increased by when the [Dex] concentration increased to 3%, similar to the findings of the current study. This study demonstrates, for the first time, the potential of PAUS to detect changes due to RBC aggregation and oxygenation. In this investigation, we have been able to simulate aggregates of varying sizes and achieve varying degrees of aggregation by changing the [Dex] and report the changes observed in the PA signals by means of PAUS while simultaneously obtaining estimates of the oxygen level for each sample. The PAUS techniques developed here suggest that it is possible to obtain quantitative measures of aggregate size and concentration. To the best of our knowledge, this is the first time that PA has been used for the investigation of RBC aggregation and oxygenation. The results of this study suggest the potential of PA as a noninvasive tool for detecting RBC aggregation. AcknowledgmentsThe authors acknowledge the financial support of following granting agencies awarded to M. Kolios: Natural Sciences and Engineering Research Council of Canada, Canadian Institutes of Health Research, Canadian Foundation for Innovation, Canada Research Chair Program, and a program project grant entitled “Ultrasound for Cancer Therapy” from the Terry Fox Foundation. E. Hysi is supported through an NSERC Alexander Graham Bell Graduate Scholarship. The authors would also like to thank Drs. G. Cloutier and J. Tripette (Laboratory of Biorheology and Medical Ultrasonics), J. Barry (Sunnybrook Health Sciences Center), and A. Worthington (Ryerson University). ReferencesH. J. Meiselman,
“Red blood cell aggregation: 45 years being curious,”
Biorheology, 46 1
–9
(2009). http://dx.doi.org/10.3233/BIR-2009-0522 BRHLAU 0006-355X Google Scholar
O. K. BaskurtB. NeuH. J. Meiselman, Red Blood Cell Aggregation, 1
–304 CRC Press, Boca Raton, FL
(2011). Google Scholar
D. E. Brooks,
“Mechanism of red cell aggregation,”
Blood Cells, Rheology and Aging, 158
–162 Springer Verlag, Berlin
(1988). Google Scholar
S. ChienK. M. Jan,
“Ultrastructural basis of the mechanism of rouleaux formation,”
Microvasc. Res., 5
(2), 155
–166
(1973). http://dx.doi.org/10.1016/0026-2862(73)90068-X MIVRA6 0026-2862 Google Scholar
J. J. Bishopet al.,
“Effects of erythrocyte aggregation on velocity profiles in venules,”
Am. J. Physiol. Heart Circ. Physiol., 280
(1), H222
–H236
(2001). 0363-6135 Google Scholar
N. Tateishiet al.,
“O2 release from erthrocytes flowing in narrow O2-permable tube: effects of erythrocyte aggregation,”
Am. J. Physiol. Heart Circ. Physiol., 281
(1), H448
–H456
(2001). 0363-6135 Google Scholar
Y. Arbelet al.,
“Erythrocyte aggregation as a cause of slow flow in patients of acute coronary syndromes,”
Int. J. Cardiol., 154
(3), 322
–327
(2012). http://dx.doi.org/10.1016/j.ijcard.2011.06.116 IJCDD5 0167-5273 Google Scholar
N. Tateishiet al.,
“Reduced oxygen release from erythrocytes by the acceleration-induced flow shift, observed in an oxygen-permable narrow tube,”
J. Biomech., 35
(9), 1241
–1251
(2002). http://dx.doi.org/10.1016/S0021-9290(02)00068-4 JBMCB5 0021-9290 Google Scholar
O. K. Baskurtet al., Handbook of Hemorheology and Hemodynamics, 1
–455 IOS Press, Amsterdam
(2007). Google Scholar
M. PlebaniE. Piva,
“Erythrocyte sedimentation rate: use of fresh blood for quality control,”
Am. J. Clin. Pathol., 117
(4), 621
–626
(2002). http://dx.doi.org/10.1309/QB1G-6FRR-DNWX-BKQ9 AJCPAI 0002-9173 Google Scholar
J. G. G. Dobbeet al.,
“Syllectometry: the effect of aggregometer geometry in the assesment of red blood cell shape recovery and aggregation,”
IEEE T. Bio-Med. Eng., 50
(1), 97
–106
(2003). http://dx.doi.org/10.1109/TBME.2002.807319 IEBEAX 0018-9294 Google Scholar
K. K. ShungG. A. Thieme, Ultrasonic Scattering in Biological Tissues, 1
–499 CRC Press, Boca Raton, FL
(1993). Google Scholar
R. S. C. Cobbold, Foundations of Biomedical Ultrasound, 100
–123 Oxford University Press, New York, NY
(2007). Google Scholar
M. Henkeet al.,
“Blood hemoglobin level may affect radiosensitivity-preliminary results on acutely reacting normal tissues,”
Int. J. Radiat. Oncol. Biol. Phys., 48
(2), 339
–345
(2000). http://dx.doi.org/10.1016/S0360-3016(00)00595-2 IOBPD3 0360-3016 Google Scholar
B. Venkateshet al.,
“Monitoring tissue oxygenation during resuscitation of major burns,”
J. Trauma, 50
(3), 485
–494
(2001). http://dx.doi.org/10.1097/00005373-200103000-00013 JOTRA5 0022-5282 Google Scholar
H. F. Zhanget al.,
“Imaging of hemoglobin saturation variation in single vessels in vivo using photoacoustic microscopy,”
Appl. Opt., 90
(5), 053901
(2007). http://dx.doi.org/10.1063/1.2435697 APOPAI 0003-6935 Google Scholar
L. V. WangH. Wu, Biomedical Optics Principles and Imaging, 1
–347 John Wiley & Sons, Inc., Hoboken, NJ
(2007). Google Scholar
L. V. Wang,
“Prospects of photoacoustic tomography,”
Med. Phys., 35
(12), 5758
–2767
(2008). http://dx.doi.org/10.1118/1.3013698 MPHYA6 0094-2405 Google Scholar
C. LiL. V. Wang,
“Photoacoustic tomography and sensing in biomedicine,”
Phys. Med. Biol., 54
(19), R59
–R97
(2009). http://dx.doi.org/10.1088/0031-9155/54/19/R01 PHMBA7 0031-9155 Google Scholar
J. G. KimM. XiaH. Liu,
“Extinction coefficients of hemoglobin for near-infrared spectroscopy of tissue,”
IEEE Eng. Med. Biol., 24
(2), 118
–121
(2005). http://dx.doi.org/10.1109/MEMB.2005.1411359 IEMBDE 0739-5175 Google Scholar
E. I. Galanzhaet al.,
“In vivo flow cytometry of circulating clots using negative photothermal and photoacoustic contrasts,”
Cytometry A, 79
(10), 814
–824
(2011). http://dx.doi.org/10.1002/cyto.a.v79a.10 1552-4922 Google Scholar
E. I. GalanzhaV. P. Zharov,
“Photoacoustic flow cytometry,”
Methods, 57
(3), 280
–296
(2012). http://dx.doi.org/10.1016/j.ymeth.2012.06.009 MTHDE9 1046-2023 Google Scholar
E. I. GalanzhaV. P. Zharov,
“In vivo photoacoustic and photothermal cytometry for monitoring multiple blood rheology parameters,”
Cytometry A, 79A
(10), 746
–757
(2011). http://dx.doi.org/10.1002/cyto.a.v79a.10 1552-4922 Google Scholar
X. Wanget al.,
“Noninvasive imaging of hemoglobin concentration and oxygenation in rat brain using high-resolution photoacoustic tomography,”
J. Biomed. Opt., 11
(2), 024015
(2006). http://dx.doi.org/10.1117/1.2192804 JBOPFO 1083-3668 Google Scholar
R. O. Esenalievet al.,
“Optoacoustic technique for noninvasive monitoring of blood oxygenation: a feasibility study,”
Appl. Optics, 41
(22), 4722
–4731
(2002). http://dx.doi.org/10.1364/AO.41.004722 APOPAI 0003-6935 Google Scholar
Y. Y. Petrovet al.,
“Multiwavelength optoacoustic system for noninvasive monitoring of cerebral venous oxygenation: a pilot clinical test in the internal jugular vein,”
Opt. Lett., 31
(12), 1827
–1829
(2006). http://dx.doi.org/10.1364/OL.31.001827 OPLEDP 0146-9592 Google Scholar
R. K. SahaM. C. Kolios,
“A simulation study on photoacoustic signals from red blood cells,”
J. Acoust. Soc. Am., 129
(5), 2935
–2943
(2011). http://dx.doi.org/10.1121/1.3570946 JASMAN 0001-4966 Google Scholar
R. K. SahaM. C. Kolios,
“Effects of erythrocyte oxygenation on optoacoustic signals,”
J. Biomed. Opt., 16
(11), 115003
(2011). http://dx.doi.org/10.1117/1.3655355 JBOPFO 1083-3668 Google Scholar
E. HysiR. K. SahaM. C. Kolios,
“On the use of photoacoustics to detect red blood cell aggregation,”
Biomed. Opt. Express, 3
(9), 2326
–2338
(2012). http://dx.doi.org/10.1364/BOE.3.002326 BOEICL 2156-7085 Google Scholar
E. J. Feleppa,
“Ultrasonic tissue-type imaging of the prostate: implications for biopsy and treatment guidance,”
Cancer Biomark., 4
(4–5), 201
–212
(2008). 1574-0153 Google Scholar
F. L. Lizziet al.,
“Relationship of ultrasonic spectral parameters to features of tissue microsctructure,”
IEEE T. Ultrason. Ferr., 33
(3), 319
–329
(1986). http://dx.doi.org/10.1109/T-UFFC.1987.26950 ITUCER 0885-3010 Google Scholar
M. C. KoliosG. J. Czarnota,
“Potential use of ultrasound for the detection of cell changes in cancer treatment,”
Future Oncol., 5
(10), 1527
–1532
(2009). http://dx.doi.org/10.2217/fon.09.157 1479-6694 Google Scholar
G. J. Diebold,
“Photoacoustic monopole radiation: waves from objects with symmetry in one, two and three dimensions,”
Photoacoustic Imaging and Spectroscopy, 3
–17 CRC Press, Boca Raton, FL
(2009). Google Scholar
F. T. H. YuG. Cloutier,
“Experimental ultrasound characterization of red blood cell aggregation using the structure factor size estimator,”
J. Acoust. Soc. Am., 122
(1), 645
–656
(2007). http://dx.doi.org/10.1121/1.2735805 JASMAN 0001-4966 Google Scholar
F. T. H. Yuet al.,
“Ultrasonic parametric imaging of erythrocyte aggregation using the structure factor size estimator,”
Biorheology, 46
(4), 343
–363
(2009). http://dx.doi.org/10.3233/BIR-2009-0546 BRHLAU 0006-355X Google Scholar
T. L. Szabo, Diagnostic Ultrasound Imaging: Inside Out, 97
–135 Elsevier Academic Press, New York, NY
(2004). Google Scholar
R. K. Sahaet al.,
“Validity of a theoretical model to examine blood oxygenation dependent optoacoustics,”
J. Biomed. Opt., 17
(5), 055002
(2012). http://dx.doi.org/10.1117/1.JBO.17.5.055002 JBOPFO 1083-3668 Google Scholar
E. L. HinrichsenJ. FederT. Jossang,
“Random packing of disks in two dimensions,”
Phys. Rev. A, 41
(8), 4199
–4209
(1990). http://dx.doi.org/10.1103/PhysRevA.41.4199 PRVABI Google Scholar
Y. W. YuanK. K. Shung,
“Ultrasonic backscatter from flowing whole blood I: dependence on shear rate and hematocrit,”
J. Acoust. Soc. Am., 84
(1), 52
–58
(1988). http://dx.doi.org/10.1121/1.397238 JASMAN 0001-4966 Google Scholar
W. O. Reece, Functional Anatomy and Physiology of Domestic Animals, 45
–83 4th edn.Wiley-Blackwell, Hong Kong
(2011). Google Scholar
O. K. Baskurtet al.,
“New guidelines for hemorheological laboratory techniques,”
Clin. Hemorheol. Micro., 42
(2), 75
–97
(2009). http://dx.doi.org/10.3233/CH-2009-1202 1386-0291 Google Scholar
N. Tateishiet al.,
“Flow dynamics of erythrocytes in microvessels of isolated rabbit mesentery: cell-free layer and flow resistance,”
J. Biomech., 27
(9), 1119
–1125
(1994). http://dx.doi.org/10.1016/0021-9290(94)90052-3 JBMCB5 0021-9290 Google Scholar
N. TateishiN. MaedaT. Shiga,
“A method for measuring the rate of oxygen release from single microvessels,”
Circ. Res., 70
(4), 812
–819
(1992). http://dx.doi.org/10.1161/01.RES.70.4.812 CIRUAL 0009-7330 Google Scholar
A. B. Karpiouket al.,
“Combined ultrasound and photoacoustic imaging to detect and stage deep vein thrombosis: phantom and ex vivo studies,”
J. Biomed. Opt., 13
(5), 055406
(2008). http://dx.doi.org/10.1117/1.2992175 JBOPFO 1083-3668 Google Scholar
M. Ruiet al.,
“Photoacoustic microscopy and spectroscopy of individual red blood cells,”
in Biomedical Optics, OSA Technical Digest (CD) Optical Society of America,
(2010). Google Scholar
O. K. BaskurtR. A. FarleyH. J. Meisleman,
“Erythrocyte aggregation tendency and cellular properties in horse, human, and rat: a comparative study,”
Am. J. Physiol. Heart Circ. Physiol., 273
(6 Pt 2), H2604
–H2612
(1997). 0363-6135 Google Scholar
|
|||||||||||||||||||||||||


