|
|
1.IntroductionNarrow band imaging (NBI) is a spectrally selective, reflectance-based technique that has seen extensive clinical implementation and study in recent years.1 NBI provides enhanced visualization of small, superficial blood vessels at 415 nm wavelength and larger, deeper vessels at 540 nm wavelength.2 This ability may facilitate endoscopic detection of gastrointestinal abnormalities such as specialized intestinal metaplasia, colon and esophageal cancer,1 as well as pathology in other areas such as oral mucosa.3 In early NBI work by Gono et al.,2,4 415 and 540 nm wavelengths were selected to correspond with peaks in the absorption spectrum of hemoglobin (Hb). Increased vascular contrast was attributed to wavelength-dependent variations in tissue optical properties,2,4 however; minimal quantitative insights into the relative impact of scattering and absorption were provided. In subsequent studies, the depth-selectivity provided by NBI was attributed to the fact that photons at 415 nm scatter with minimal penetration depth in mucosal tissue, resulting in high contrast for small vessels at shallow depth whereas at 540 nm, tissue scattering is lower, enabling visualization of deeper vessels.3,5 While tissue scattering is certainly a key factor in determining the depth-dependency of contrast, the claim that differences in scattering between 415 and 540 nm are sufficient to provide the primary mechanism of NBI depth-selectivity has not been rigorously validated. Furthermore, there is a general lack of theoretical and fundamental experimental data on NBI light–tissue interactions in the literature. The purpose of the current study was to improve understanding of NBI systems currently in clinical use by evaluating the basic light–tissue interaction mechanisms that influence NBI and determining the relative significance of scattering and absorption on contrast in NBI. This has been achieved using a voxel-based Monte Carlo model capable of simulating reflectance distributions and their variation with optical properties and vessel diameter and depth. Validation of the model was performed via experimental measurements of a tissue phantom. 2.MethodsIn the Monte Carlo simulations performed for this study, a volume of generalized epithelial tissue (e.g., esophagus) was represented as a three-component structure incorporating a 0.1-mm-thick epithelial layer, a 0.9-mm-thick mucosal layer and a single cylindrical blood vessel of varying diameter and depth, shown in Fig. 1.6 Two sets of optical properties were used to represent the mucosal region: (1) a “normal” case in which the effect of diffuse vasculature is simulated using bulk optical properties that incorporate Hb absorption7 and (2) a “blood free mucosa” (BFM) case in which the contribution of Hb absorption has been removed by setting mucosal absorption at the same level with epithelial absorption. The primary purpose of the BFM case is to provide a comparison that illustrates the effect of mucosal absorption. The cylindrical blood vessel had a diameter () of 20 to 400 μm, and depth () of 20 to 400 μm.4 Effective absorption coefficients () and scattering coefficients () of epithelium,8 normal mucosa,7 and blood9 for the 415 and 540 nm bands were obtained by weighting optical property spectra over bandwidths of 30 and 20 nm, respectively (Table 1). A material grid array comprised of cubic voxels measuring 10 μm on each side was used to define the tissue region.6 The lateral dimensions of the grid were for large vessels () and for small vessels (). Further details of our model are available elsewhere.6 Table 1Optical properties implemented in model (μa and μs in cm−1, g is unitless).
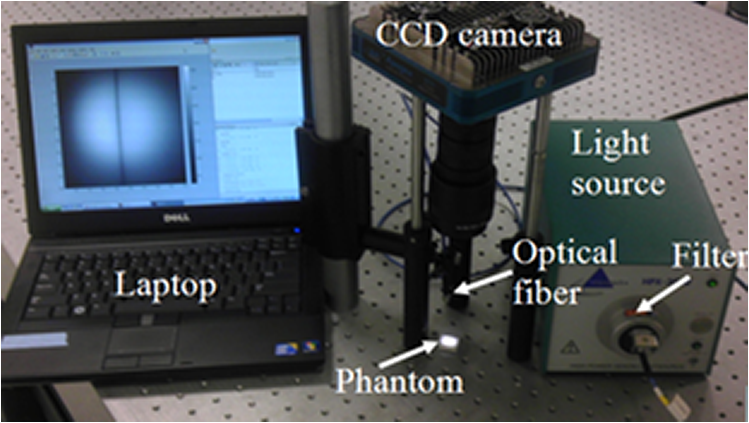
To validate the simulation results, measurements were performed using a fiberoptic-coupled Xenon light source (Ocean Optics, Dunedin, Florida), band pass filters ( and , Newport Corp., Irvine, Californai), and a CCD camera (Apogee Imaging Systems, Roseville, California) with a macro zoom lens, shown in Fig. 2. Liquid phantoms corresponding to normal and BFM cases were constructed with deionized water, hemoglobin (Hb) powder (Sigma-Aldrich, St. Louis, Missouri), and polystyrene microspheres (1.0 μm diameter, Polysciences Inc., Warrington, Pennsylvania). In order to achieve target optical property values based on the literature, shown in Table 1, microsphere concentrations were calculated with Mie theory and Hb concentrations determined using a spectrophotometer (Shimadzu Inc., Columbia, Maryland). An inset in Fig. 1 contains an optical coherence tomography (OCT) image of the capillary tube phantom with inner/outer diameters of 100/120 µm and immersed in the liquid phantom. Each reflection image was comprised of (). In both simulated and experimental images, contrast () was quantified using Weber’s law,3 where is the background intensity and is the intensity at the vessel region. Intensity values represent local reflectance normalized to maximum reflectance intensity, thus , , and are dimensionless. In the case where was less than 10%, was assigned a zero value.3.ResultsSimulated reflectance distributions are presented for two vessel sizes (20 and 400 μm) at two different depths (50 and 300 μm) based on 415 and 540 nm bands and the normal mucosa case, and are shown in Fig 3. In these images, contrast appeared high for the 50 μm depth case but low for 300 μm. For the 20 μm vessel cases at shallow depths, the 415 nm band appeared to produce higher contrast than the 540 nm band, and in the 400 μm vessel cases greater contrast was seen at for 540 nm as compared to 415 nm. A quantitative summary of depth selectivity—contrast as a function of depth—is shown in Fig. 4. One of the key spectral differences is the much lower contrast at 540 nm () compared to 415 nm (), particularly for small superficial vessels as seen in Fig. 4(a). Since bulk effects of mucosal scattering or absorption would tend to increase with vessel depth, this effect is attributable to spectral differences in within the imaged blood vessel ( at 415 nm versus at 540 nm). These spectral differences in contrast for superficial vessels decrease with increasing vessel diameter until 400 μm diameter vessels, seen in Fig. 4(c), show equivalent contrast at both wavelengths. Another apparent trend is the effect of vessel diameter on the depth-dependence of contrast. In general, decay in contrast with depth becomes weaker as vessel diameter increases. This is likely due to the fact that a reduction in light intensity caused by absorption in small vessels is more easily recovered through scattering, as compared to larger vessels which require a greater depth to diffuse. Fig. 3Examples of simulated reflectance distributions for vessel sizes () of 20 μm (a) and 400 μm (b) and vessel depths () of 50 μm (top row) and 300 μm (bottom row).  Fig. 4Simulated contrast as a function of for vessel sizes of (a) 20 μm, (b) 100 μm and (c) 400 μm, including normal and BFM cases at 415 and 540 nm. Inset in (a) presents the same curves normalized to the most superficial data point. 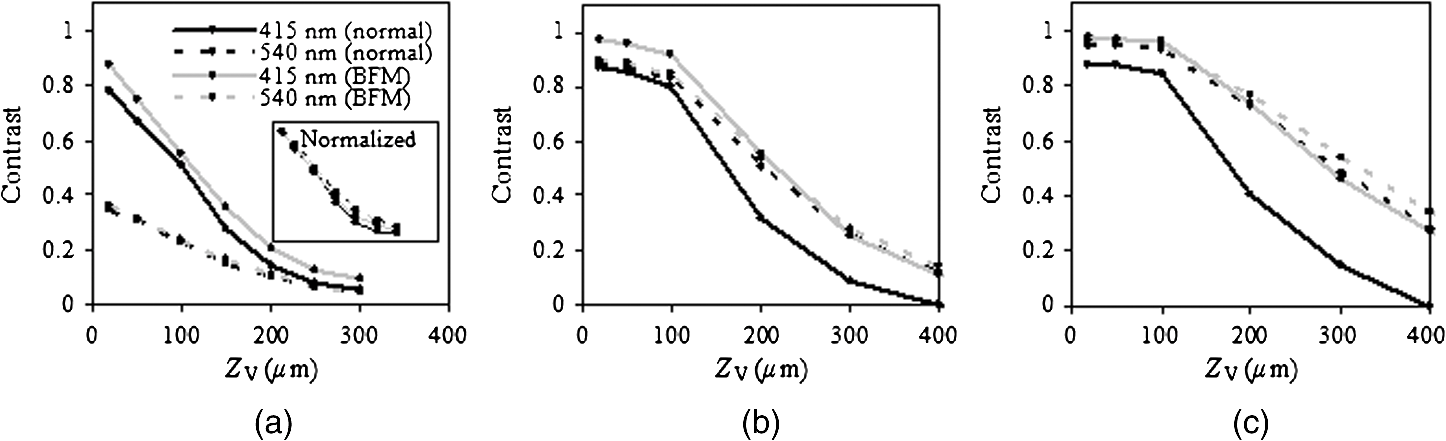 Results for normal and BFM cases in Fig. 4 illustrate the significance of Hb absorption on key NBI mechanisms. If the primary cause of spectral differences in vessel depth-selectivity is mucosal scattering, the difference in contrast between 415 and 540 nm for normal cases should be similar to that for corresponding BFM cases. In order to remove the aforementioned effect of spectral differences in absorption within the imaged vessel, the inset in Fig 4(a) shows curves normalized to the most superficial data point. Since spectral differences in contrast do not increase significantly with depth for small vessels, it is unlikely that either mucosal scattering or absorption play a significant role. For larger, deeper vessels, there is relatively little difference between corresponding BFM cases at 415 and 540 nm. For example, the 415 nm BFM case shows lower contrast than the 540 nm BFM cases by approximately 14% for and . This is evidence that spectral variations in mucosal scattering have a minor impact on contrast. Similarly, if the impact of mucosal absorption was significant, this would result in a difference between normal and BFM cases. This effect was not seen at 540 nm, whereas the 415 nm normal case shows a much lower contrast than the corresponding BFM case, particularly for larger vessels and greater depths. This is a key result in that it shows that mucosal Hb absorption has a dominant influence on depth dependence of contrast at 415 nm, but not at 540 nm. The greater impact of Hb absorption relative to tissue scattering on spectral variations in depth-sensitivity can be traced to the magnitude of changes in optical properties. When illumination changes from 540 to 415 nm, mucosal increases by 37%, whereas mean mucosal increases by nearly 500% and Hb by 750%. The finding that tissue scattering has less of an impact on spectral changes in NBI depth-selectivity than absorption stands in contrast to prior claims in the literature that were largely unsupported by experimental or numerical data.3,5 Experimental results measured with the capillary tube tissue phantom, shown in Fig. 5, provide validation of our numerical model. These results show good agreement with the corresponding trends for a 100 μm diameter vessel as in Fig. 4(b). Specifically, Fig. 5 shows overlap between the 415 nm BFM case and both 540 nm cases, and that contrast levels for the 415 nm normal cases are significantly lower than the other three cases. The mean discrepancy between these experimentally measured contrast values (normal and BFM) and the corresponding simulation data is 0.07 (23%). 4.ConclusionsOur modeling-based approach has provided unique and quantitative insights into NBI light–tissue interactions. While tissue scattering is a key factor in contrast degradation with depth, simulations indicate that the magnitude of change in mucosal from 415 to 540 nm is insufficient to have a major impact on contrast. Spectral variation in Hb absorption in superficial vasculature, however, likely has a strong impact on contrast in these vessels and in larger, deeper vessels. Finally, we believe that further basic studies of NBI may lead to a better understanding of these devices, as well as improved device design, novel applications, and greater clinical efficacy. AcknowledgmentsThe authors would like to thank Prof. Ian White of the University of Maryland, College Park for fabrication of the capillary tubes used in this study. ReferencesM. Mutoet al.,
“Narrow-band imaging of the gastrointestinal tract,”
J. Gastroenterol., 44
(1), 13
–25
(2009). http://dx.doi.org/10.1007/s00535-008-2291-5 0944-1174 Google Scholar
K. Gonoet al.,
“Endoscopic observation of tissue by narrowband illumination,”
Opt. Rev., 10
(4), 211
–215
(2003). http://dx.doi.org/10.1007/s10043-003-0211-8 1340-6000 Google Scholar
J. H. Takanoet al.,
“Detecting early oral cancer: narrowband imaging system observation of the oral mucosa microvasculature,”
Int. J. Oral Maxillofac. Surg., 39
(3), 208
–213
(2010). http://dx.doi.org/10.1016/j.ijom.2010.01.007 IJOSE9 0901-5027 Google Scholar
K. Gonoet al.,
“Appearance of enhanced tissue features in narrow-band endoscopic imaging,”
J. Biomed. Opt., 9
(3), 568
–577
(2004). http://dx.doi.org/10.1117/1.1695563 JBOPFO 1083-3668 Google Scholar
W. L. Curveret al.,
“Mucosal morphology in Barrett’s esophagus: interobserver agreement and role of narrow band imaging,”
Endoscopy, 40
(10), 799
–805
(2008). http://dx.doi.org/10.1055/s-2008-1077596 ENDCAM Google Scholar
T. J. Pfeferet al.,
“A three-dimensional modular adaptable grid numerical model for light propagation during laser irradiation of skin tissue,”
IEEE J. Sel. Top. Quantum Electron., 2
(4), 934
–942
(1996). http://dx.doi.org/10.1109/2944.577318 IJSQEN 1077-260X Google Scholar
J. Quet al.,
“Optical properties of normal and carcinomatous bronchial tissue,”
Appl. Opt., 33
(31), 7397
–7405
(1994). http://dx.doi.org/10.1364/AO.33.007397 APOPAI 0003-6935 Google Scholar
R. Drezeket al.,
“Understanding the contributions of NADH and collagen to cervical tissue fluorescence spectra: modeling, measurements, and implications,”
J. Biomed. Opt., 6
(4), 385
–396
(2001). http://dx.doi.org/10.1117/1.1413209 JBOPFO 1083-3668 Google Scholar
M. Friebelet al.,
“Determination of optical properties of human blood in the spectral range 250 to 1100 nm using Monte Carlo simulations with hematocrit-dependent effective scattering phase function,”
J. Biomed. Opt., 11
(3), 034021
(2006). http://dx.doi.org/10.1117/1.2203659 JBOPFO 1083-3668 Google Scholar
|
|||||||||||||||||||||||||||||||||||||||||||||