

|
|
1.IntroductionPhotoacoustic (PA) imaging of plasmonic metallic nanoparticle contrast agents is a powerful noninvasive imaging method with high contrast and micron-scale resolution, but the precise nature of the PA signal generated from assembled plasmonic nanoparticles has yet to be fully characterized. In this work, we demonstrate that aggregation, or clustering, of gold nanoparticles causes an increase in PA signal in comparison to the PA signal generated by disperse nanoparticles at identical concentrations. We used a silica coating to spatially separate the gold nanoparticles, reducing the surface plasmon resonance coupling, and thereby minimizing changes to the optical absorption spectra upon aggregation, in order to study the thermodynamics of the system. During PA imaging, a pulsed laser light source is used to excite optically absorbing materials, creating transient, localized heating. The increase in temperature leads to thermal expansion, generating pressure waves which can be analyzed to provide spatial and compositional information about the imaged region.1–5 This technique combines advantageous features of ultrasound imaging, including good spatial resolution at extensive depth within tissue, with the enhanced contrast and multiplexing capabilities possible with optical imaging techniques. Plasmonic nanoparticles (NPs),having tunable optical extinction cross-sections many orders of magnitude above endogeneous materials, are promising contrast agents for PA imaging.6–8 Functionalizing the nanoparticles, e.g., by conjugating a cell-receptor specific monoclonal antibody9,10 to their surface, can result in molecular information within a PA image.11–13 The theoretical principles surrounding the generation of pressure waves from the thermal expansion of a heterogeneous sample of nanoparticles differ from the theoretical principles of PA signal generation from larger endogenous tissue objects.14–16 The thermal and stress confinement conditions, commonly imposed upon models of the photoacoustic effect,17 are reasonable assumptions for millimeter-sized objects; however, nanometer-sized materials often do not meet either confinement condition when using a nanosecond pulsed laser source. Because of their small size and high thermal conductivity, the heat generated within metallic nanoparticles will be equalized throughout the volume of the nanoparticle within picoseconds, and therefore a nanosecond laser pulse is “long” in comparison to the time of heat conduction within the nanoparticle. Additionally, the PA signal is primarily generated within the solution surrounding the nanoparticles, rather than within the nanoparticle itself.18 Therefore, the generation of PA signal from nanoparticles occurs in three stages: 1) the nanoparticles absorb the pulsed laser energy, generating heat which is quickly equalized within the nanoparticle, 2) the heat is transferred from the nanoparticles to the surrounding environment, and 3) the environment undergoes thermal expansion, generating the pressure wave. The optical absorption properties leading to the nonradiative heating of the gold nanoparticles such as nanospheres and nanorods (step 1), and the thermoelastic properties of typical nanoparticle materials and solvents (step 3), are well characterized. The dependence of the PA signal amplitude on the rate of thermal conduction between the nanoparticle and the surrounding environment (step 2) has been predicted theoretically16 and demonstrated experimentally,19 but the importance of heat transfer from the nanoparticle to the surrounding environment is less understood. Here, we demonstrate an increase in PA signal from nanoparticle contrast agents which are aggregated, in comparison to disperse nanoparticles. The source of this increased PA signal is not optical absorption changes caused by surface plasmon resonance coupling, but is instead most likely related to the thermal properties and thermodynamics of the system. 2.Materials and Methods2.1.Nanoparticle Synthesis and CharacterizationGold nanorods were synthesized using seed-mediated growth with a micelle template to direct nanoparticle shape, as described in previously reported methods.20,21 Gold seeds were synthesized by adding 5.7 ml of 0.5 mM gold(III)chloride hydrate () in ultrafiltered deionized water to 5 ml of 0.2 M cetyltrimethyl-ammonium bromide (CTAB).Under stirring, 0.6 ml of ice cold 0.01 M sodium borohydride was added, allowed to react for 2 min, then allowed to stand for 5 min. A growth solution was prepared by combining 76 ml of 0.2 M CTAB with 1.6 ml of 0.01 M silver nitrate and 8 ml of 0.01 M . The growth solution was heated to 30°C before 0.88 ml of 0.1 M ascorbic acid was added. To the growth solution, 0.192 ml of the gold nanoseed solution was added, stirring for 3 min. The particles were allowed to stand overnight at 30°C, and then centrifuged at 18,000 g and resuspended in ultrafiltered deionized water. During the nanorod synthesis, the aspect ratio of the nanorods can be controlled via the amount of silver in the reaction. The prepared gold nanorods were coated with methoxy-poly(ethylene glycol)-thiol (mPEG-SH) through ligand exchange with the surface-stabilizing ligands, followed by growth of an amorphous silica coating from a solution of tetraethyl orthosilicate (TEOS) as previously described.22 The synthesized gold nanorods were added to 80 ml of of 5000 MW mPEG-SH, sonicated for 1 min, allowed to sit overnight, then concentrated to an optical density of 15 using a 50 kDa centrifugal filter centrifuged at for 10 min. To silica-coat the nanorods, a 2-ml volume of the PEGylated nanorods was added to 3 ml of isopropanol and stirred. Next, 1.2 ml of 3% TEOS and 1.2 ml of 28% ammonium hydroxide were added under stirring. After 5 h, the reaction was transferred into a 50 kDa centrifugal filter, centrifuged at for 10 min, and then resuspended in ultrapurified deionized water. Gold nanospheres were synthesized via citrate reduction of under reflux and stirring followed established procedures.23 A 0.5-ml volume of a solution was added to 49 ml of boiling ultrapurified water under reflux and vigorous stirring. A 0.75 ml volume of trisodium citrate was then quickly added. The sizes of the resulting nanospheres are controlled by the amount of trisodium citrate solution added to the reaction. The spheres were incubated with 5 μg of mPEG-SH (5000 MW), and then the silica-coating was performed as described for the nanorods, allowing the reaction to occur for 12 h to obtain a thicker coating. The silica-coated nanoparticles were aggregated using a combination of electrostatic and mechanical forces. Silica-coated nanoparticles were incubated in a strong salt solution (10x phosphate buffered saline) for over 24 h to induce flocculation. The flocculated solutions were then centrifuged (5810 R, Eppendorf) at for 1 h, and resuspended in deionized water, at equal volume to the original disperse solution, to maintain similar concentrations of particles. Disperse and aggregated solutions of silica-coated gold nanorods and nanospheres were characterized by acquiring UV-Vis absorption spectra (Synergy HT microplate reader, Biotek Instruments, Inc.) and by imaging with transmission electron microscopy (TEM) (S-5500, Hitachi Corp.).The molar extinction coefficient, used to calculate the silica-coated gold nanorod concentration, was calculated from the absorbance of as-synthesized gold nanorods, using the amount of gold initially in the reaction. The UV-Vis absorption at the peak plasmon resonance wavelength and the calculated molar extinction coefficient were used to provide an estimate of the concentration of nanoparticles in solution. 2.2.Photoacoustic Imaging and AnalysisTo compare PA signals of the aggregated and disperse nanoparticles, gelatin phantoms containing inclusions of the silica-coated gold nanoparticles were prepared. The phantom was composed of 8 wt% gelatin with 0.2 wt% silica scatterers (included for optical and ultrasound scattering). Sample inclusions, each 20 μL in volume, were prepared which contained varying concentrations of nanoparticles, both disperse and aggregated. Typical inclusions were . The phantoms were imaged using a previously described custom-built imaging system which acquires both ultrasound and PA signals.24 A 25 MHz single element focused ultrasound transducer (Panametrics, Inc., , ) was used to acquire PA transients generated by a 7 ns pulsed laser beam from a tunable OPO (Premiscan, GWU, Inc.) pumped by a laser (Quanta-Ray, Spectra Physics, Inc.), focused to a beam diameter of 0.6 cm to match the focal diameter of the ultrasound transducer. Laser wavelengths, matching the peak optical absorption wavelength of the nanoparticles, were used to image the phantoms (e.g., 830 nm was used to image silica-coated gold nanorods, and 532 nm was used to image silica-coated gold nanospheres). A mechanical axis (Zaber, Inc.) was used to scan the transducer over the phantom in steps of 100 μm, acquiring 10 averages at each step. Data was acquired using an 8-bit 500 MHz digitizer (Gage Applied Technologies, Inc.). Ultrasound images, acquired concurrently, were used to select each inclusion region of interest. Inclusions did not contain silica scatters to provide hypoechoic contrast to aid ROI definition. The means and standard deviations of the amplitude of the band-pass filtered (5–45 MHz) PA signals within each ROI were calculated ( per kernel) for analysis. 3.Results and Discussion3.1.Nanoparticle Synthesis and CharacterizationThe UV-Vis optical absorption spectra of the aggregated and disperse silica-coated nanoparticles are compared in Fig. 1(a) and 1(b). Despite significant aggregation, the UV-Vis spectra of both the nanorods and nanospheres changed minimally, demonstrating successful blocking of surface plasmon coupling by using a thick silica coating to isolate the individual gold cores. TEM of the resulting nanoparticles shows a silica coating measuring 25 nm surrounding gold nanorods which were on average in size [Fig. 1(c)]. Silica-coated gold nanospheres had a silica coating which was measured to be 40 nm thick, surrounding 20 nm diameter gold spheres [Fig. 1(d)]. This chemical and mechanical aggregation process created aggregates of various sizes, as seen in the TEM images in Fig. 1(c) and 1(d). Fig. 1UV-Vis absorption of disperse and aggregated silica-coated gold (a) nanorods and (b) nanospheres, demonstrating minimal surface plasmon resonance coupling effects occur upon aggregation of the particles. Transmission electron microscopy (TEM) images of the aggregated and disperse silica-coated gold nanorods (c), and aggregated and disperse silica-coated gold nanospheres (d). 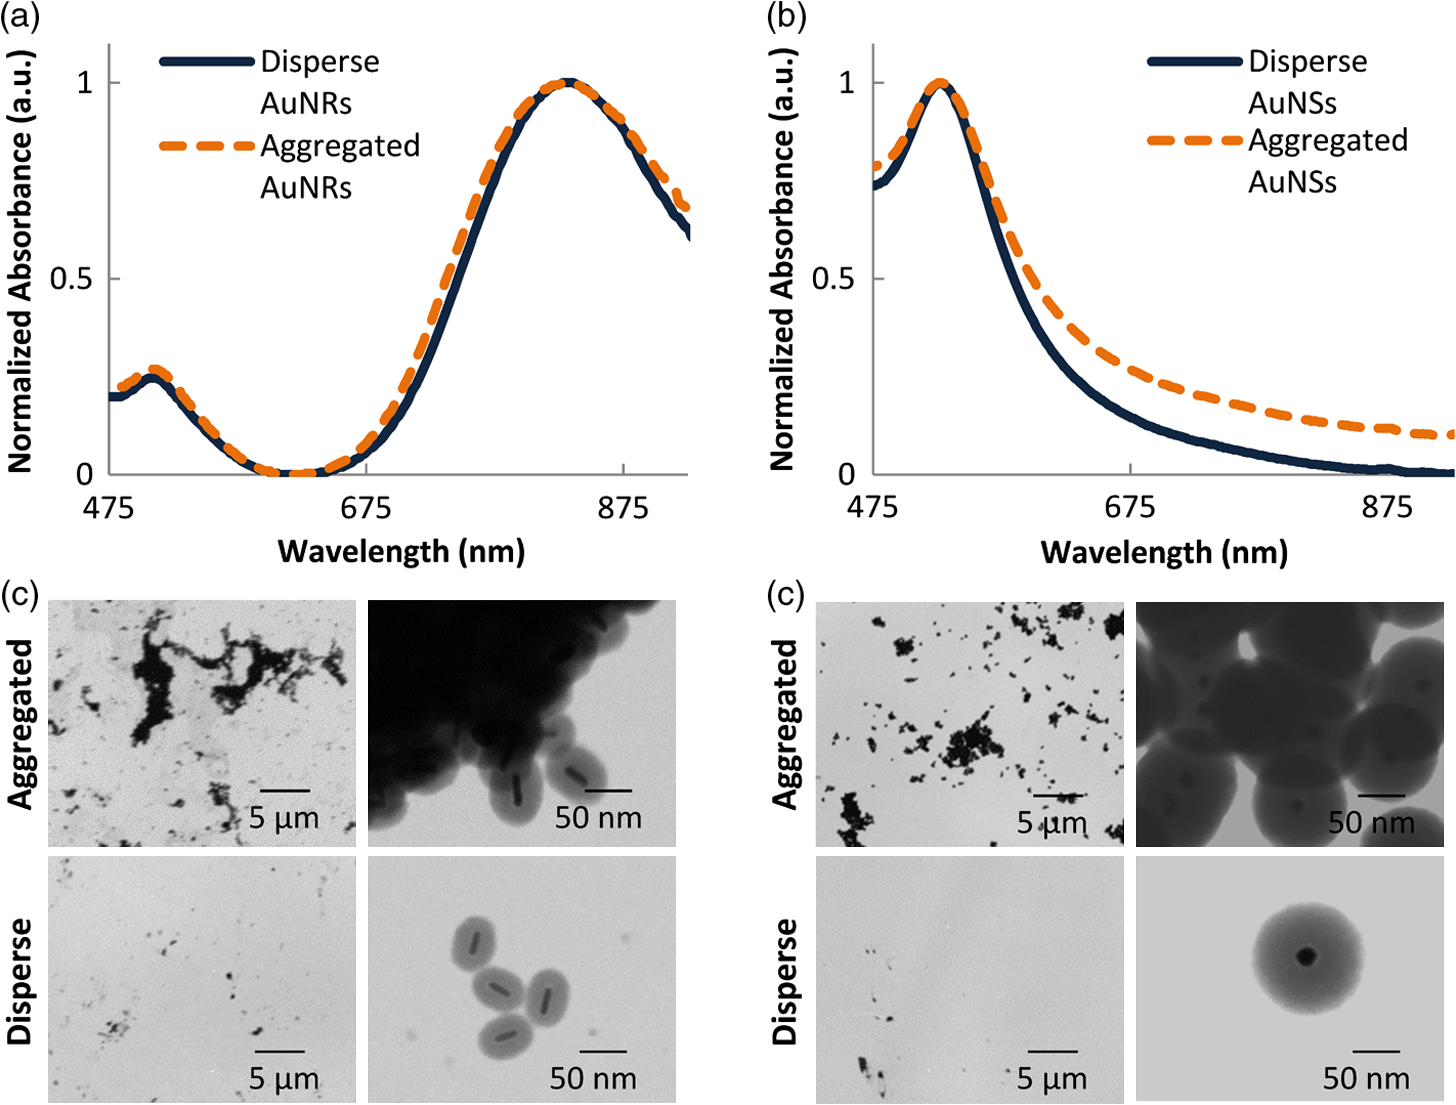 3.2.Photoacoustic Imaging and AnalysisPA images of the phantoms show an increase in signal amplitude when the silica-coated gold nanorods are aggregated, in comparison to disperse silica-coated gold nanorods [Fig. 2(a)]. The average PA signal dependence upon nanorod concentration is plotted in Fig 2(b). Fig. 2Photoacoustic (PA) signal from aggregated silica-coated gold nanoparticles is higher than the PA signal from disperse silica-coated gold nanoparticles. The PA images (a) correspond to varying concentration of silica-coated gold nanorods acquired using a laser fluence of . Scale bar is 1 mm, and the PA signal is displayed using a linear scale. The average PA signal from each inclusion is plotted versus the varying nanoparticle concentration in panel (b) Error bars represent one standard deviation of the signal within the corresponding inclusions.  The impact of the laser fluence upon the PA signal amplitude is presented in Fig. 3. As would be expected, increasing the laser fluence increases the PA signal for both silica-coated gold nanorods and nanospheres, both when aggregated and when disperse [Fig. 3(a) and 3(b)]. Figure 3(c) shows an increase in the average PA signal of the aggregated, in comparison to the disperse, silica-coated gold nanorods with increasing fluence, which is confirmed using aggregated and disperse silica-coated gold nanospheres in Fig. 3(d). In these experiments, the PA signal increased up to 7 times upon aggregation, in comparison to the PA signal from disperse nanoparticles. Fig. 3Photoacoustic (PA) signal in samples with aggregated and disperse nanoparticles increases with increasing fluence. The images correspond to varying laser fluence while acquiring PA signals from (a) silica-coated gold nanorods at , and (b) silica-coated gold nanospheres at . Scale bar is 1 mm, and PA signal is displayed with a linear scale. The average PA signal from each inclusion is plotted versus varying laser fluence (c) and (d). Error bars represent one standard deviation within the corresponding inclusions.  The amplitude of the PA signal is related to the optical absorption, the heat transfer from the nano-sized absorber to the surrounding fluid, and the thermoelastic properties of the fluid. In comparing our samples with disperse nanoparticles to our samples with aggregated nanoparticles, since the UV-Vis spectra of the clustered nanoparticles is similar, both in amplitude and in peak shape, we do not believe that clustering leads to an increase in light absorption. Additionally, it is not expected that an increase in optical scattering would greatly influence the PA signal amplitude, since calculations have indicated the increased scattering cross-sectional area caused by the silica coating will be two orders of magnitude below the absorption cross-sectional area.19 An increase in PA signal due to the temperature dependence of the thermal expansion coefficient, which is predicted and has been observed in suspensions of gold nanoparticles,14,15 is also not an obvious feature of the experimental data presented here. We expect that the increase in temperature within the fluid, upon clustering of the nanoparticles, would be minimal, based on models which have demonstrated that the environmental temperature increase surrounding gold nanoparticles upon clustering is very small (0.1°C, using incident light intensity of ).25 Second, the temperature-dependent thermal expansion coefficient would result in a nonlinear dependence of the PA signal with laser fluence, while our data appears to have a linear dependence with laser fluence. Effects not adequately described by current models of PA imaging could also lead to a signal enhancement with clustering. For example, previous studies have looked at the effects of nanoparticle clustering at higher energies and found increased PA signal due to increased bubble nucleation and cavitation.26 The generation of laser-induced cavitation would not be expected at the laser fluences used here,27 and is also not indicated by our data, since cavitation would likely exhibit a threshold, followed by a nonlinear signal increase. It is generally understood that the frequency spectrum of the PA signal decreases for smaller particles in comparison to larger particles, and it is possible that this could be an explanation for the increase in the PA signal detected by a 25 MHz frequency transducer. However, since nano-sized and micron-sized particles do not meet stress confinement, the frequency content of the PA signal is actually related to the time profile of the heat release from the particle into the environment;16,18 thus, size would not be expected to shift the PA signal frequency in the same way as it would under the stress confinement condition. Our aggregates are approximately 1 μm in size, as assessed by TEM, and our nanoparticles are approximately 100 nm; both sizes which would be too small to adequately satisfy stress confinement conditions, and therefore the PA pulse profile will follow that of the heat transfer rate to the environment. Because the PA signal, using a pulsed nanosecond laser with nanoparticle absorbers, is primarily generated in the fluid surrounding the nanoparticle, the model of the PA signal generated by an incompressible sphere16 provides insight into the properties of the PA effect for our nanoparticles. In this model, the PA pressure is proportional to the time derivative of the heat flux transferred to the fluid. It is possible that overlapping thermal profiles within the solvent layer surrounding each individual nanoparticle collectively add when the nanoparticles are clustered, which could have the effect of increasing the rate of heat flux. Because the PA signal is sensitive to the heat transfer properties of nanoparticle relative to the surrounding environment, it is proposed that changes to the temporal and spatial characteristics of heat transfer, due to the aggregation of the particles, are leading to the increase in PA signal. Considering that the PA signal generated by nanoparticles is proportional to the first time derivative of temperature, very small changes in the rate of interfacial heat transfer could result in a very large change in the signal amplitude. 4.ConclusionsThe results shown here demonstrate that aggregation of gold nanoparticles enhances PA signal. It is likely that this signal enhancement occurs because of an increase in the rate of heat transfer in aggregates in comparison to disperse nanoparticles. Given that bioconjugated gold nanoparticles targeted to cell receptors form clusters, or aggregates, when endocytosed,28 this demonstrated enhancement of PA signal could provide a potential method for determining whether gold nanoparticles have been endocytosed or remain external to cells when imaged in vivo. With the knowledge that simple aggregation of plasmonic NPs leads to a significant increase in PA signal, additional molecular-scale applications can be conceived. Aggregation-sensitive PA contrast agents can function as “sensors” to monitor assembly and biomolecular interactions in living cells and tissues.29 Concurrently increasing the PA signal while reducing the confounding optical absorption shift due to surface plasmon coupling could also lead to improvements in the sensitivity and accuracy of multispectral molecular PA imaging. AcknowledgmentsThe authors acknowledge support from the National Institutes of Health (NIH) under Grant Nos. CA159913 (C.L. Bayer), CA1497403, and EB015007. Assistance with TEM was provided by Juili Kevlar. We also thank Wolfgang Frey and Salavat Aglyamov at the University of Texas at Austin for helpful discussions during the preparation of this manuscript. ReferencesR. A. Kruger,
“Photoacoustic ultrasound,”
Med. Phys., 21
(1), 127
–131
(1994). http://dx.doi.org/10.1118/1.597367 MPHYA6 0094-2405 Google Scholar
X. Wanget al.,
“Noninvasive laser-induced photoacoustic tomography for structural and functional in vivo imaging of the brain,”
Nat. Biotech., 21
(7), 803
–806
(2003). http://dx.doi.org/10.1038/nbt839 NABIF9 1087-0156 Google Scholar
S. Y. EmelianovP. C. LiM. O’Donnell,
“Photoacoustics for molecular imaging and therapy,”
Phys. Today, 62
(8), 34
–39
(2009). http://dx.doi.org/10.1063/1.3141939 PHTOAD 0031-9228 Google Scholar
J. L. Suet al.,
“Advances in clinical and biomedical applications of photoacoustic imaging,”
Expert Opin. Med. Diagn., 4
(6), 497
–510
(2010). http://dx.doi.org/10.1517/17530059.2010.529127 1753-0059 Google Scholar
L. V. WangS. Hu,
“Photoacoustic tomography: in vivo imaging from organelles to organs,”
Science, 335
(6075), 1458
–1462
(2012). http://dx.doi.org/10.1126/science.1216210 SCIEAS 0036-8075 Google Scholar
A. A. OraevskyA. A. KarabutovE. V. Savateeva,
“Enhancement of optoacoustic tissue contrast with absorbing nanoparticles,”
Proc. SPIE, 4434 60
–69
(2001). http://dx.doi.org/10.1117/12.446693 PSISDG 0277-786X Google Scholar
X. D. Wanget al.,
“Laser-induced photoacoustic tomography enhanced with an optical contrast agent,”
Proc. SPIE, 5320 77
–82
(2004). http://dx.doi.org/10.1117/12.532434 PSISDG 0277-786X Google Scholar
A. Agarwalet al.,
“Targeted gold nanorod contrast agent for prostate cancer detection by photoacoustic imaging,”
J. Appl. Phys., 102
(6),
(2007). http://dx.doi.org/10.1063/1.2777127 JAPIAU 0021-8979 Google Scholar
C. Looet al.,
“Immunotargeted nanoshells for integrated cancer imaging and therapy,”
Nano Lett., 5
(4), 709
–711
(2005). http://dx.doi.org/10.1021/nl050127s NALEFD 1530-6984 Google Scholar
S. KumarJ. AaronK. Sokolov,
“Directional conjugation of antibodies to nanoparticles for synthesis of multiplexed optical contrast agents with both delivery and targeting moieties,”
Nat. Protocol., 3
(2), 314
–320
(2008). http://dx.doi.org/10.1038/nprot.2008.1 1750-2799 Google Scholar
J. A. Coplandet al.,
“Bioconjugated gold nanoparticles as a molecular based contrast agent: implications for imaging of deep tumors using optoacoustic tomography,”
Mol. Imaging Biol., 6
(5), 341
–349
(2004). http://dx.doi.org/10.1016/j.mibio.2004.06.002 1536-1632 Google Scholar
P. C. Liet al.,
“Multiple targeting in photoacoustic imaging using bioconjugated gold nanorods,”
Proc. SPIE, 6086 60860M
(2006). http://dx.doi.org/10.1117/12.645248 PSISDG 0277-786X Google Scholar
S. Mallidiet al.,
“Molecular specific optoacoustic imaging with plasmonic nanoparticles,”
Opt. Exp., 15
(11), 6583
–6588
(2007). http://dx.doi.org/10.1364/OE.15.006583 OPEXFF 1094-4087 Google Scholar
I. G. CalassoW. CraigG. J. Diebold,
“Photoacoustic point source,”
Phys. Rev. Lett., 86
(16), 3550
–3553
(2001). http://dx.doi.org/10.1103/PhysRevLett.86.3550 PRLTAO 0031-9007 Google Scholar
S. EgerevA. Oraevsky,
“Optothermoacoustic phenomena in highly diluted suspensions of gold nanoparticles,”
Int. J. Thermophys., 29
(6), 2116
–2125
(2008). http://dx.doi.org/10.1007/s10765-008-0541-7 IJTHDY 0195-928X Google Scholar
G. J. DieboldA. C. BeveridgeT. J. Hamilton,
“The photoacoustic effect generated by an incompressible sphere,”
J. Acoust. Soc. Am., 112
(5), 1780
–1786
(2002). http://dx.doi.org/10.1121/1.1508788 JASMAN 0001-4966 Google Scholar
G. J. Diebold,
“Photoacoustic monopole radiation: waves from objects with symmetry in one, two, and three dimensions,”
Photoacoustic Imaging and Spectroscopy, 3
–17 CRC Press, New York
(2009). Google Scholar
Y.-S. Chenet al.,
“Environment-dependent generation of photoacoustic waves from plasmonic nanoparticles,”
Small, 8
(1), 47
–52
(2011). http://dx.doi.org/10.1002/smll.201101140 1613-6829 Google Scholar
Y. S. Chenet al.,
“Silica-coated gold nanorods as photoacoustic signal nanoamplifiers,”
Nano Lett., 11
(2), 348
–354
(2011). http://dx.doi.org/10.1021/nl1042006 NALEFD 1530-6984 Google Scholar
N. R. JanaL. GearheartC. J. Murphy,
“Seed-mediated growth approach for shape-controlled synthesis of spheroidal and rod-like gold nanoparticles using a surfactant template,”
Adv. Mater., 13
(18), 1389
–1393
(2001). http://dx.doi.org/10.1002/(ISSN)1521-4095 ADVMEW 0935-9648 Google Scholar
B. NikoobakhtM. A. El-Sayed,
“Preparation and growth mechanism of gold nanorods (NRs) using seed-mediated growth method,”
Chem. Mat., 15
(10), 1957
–1962
(2003). http://dx.doi.org/10.1021/cm020732l CMATEX 0897-4756 Google Scholar
Y.-S. Chenet al.,
“Enhanced thermal stability of silica-coated gold nanorods for photoacoustic imaging and image-guided therapy,”
Opt. Exp., 18
(9), 8867
–8878
(2010). http://dx.doi.org/10.1364/OE.18.008867 OPEXFF 1094-4087 Google Scholar
G. Frens,
“Controlled nucleation for the regulation of the particle size in monodisperse gold suspensions,”
Nat. Phys. Sci., 241 20
–22
(1973). NPSCA6 0300-8746 Google Scholar
S. Mallidiet al.,
“Multiwavelength photoacoustic imaging and plasmon resonance coupling of gold nanoparticles for selective detection of cancer,”
Nano Lett., 9
(8), 2825
–2831
(2009). http://dx.doi.org/10.1021/nl802929u NALEFD 1530-6984 Google Scholar
N. ZengA. B. Murphy,
“Heat generation by optically and therman interacting aggregates of gold nanoparticles under illumination,”
Nanotechnology, 20
(37), 375702
(2009). http://dx.doi.org/10.1088/0957-4484/20/37/375702 NNOTER 0957-4484 Google Scholar
V. P. Zharovet al.,
“Synergistic enhancement of selective nanophotothermolysis with gold nanoclusters: potential for cancer therapy,”
Laser. Surg. Med., 37
(3), 219
–226
(2005). http://dx.doi.org/10.1002/(ISSN)1096-9101 LSMEDI 0196-8092 Google Scholar
S. V. Egerevet al.,
“Pulsed optoacoustic interaction in suspension of gold nanoparticles: detection sensitivity based on laser-induced nanobubbles,”
Proc. SPIE, 5697 73
–81
(2005). http://dx.doi.org/10.1117/12.596925 PSISDG 0277-786X Google Scholar
F. Zhaoet al.,
“Cellular uptake, intracellular trafficking, and cytotoxicity of nanomaterials,”
Small, 7
(10), 1322
–1337
(2011). http://dx.doi.org/10.1002/smll.201100001 1613-6829 Google Scholar
X. Liuet al.,
“Strong size-dependent photoacoustic effect on gold nanoparticles: a sensitive tool for aggregation-based colorimetric protein detection,”
Anal. Meth., 4
(1), 309
–311
(2012). http://dx.doi.org/10.1039/C1AY05497J Google Scholar
|


