|
|
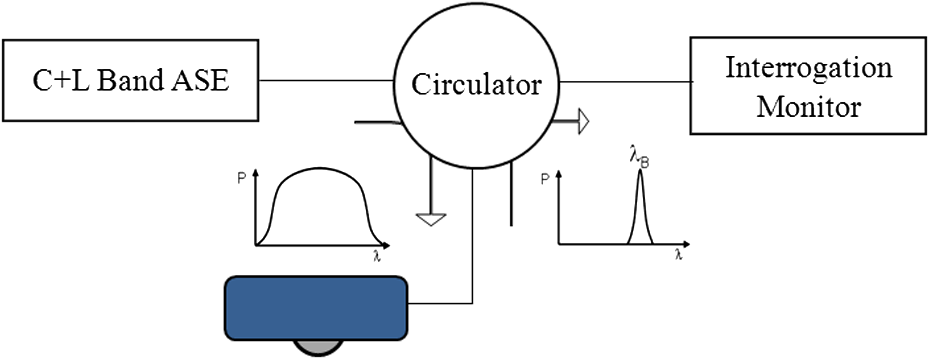
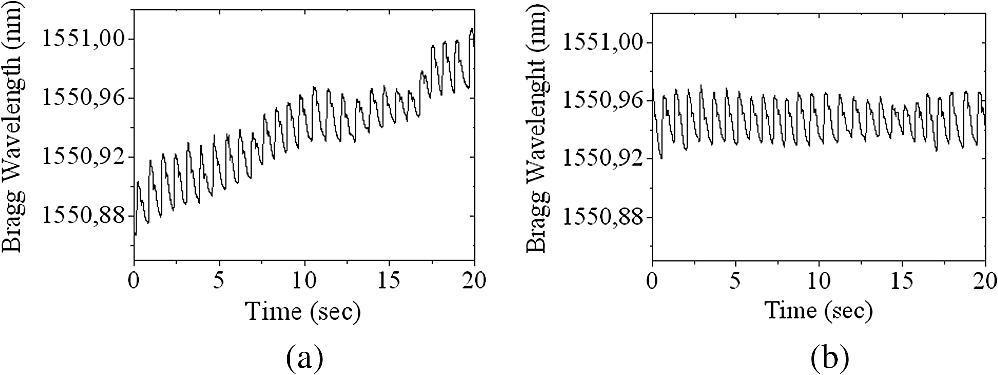
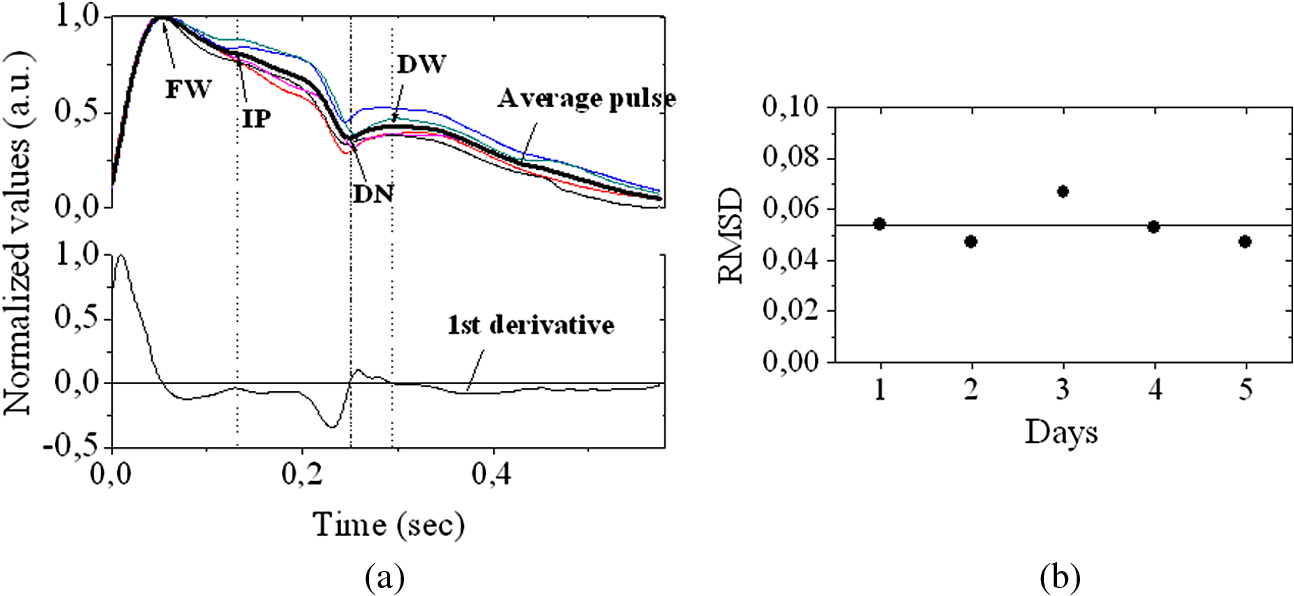
1.IntroductionThe worldwide leading causes of death are from cardiovascular (CV) origin.1 Research is growing in terms of early prevention of such events, with special emphasis for the arterial stiffness evaluation.2 This feature can provide important information about arterial health, more precisely, about the arterial compliance capability. The arterial stiffness can be evaluated by parameters related with the pulse wave propagation in the arterial tree, such as pulse velocity and waveform.3 Stiffer arteries will limit the pulse wave spread and consequently demand an increased effort by the heart. Therefore, it is important to access the central arteries hemodynamic characteristics and the consequent changes in the cardiac output and coronary perfusion.4 1.1.State-of-the-ArtThe most used noninvasive methods to assess arterial elasticity conditions are based in photoplethysmography, ultrasound, and arterial tonometry.3 Photoplethysmography uses infra-red optical signals to measure the volumetric pulsation of the blood flow. Even though being considered the most user-friendly method, this sensor can mainly be applied in the body extremities, like fingers and earlobes.5 Ultrasound systems are also used to record arterial volume changes, being able to monitor the central arteries directly. Even though they are considered the most accurate assessment methods, their main drawbacks are the high expertise technician requirement and constant control of the ultrasound beam direction.6 A third method uses applanation tonometry with piezoresistive pressure sensors, which is performed by placing the sensor over the artery, depressing the sensor to flat the artery.3 To access data the sensor has to be moved until a clear pulse is found and the pressure imposed by the operator has to be carefully determined. An example of the arterial tonometry state-of-the-art is the SphygmoCor (AtCor—Australia) device.3 The main disadvantage of this device is the difficulty to assess the pulse in central arteries, such as the carotid. Usually, obtaining a steady pulse wave is only possible in the radial artery, on which inverse transfer functions are applied to access the central pulse waveform. The use of FBGs in noninvasive CV monitoring is not largely reported. In 2005, A. van Brakel, et al., described a twin Bragg grating Fabry-Perot interferometer as blood pressure manometer used in the radial artery.7 The proposed sensor can be considered a tonometer based on fiber Bragg gratings (FBGs). Having a strain high sensitivity, the FBGs can be an alternative to the present sensors in order to ease the pulse wave acquisition directly in the carotid artery. The presented sensor uses one pretensioned optical fiber with a FBG to detect the pulse waveform through the deformation resulting from the carotid artery micromovements. This paper is organized as follows: after the introduction, the sensor design is presented in Sec. 2, where the sensor calibration and implementation methods are also explained. In Sec. 3 are shown the results obtained in human carotids. Finally, the work main conclusions are presented. 1.2.Carotid Pulse Waveform AnalysisThe central arterial pulse is a combination between the forward wave (FW) created by the left ventricle and its reflection [reflected wave (RF)]. The FW is reflected in arterial impedance mismatches, such as in the transitions between elastic and muscular arteries; in arterial bifurcations; in vasomotor tone and geometry chances of small arteries.3 The carotid pulse waveform (CPW) reproduces the central hemodynamic conditions due to its elastic nature like aorta, and being its first bifurcation. When the central arteries maintain its healthy structure, the pulse wave is spread through the arteries at a low velocity and the reflected wave tends to arrive back in the aorta during the late systole or early diastole. Conversely, in stiff arteries pulse velocity rises and the RW arrives in the central arteries in the early systole adding to the FW, increasing the systolic pressure (SP). The RW effects in the pulse pressure (PP) increasing are usually quantified by the Augmentation Index (AIx), which relates the augmentation pressure (AP) and the PP presented in the Fig. 1.3 Fig. 1Carotid pulse waveform schematics. (F-wave-foot, IP-inflection point; DN-dicrotic notch; DW-dicrotic wave; PP-pulse pressure).  In young subjects the inflection point (IP) occurs after the SP, due to the late arrival of the RW in the central arteries, and the SP is defined by the FW. In this case, the AIx is negative. As shown in Fig. 1, in stiffer arteries the IP occurs before SP as a consequence of an early arrival of the RW overlapping the FW, which is characteristic of a stiffer arterial tree, resulting in positive AIx.3 The early reflection of the pulse wave could be responsible for: (i) central PP increasing and consequent increase of the risk for stroke and renal failure; (ii) load increasing in the left ventricle during systole, which could increase the ventricular mass and lead to hypertrophy and cardiac failure; iii) decreasing of coronary arteries irrigation, increasing the myocardium ischemia and angina risk.8 The AIx has been correlated with several CV conditions, being an important index of CV risk. Previous studies have related the AIx with all-cause mortality in patients with end-stage renal failure, with the degree of coronary artery disease and global CV risk. Moreover, the prognostic value of APW analysis evolution has been studied during anti-hypertensive pharmacological and congestive heart failure treatments.9 Since the elastic arteries suffer more stiffness effects during life, it is crucial to assess the pulse waveform in the central arteries.3 The carotid location was chosen due to its closer location to aorta, presenting the same elastic nature. 1.3.Fiber Bragg Grating TechnologyThe increasing application of optical fiber technology in the sensing field is mainly due to the wide operation range, reduced losses, electrical isolation, wavelength codification (resulting in high signal-to-noise ratio) and immunity to electromagnetic interferences. This last feature is highly desirable in medical devices, allowing the application of these sensors in high electromagnetic fields environments, unlike the electronic sensors, such as found during magnetic resonance imaging medical exams. In this work the sensor is based in an FBG, that can be described as a periodical modulation of the optical fiber core refractive index, with an approximately amplitude of 0.1%. When a spectral wide optical signal is guided through the optical fiber, a consecutive reflection of the signal will occur in the recorded grating. The wavelength, for which all the reflected waves are in phase, is known as the Bragg wavelength (). In a fiber with an effective refractive index in the guided mode, , the Bragg wavelength is given by Ref. 10: where is the grating period. Typically, FBG are designed to a around 1550 nm, the optimum wavelength for propagation in a silica optical fiber, at which the attenuation coefficient is minimum.In the FBG based sensors, the changes of temperature and/or strain applied to the fiber impose a shift of the Bragg wavelength (), represented by Ref. 10: where is the axial strain, along the fiber core and the temperature. The first term represents the strain effect and the second term, the temperature contribution to the Bragg wavelength shift. Since in this work the FBG sensors are used to respond only to strain variations (), and the environmental temperature shift occurs in a long term scale, Eq. (3) can be expressed as:10 being the silica effective photoelastic constant (0.22), and is the axial strain, usually given in (). Therefore, the Bragg wavelength depends linearly with , being the typical strain sensitivity around .10,112.Materials and Methods2.1.Sensor Assembly and Signal DetectionThe used FBG sensors were produced in photosensitive single mode optical fiber FiberCore PS1250/1500. The FBG, with a 4 mm length, was inscribed by an automated phase-mask method, using a UV excimer laser peaking at 248 nm, presenting a Bragg wavelength of 1550.2 nm at 23°C. The proposed sensor consists in a small outer plastic box () crossed by an optical fiber with the FBG placed in the middle. The fiber was pretensioned to become sensitive to elongation and compression. As shown in Fig. 2, a latex membrane was placed between the box and the stainless steel sphere (with a diameter of 9 mm), allowing vertical movements with the carotid arterial distensions. During the acquisition process, the sensor is placed over the carotid artery and the obtained signal is monitored in real time using a computer. Fig. 2Fibre Bragg probe configuration: (a) Schematics; (b) prototype; and (c) placement over carotid artery. 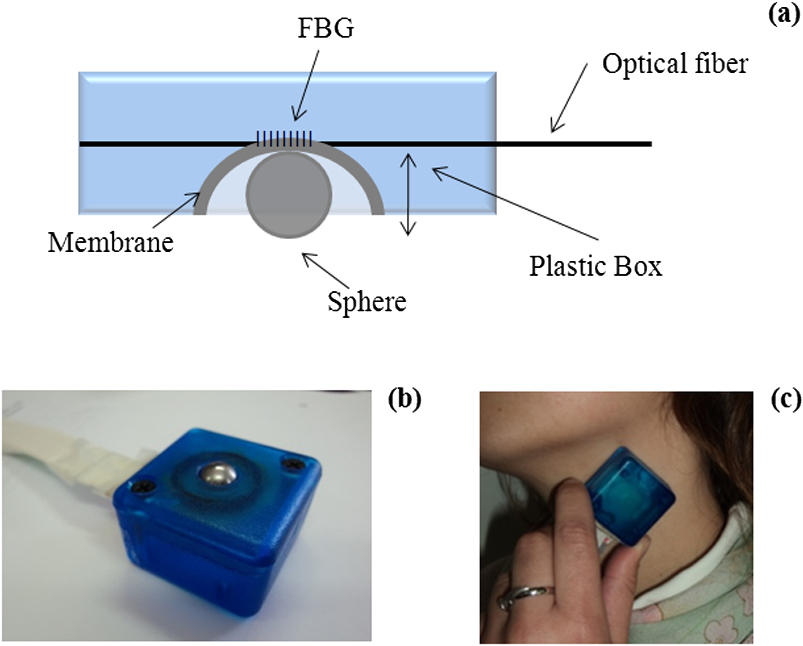 For the sensor interrogation the signal from a broadband optical source, amplified spontaneous emission (ASE) source from Amonics-China, is injected into the optical fiber, reflecting in the Bragg grating, and directed by an optical circulator to an interrogation system as schemed in Fig. 3. The reflected signal was analyzed with the interrogation monitor I-MON 512E-USB from Ibsen-Denmark with an acquisition sampling rate of 950 Hz. 2.2.Sensor CalibrationThe system was calibrated with a controlled vertical movement imposed on the sphere. For this task it was used a micrometric translation stage to displace the metallic sphere simultaneously with the Bragg wavelength monitoring. The sensor response to standard mechanical waveforms created by an arbitrary waveform generator from Agilent Technologies-USA, model 33220A, was studied and used for calibration. The scheme of this setup is shown in Fig. 4. The electric signal from the waveform generator was amplified by a High-Voltage PieZoelecTric (HVPZT) amplifier, model E-508.00 from Physic Instrumente (PI-Germany). The used actuator stage (Z/Tilt Piezoelectric Flexure Stage model P287.70 from PI) was chosen due to its movement range being close to the carotid movements, with a maximum displacement of 700 μm. The sensor was placed with the top of the sphere in contact with the moving part of the flexure stage. The movement of this stage was controlled using several generated waveforms, we only present the sensor response to “type A” and “C” Murgo waveforms.12 The generated pressure waves were monitored with an Oscilloscope from Tektronix-USA, model TK-220. 2.3.Data Acquisition in Human Carotids2.3.1.Signal enhancementThe FBG sensors are sensitive to strain and/or temperature. Temperature effects result in the drifting of the measured signal baseline at very low frequencies and the optical noise usually occurs at much higher frequencies. In the data processing we used a digital filter to minimize both effects, with a clear assessment of the arterial pulse wave important features. The used filter was a bandpass (between 0.7 and 50 Hz) FFT, and all the results here presented were filtered with this method. 2.3.2.Acquisition processThe developed sensor was tested in four human carotids of healthy subjects with an average age of 25 years old (). In the data acquisition the tonometry standard protocol is used, which consists in detecting the carotid pulse by hand and placing the sensor in that location. The recording process begins when a steady pulse is observed. This acquisition process needs some training in the detection of the carotid pulse, as for the common process with the state-of-the-art devices. The acquired data, which corresponds to the sensor Bragg wavelength over time, were filtered and normalized. Repeatability tests were carried out in one subject during five days. The CPW was assessed every day in the same day period and eight consecutive pulses were recorded and analyzed. 3.Results3.1.Sensor CalibrationThe sensor system has a sphere that moves vertically following the carotid distention pattern. The calibration of the sensor response to a controlled vertical movement is shown in Fig. 5. Fig. 5Bragg wavelength variation with the vertical sphere movement. Points are experimental data and line is the linear fit (), , .  The Bragg wavelength dependence with the sphere displacement is described by a linear function, with a fit correlation factor () of 0.98. Considering this approach, the pulse waveform assessed with the sensor is similar to the real pulse waveform, changing only the baseline. Before the developed sensor application in human carotids, its response to a mechanical actuator with a reference pattern was studied. For this test several waveforms were considered, namely for “A” and “C type” waveforms. As it can be seen in Fig. 6, the FBG sensor detects and follows the piezoelectric actuator path, allowing the identification of all characteristic points of the waves, even the ones with relatively low amplitude differences. These results supported the application of this sensor to assess the pulse wave in human carotids. Fig. 6Bragg sensor response of the actuator motion (type A and C patterns, respectively). (Dashed line—actuator motion, full line—sensor response). 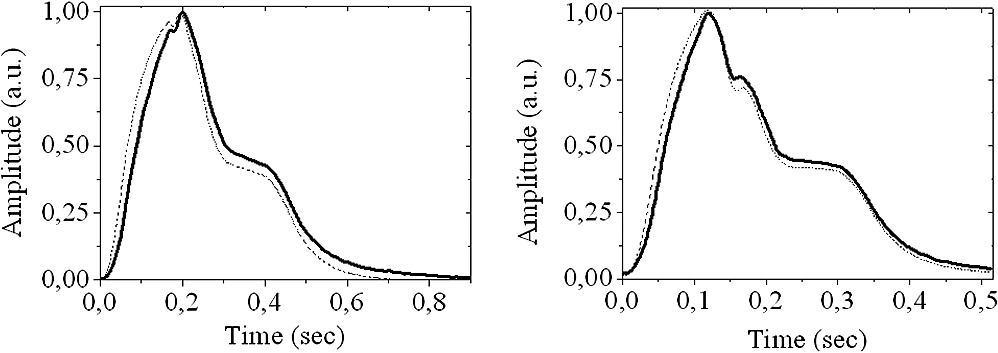 To measure the accuracy of the sensor response, it was considered the root mean square deviation (RMSD) of normalized amplitude measured values, which is given by: where is the number of acquired values, is the normalized measured value and is the normalized reference value. The obtained results were and , for “A” and “C type,” respectively. Although a lower RMSD to “type A” wave was obtained, both values are very close to zero, showing a good response of the sensor in following the actuator motion.3.2.Data ProcessingThe sensor was tested in four subjects named as subjects I, II, III and IV. In Fig. 7 it can be seen the raw and filtered data acquired in subject I. This data demonstrates that the applied FFT filter reduces substantially the increasing tendency of the signal, which was due to temperature changes in the sensor when placed in contact with the skin. From the filtered data, 10 consecutive pulses were selected and normalized. From these pulses an average pulse is calculated, which can be analyzed in terms of temporal and amplitude characteristics. In Fig. 8, 10 cycles of the processed data acquired in the four subjects are presented. It can be seen that for the same subject the wave pattern is similar in time. For all subjects, the five relevant identification points of the PP wave in the carotid artery were calculated with the 1st derivative of the average pulse wave. The subjects I, III, and IV presented type C waves, corresponding to negative , with values of ; and . The subject II had a slightly positive . All subjects had a unique identification curve, presenting different values. In the Fig. 9 it can be seen the RMSD of each pulse related to the maximum deviation. Small deviations between pulses can be observed with values never reaching a 10% deviation. Finally, repeatability tests were carried out with subject IV, in five consecutive days, within the same data acquisition period. The preliminary repeatability tests are presented in Fig. 10. Each graphic represents eight periods of the accessed waveforms. It can be seen that a low noise pulse wave was detected with a clear distinction of the identification points of the CPW. As previously done, the average pulse for each day was calculated [Fig. 11(a)] as well as the corresponding average pulse for the five days, presenting a value of for the week.13 As expected, this value is close to the value assessed earlier for the same subject (), showing a good repeatability with a maximum RMSD of 7% [Fig. 11(b)]. 4.ConclusionsIn this study we report the use of a FBG based optical fiber sensor to assess the carotid pulse waveform. The high sensitivity of FBG can impose these sensors as a valuable technology to assess the pulse waveform in human carotids, with the advantages offered by the optical technology over the traditional sensors. The carotid distension movements’ transfer to the FBG was fulfilled by the use of a compact metallic sphere. The sensor response data are in good agreement with the controlled imposed actuator motion data. After calibration it was possible to obtain the pulse waveforms in the four volunteers, each one having their own pulse waveform type. It was possible to identify the five CPW identification points. The obtained AIx values were between and 0.04. The tests in five consecutive days showed good repeatability and deviation with an average RMSD of 0.53. This work delivered promising results for the application of FBG technology in the pulse wave acquisition. The developed sensor seems to be a valid alternative to electromechanical tonometer. Further developments will be focused in the direct comparison of the developed system with a state-of-the-art device and with a more diverse population. AcknowledgmentsThis work has been financially supported by FCT (Portugal), through PTDC/SAU-BEB/100650/2008 and Pest-C/CTM/LA0025/2011. Cátia Leitão also acknowledge the financial support through the Doctoral fellowship SFRH/BD/84076/2012 and Lúcia Bilro, Nélia Alberto and Paulo Antunes the Postdoctoral fellowships SFRH/BPD/78205/2011, SFRH/BPD/78141/2011 and SFRH/BPD/76735/2011, respectively. The authors gratefully acknowledge all the support by Group of Electronic and Instrumentation (GEI) of the Physics Department of University of Coimbra and Hospital Infante D. Pedro (Centro Hospitalar do Baixo Vouga). ReferencesWorld Health Organization, World Heart Federation and World Stroke Organization, “Global atlas on cardiovascular disease prevention and control,”
(2011) http://www.who.int/cardiovascular_diseases/en/ (accessed September ). 2011). Google Scholar
M. O’RourkeM. SafarV. Dzau,
“The cardiovascular continuum extended: aging effects on the aorta and microvasculature,”
Vasc. Med., 15
(6), 461
–468
(2010). http://dx.doi.org/10.1177/1358863X10382946 VMEREI Google Scholar
S. Laurentet al.,
“Expert consensus document on arterial stiffness: methodological issues and clinical applications,”
Eur. Heart J., 27
(21), 2588
–2605
(2006). http://dx.doi.org/10.1093/eurheartj/ehl254 EHJODF 0195-668X Google Scholar
J. J. OliverD. J. Webb,
“Noninvasive assessment of arterial stiffness and risk of atherosclerotic events,”
Arteriosclerosis Thromb. Vasc. Biol., 23
(4), 554
–566
(2003). http://dx.doi.org/10.1161/01.ATV.0000060460.52916.D6 ATVBFA 1079-5642 Google Scholar
S. C. Millasseauet al.,
“Contour analysis of the photoplethysmographic pulse measured at the finger,”
J. Hypertension, 24
(8), 1449
–1456
(2006). http://dx.doi.org/10.1097/01.hjh.0000239277.05068.87 JOHYD3 0263-6352 Google Scholar
J. M. MeindersA. P. G Hoeks,
“Simultaneous assessment of diameter and pressure waveforms in the carotid artery,”
Ultrasound Med. Biol., 30
(2), 147
–154
(2004). http://dx.doi.org/10.1016/j.ultrasmedbio.2003.10.014 USMBA3 0301-5629 Google Scholar
A. van Brakelet al.,
“Blood pressure manometer using a twin Bragg grating Fabry-Perot interferometer,”
Proc. SPIE, 5634 595
–602
(2005). http://dx.doi.org/10.1117/12.577035 Google Scholar
T. Weberet al.,
“Arterial stiffness, wave reflections, and the risk of coronary artery disease,”
Circulation, 109
(2), 184
–189
(2004). http://dx.doi.org/10.1161/01.CIR.0000105767.94169.E3 CIRCAZ 0009-7322 Google Scholar
M. F. O’RourkeA. PaucaX.-J. Jiang,
“Pulse wave analysis,”
Brit. J. Clin. Pharmacol., 51
(6), 507
–522
(2001). http://dx.doi.org/10.1046/j.0306-5251.2001.01400.x BCPHBM 0306-5251 Google Scholar
P. Antuneset al.,
“Elastic constant measurement for standard and photosensitive single mode optical fibres,”
Microwave Opt. Technol. Lett., 50
(9), 2467
–2469
(2008). http://dx.doi.org/10.1002/mop.v50:9 MOTLEO 0895-2477 Google Scholar
A. OthonosandK. Kalli, Fiber Bragg Gratings: Fundamentals and Applications in Telecommunications and Sensing, Artech House, Boston
(1999). Google Scholar
J. Murgoet al.,
“Aortic input impedance in normal man: relationship to pressure wave forms,”
Circulation, 62
(1), 105
–116
(1980). http://dx.doi.org/10.1161/01.CIR.62.1.105 CIRCAZ 0009-7322 Google Scholar
C. Leitaoet al.,
“Development of a FBG probe for non-invasive carotid pulse waveform assessment,”
Proc. SPIE, 8427 84270J
(2012). http://dx.doi.org/10.1117/12.923560 PSISDG 0277-786X Google Scholar
|