|
|
|
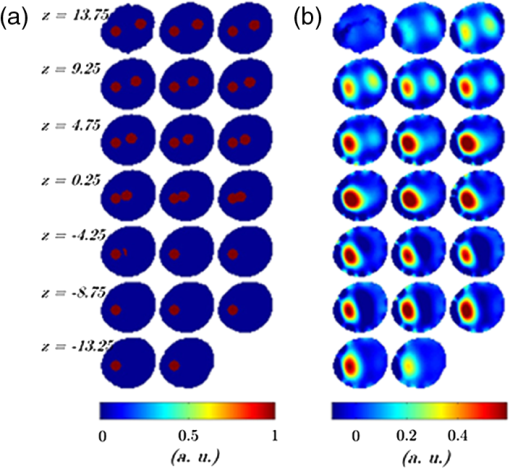
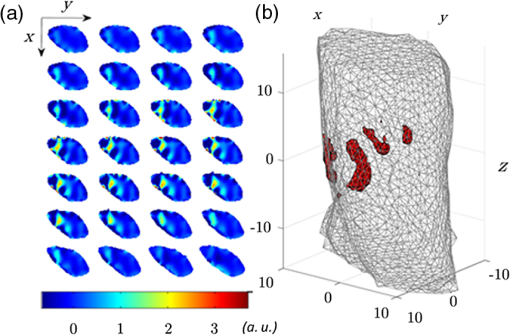
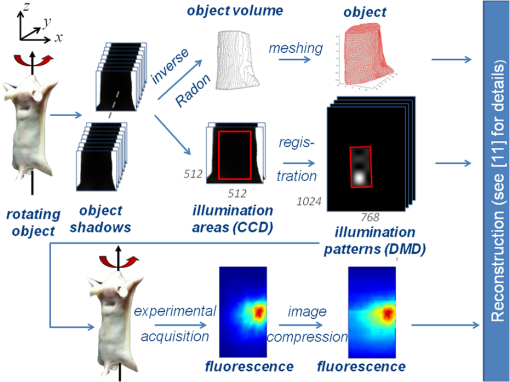
Optical molecular imaging is an emerging technique that relies on smart probes with high affinity for specific biomolecules to visualize molecular processes in living organisms.1 While the sensitivity of optical molecular imaging is very high, spatial resolution is limited due to the light scattering of biological tissue. Notwithstanding this physical constraint, fluorescence molecular tomography (FMT), by modeling light scattering in biological tissues, allows one to localize and quantify the three-dimensional (3-D) distribution of specific fluorochromes in small animals, e.g., mice.2 The basic scheme of FMT requires one to illuminate the sample with near infrared light and to acquire the fluorescence signal exiting the sample. Then, by solving an inverse problem, the fluorochrome concentration in all the voxels of the sample can be reconstructed. In order to increase the information content of the acquired data set, a strategy consisting in dense raster-scanning of the excitation light and oversampling of the fluorescence signal all over the animal surface is generally adopted. It is worth stressing that both the position/shape of the inclusion and fluorochrome concentration are biologically relevant, e.g., for tumor localization and to visualize the expression and the activity of specific molecules, respectively, and the two aspects are inherently interlinked; in fact, the quantification capability of FMT strongly depends on its spatial resolution. Recent technological developments have made available high performance detection systems, which allow one to acquire a huge amount of data, such as fluorescence intensity, spectra, polarization state and lifetime. Since much of this data is redundant, there is a need for the optimization of the acquisition and reconstruction schemes, in order to preserve the data information content, while reducing both acquisition and processing time. It is worth stressing that this represents a fundamental step towards the routine use of FMT in biological laboratories. In the last few years, different research groups have proposed the use of wide-field structured illumination3–7 and/or image compression8–10 to strongly reduce the size of the data set. Both approaches share the same physical basis: they assume that biological tissue behaves as a low pass filter for the propagation of spatial frequencies. In particular, the authors have proposed a rotating view, i.e., fully tomographic, FMT scheme based on compression in both illumination and detection spaces with well-chosen wavelet bases. This approach was recently experimentally demonstrated on a cylindrical phantom.9 In this work, we generalize this novel scheme and experimentally demonstrate its applicability to a murine model. To the best of our knowledge, this is the first time that FMT based on a rotating-view scheme and compression of the illumination and detection spaces has been applied to an animal model. Moreover, we present the significant upgrades of the experimental procedure necessary to deal with rotating arbitrary geometries, such as the case with animals. The experimental set-up basically consists of an illumination and detection system. The illumination system is based on a laser diode emitting at 630 nm with a power , a digital micromirror device (DMD) to create the pattern, and an objective lens to project the selected pattern on the sample surface. The detection system consists of a low noise 16-bit cooled charge-coupled device (CCD) camera, which allows one to acquire the light exiting from a large area of the sample surface at the fluorescence and excitation wavelength, according to the detection filter. The sample is placed on a rotational stage to acquire the signal from multiple views. A more detailed description of the set-up can be found in Ref. 11. Measurements have been carried out on both biological tissue mimicking phantoms and an ex vivo nude mouse. The phantom is an epoxy resin cylinder with elliptical section (longer axis 22.4 mm, shorter axis 19.9 mm, height 45 mm, , and ) with 2 cylindrical holes filled with Nile Blue dye at a concentration of 30 μM, shown in Fig. 1. The mouse was euthanized and gently tied to a frame and held in vertical position. Then, a cylindrical inclusion (2 mm , 10 mm long) filled with a diluted solution of Nile Blue was inserted in the abdomen by microsurgery, beneath the muscular layers. The position of the inclusion is approximately known from the surgery sign and mouse anatomical atlas. Fig. 1(a) Phantom concentration. (b) Reconstructed concentration, using 12 views with a step of 30 deg and 8 patterns per view. Slices are displayed every 1.5 mm from to . Concentrations are given in arbitrary units.  The scheme of the experimental and reconstruction procedures is shown in Fig. 2. Dealing with irregular/asymmetric shapes as in the case of animals, a light propagation model for such geometries is required and two specific problems have to be faced. The first issue consists of obtaining the object volume to be meshed and provided to the propagation model. The second issue consists of determining the portion of the surface that should be illuminated for each view of the object. The two problems can be addressed optically using the described system based on DMD and CCD. It is worth stressing that, even if other methods12 can be used to acquire the shape of the object, the proposed method is extremely effective because it does not require any extra device. First, the animal was illuminated by a wide field beam larger than the object and its shadow is acquired at a fine step angle, typically 1 deg. By applying the inverse Radon transform on the stack of shadows, the 3-D volume of the sample could be reconstructed. The whole procedure requires the sample to be convex along the rotational plane (, ). This condition can be satisfied by limiting the measurement volume to the thorax and the abdomen. Then, the 3-D volume was used for creating a mesh of tetrahedral finite elements. In this work the iso2mesh mesh generation toolbox has been used.13 The selection of the area to be illuminated for each of the views used for fluorescence measurement requires special care and an adaptive approach. In fact, considering a wide area generally leads to very high transmitted intensity at the excitation wavelength close to the outline of the mouse body where the tissues are thinner. This leads to the saturation of the camera and, hence, to a poor exploitation of its dynamic range. On the other hand, a small illumination area reduces the total excitation power and diminishes the effectiveness of the structured light approach. In practice, the shadow images corresponding to the desired views were segmented, e.g., by applying a threshold, to recover the area corresponding to the animal position. The largest rectangle inscribed within the obtained area was retained as the illumination area. In a second phase, fluorescence measurements were carried out at 8 different views taken at steps of 45 deg using several illumination patterns, typically 8, for each view. In particular, Haar wavelets patterns were chosen and mapped within each of the rectangular illumination areas previously obtained. The measured fluorescence images were compressed to a few relevant components, here 128 components per image in a Daubechies D4 basis, for both speeding up reconstruction and limiting memory requirement without sacrificing reconstruction quality. In order to increase the spatial resolution of the reconstruction, the virtual source approach was adopted.11 It basically consists in using a linear combination of illumination patterns, and the related fluorescence images, to recreate the response to both positive and negative illuminations. As a first step of reconstruction, the sensitivity matrix (Jacobian) is computed by multiplying together direct photon density fields for the illumination patterns and adjoint fields for the wavelet detection patterns. Next, the reconstructed fluorochrome distribution is obtained from a Tikhonov-regularized linear reconstruction step that involves the measured data and the sensitivity matrix. The details of the reconstruction algorithm are provided in Ref. 11. In order to quantify the performance of the system, preliminary measurements have been carried out by rotating the elliptical phantom about 5 mm off axis. Both conditions (non symmetric shape and off-axis rotation) have been chosen to recreate more realistic circumstances compared to simple cylindrical phantoms. Fluorochrome reconstruction, shown in Fig. 1, has been carried out by using 12 views with steps of 30 deg and eight illumination patterns for each view. The mesh of the phantom, which consists of 13,174 nodes and 78,113 elements, has been obtained in less than a minute. The generation of the illumination patterns adapted to the different views required about 2 min. The regular grid chosen for reconstruction has a voxel size of . Good fidelity concerning the localization and dimensions of the inclusions can be observed. Considering the slice at , the reconstructed sections of the fluorescent inclusions have a full-width-half-maximum (FWHM) radius of about 2.3 and 2.6 mm, for left and right tube, respectively. These values compare well to the real size of 1.5 mm. Moreover, the distance between the centers of the two inclusions is about 10.3 mm in good agreement with the true value of 9.4 mm. In order to quantify the reconstruction quality, we computed the performance metrics of reconstruction error () and contrast-to-noise ratio (CNR) previously used for reconstruction on a cylindrical phantom rotating on axis.11 We obtained an of and a CNR of 2.18. Both results are comparable with the values obtained in the cylindrical case.11 In order to further reduce the dimension of the data set, the reconstruction has been repeated by using only six views with a step of 60 deg, and a similar reconstruction error of -10.6 dB and CNR of 1.98 have been obtained. Following the results on phantoms and previous work,11 mouse measurements have been carried out considering eight views with a step of 45 deg and eight illumination patterns for each view. The mesh consisted of 13,452 nodes and 80,361 elements and was computed in about 90 s. The generation of the illumination patterns that are adapted to the desired eight views has required about 2 min. The regular grid chosen for reconstruction has a voxel size of . Figure 3 shows the fluorochrome reconstruction for the murine model. Fig. 3Fluorochrome reconstruction of murine model considering 8 views and 8 illumination patterns per view. (a) 28 slices are displayed every 0.75 mm along , from to . (b) 3-D rendering showing the isovolume at 35% of the maximum concentration value. Concentrations are given in arbitrary units.  The fluorescent inclusion can be well localized in the abdominal region. To quantify its dimensions, we first estimated the position of the center of the reconstructed inclusion. It is found to be at , , and . Next, the sections of the reconstructed inclusion are measured in the slice at . A FWHM of 4.9 mm is obtained along the -axis and of 3.2 mm along the -axis. The length of the reconstructed inclusion is measured the same way along the -axis and a FWHM of 10.5 mm is obtained. Both sections and length show a good agreement with the actual dimensions, 2 and 10 mm, respectively. Artifacts are observed on the surface of the animal, which is a recurring issue that can be alleviated by regularizing with spatial priors.14 Nevertheless, the main artifacts are confined to the animal surface, while the biological structures of interest are expected deeper in the tissue. Finally, it is worth discussing the acquisition and reconstruction times. The whole data set used for mouse reconstruction consists of 64 fluorescence images (). The acquisition time for each fluorescence image is 20 s, resulting in a total acquisition time of about 21 min. The reconstruction time, by using a personal computer with a 2.4 GHz processor and 4 gigabytes RAM, is about 2 min. The measurements reported in this paper have been carried out by using a laser power which is well below the maximum permissible exposure (MPE) for the skin, which is according to IEC60825 (Ref. 15). One relevant advantage of using a wide-field illumination scheme is represented by the possibility to significantly increase the illumination power, while preserving the power density below the safety limits. By assuming a 10- to 50- fold possible increase of the laser power, an analogous reduction in the acquisition time is expected. In conclusion, an FMT scheme based on structured-light and rotating-view acquisition has been experimentally demonstrated on a mouse. By exploiting structured light and image compression techniques, the acquisition and reconstruction times have been drastically reduced while preserving the spatial resolution of the reconstruction. Future work will be devoted to further reduce the measurement and processing time by improving the light delivery system and using parallel algorithms. Moreover, the experimental setup will be redesigned in order to keep the mouse lying horizontal and to avoid the rotation of the animal. Another important aspect is represented by the selection of the number of views and illumination patterns in order to reduce the acquisition time and increase the spatial resolution. Both parameters depend on several factors such as the geometry/dimensions of the object and optical properties, hence an adaptive approach tailored on the specific sample should improve the performance of the system. AcknowledgmentsThis work was partially supported by MIUR under the project Futuro in Ricerca (RBFR08XH0H 002) and Royal Society International Joint Project 2009/R2. ReferencesS. R. Cherry,
“In vivo molecular and genomic imaging: new challenges for imaging physics,”
Phys. Med. Biol., 49
(3), R13
–R48
(2004). http://dx.doi.org/10.1088/0031-9155/49/3/R01 PHMBA7 0031-9155 Google Scholar
V. NtziachristosC. BremerR. Weissleder,
“Fluorescence imaging with near-infrared light: new technological advances that enable in vivo molecular imaging,”
Eur. Radiol., 13
(1), 195
–208
(2003). http://dx.doi.org/10.1007/s00330-002-1524-x EURAE3 1432-1084 Google Scholar
V. A. MarkelJ. C. Schotland,
“Symmetries, inversion formulas, and image reconstruction for optical tomography,”
Phys. Rev. E, 70
(5), 056616
(2004). http://dx.doi.org/10.1103/PhysRevE.70.056616 PLEEE8 1063-651X Google Scholar
D. J. Cucciaet al.,
“Modulated imaging: quantitative analysis and tomography of turbid media in the spatial frequency domain,”
Opt. Lett., 30
(11), 1354
–1356
(2005). http://dx.doi.org/10.1364/OL.30.001354 OPLEDP 0146-9592 Google Scholar
C. D'Andreaet al.,
“Fast 3D optical reconstruction in turbid media using spatially modulated light,”
Biomed. Opt. Express, 1
(2), 471
–481
(2010). http://dx.doi.org/10.1364/BOE.1.000471 BOEICL 2156-7085 Google Scholar
V. Venugopalet al.,
“Full-field time-resolved fluorescence tomography of small animals,”
Opt. Lett., 35
(19), 3189
–3191
(2010). http://dx.doi.org/10.1364/OL.35.003189 OPLEDP 0146-9592 Google Scholar
A. JoshiW. BangerthE. M. Sevick-Muraca,
“Non-contact fluorescence optical tomography with scanning patterned illumination,”
Opt. Express, 14
(14), 6516
–6534
(2006). http://dx.doi.org/10.1364/OE.14.006516 OPEXFF 1094-4087 Google Scholar
T. J. RudgeV. Y. SolovievS. R. Arridge,
“Fast image reconstruction in fluorescence optical tomography using data compression,”
Opt. Lett., 35
(5), 763
–765
(2010). http://dx.doi.org/10.1364/OL.35.000763 OPLEDP 0146-9592 Google Scholar
N. Ducroset al.,
“Multiple-view fluorescence optical tomography reconstruction using compression of experimental data,”
Opt. Lett., 36
(8), 1377
–1379
(2011). http://dx.doi.org/10.1364/OL.36.001377 OPLEDP 0146-9592 Google Scholar
J. Ripoll,
“Hybrid Fourier-real space method for diffuse optical tomography,”
Opt. Lett., 35
(5), 688
–690
(2010). http://dx.doi.org/10.1364/OL.35.000688 OPLEDP 0146-9592 Google Scholar
N. Ducroset al.,
“A virtual source pattern method for fluorescence tomography with structured light,”
Phys. Med. Biol., 57
(12), 3811
–3832
(2012). http://dx.doi.org/10.1088/0031-9155/57/12/3811 PHMBA7 0031-9155 Google Scholar
F. ChenG. M. BrownM. Song,
“Overview of three-dimensional shape measurement using optical methods,”
Opt. Eng., 39
(1), 10
–22
(2000). http://dx.doi.org/10.1117/1.602438 OPEGAR 0091-3286 Google Scholar
Q. Fang,
“iso2mesh: a 3D surface and volumetric mesh generator for MATLAB/Octave,”
(2010) http://iso2mesh.sourceforge.net March ). 2010). Google Scholar
P. K. Yalavarthyet al.,
“Weight-matrix structured regularization provides optimal generalized least-squares estimate in diffuse optical tomography,”
Med. Phys., 34
(6), 2085
–2098
(2007). http://dx.doi.org/10.1118/1.2733803 MPHYA6 0094-2405 Google Scholar
“Safety of laser products,”
54
(2001). Google Scholar
|


