|
|
1.IntroductionExtracorporeal circulation (ECC) is mainly applied in cardiopulmonary bypass, extracorporeal membrane oxygenation, and hemodialysis. Usually, during ECC, blood samples are drawn intermittently and analyzed by a blood gas analyzer. Major problems associated with this intermittent sampling are: (1) high cost of the blood gas analyzer and required reagents thus analyses are often performed only after adverse events; (2) there is a risk of blood loss and infection; and (3) therapeutic response can only be made after a delay. Considerable spontaneous variability in blood gases and other quickly changing analytes that occur during ECC require clinical decisions made on the basis of trends observed with continuous monitoring. Usually, the information of interest includes hemoglobin saturation, hematocrit, blood gases (, ), pH, electrolytes (, , , ), certain metabolites (glucose, lactate, urea, creatinine), and physical measurands (temperature, pressure, flow). Several sensors capable of continuously monitoring these parameters have been so far proposed.1,2 Nevertheless, despite tremendous technological efforts, the proposed technologies are not yet sufficiently reliable and economic to be used routinely in ECC and frequent intermittent measurements made by a blood gas analyzer near the bedside are still the standard practice. Since ECC through flow cuvettes offers a perfect optical access to circulating blood, several optical approaches have been considered,3–9 and few commercial optical continuous intravascular blood gas monitoring devices are nowadays available: Paratrend () for adults and Neotrend (NT) for newborns, both based on optical absorption and reflectance methods.10 However, they have been rarely used due to their instability and inaccuracies.11,12 In ECC, haematic pH is one of the most interesting blood parameter. pH, in fact, is strongly related to the functioning of important organs such as lung, heart, liver, and kidney. The haematic pH, in healthy human beings, is always between 7.30 and 7.45, thanks to the bicarbonate buffering system. Nevertheless, a little variation of pH can produce great damages for the body. Many efforts have been spent on the development of pH sensors to be applied in ECC. Continuous blood pH measurements can be made potentiometrically via ion-selective electrodes or transistors. These devices are based on ionophores that may leach out of the ion-selective membranes, thus resulting in lower stability and short lifetime.13 This stability issue limits the use of ion-selective electrodes or transistors in ECC. Attempts to use electrochemical sensors were hampered by protein deposition on the active or reference electrodes that prevents their use unless regular recalibration.2 While promising, none of these methods are suitable for continuous monitoring in ECC. As for the other quantities of interest in ECC, there has been considerable interest in optical methods of determining pH. In literature, proposed pH sensors are mainly based on the immobilization of pH-sensitive absorbing dyes14–16 or fluorophores17,18 on a solid substrate. One of the major limitation of such a sensor is still the dye leaching into blood,19 that, besides problems related to signal stability, can represent a risk for the patient, if the dye is toxic. A further disadvantage of the sensors based on fluorophores is their propensity for photobleaching.19 For all these reasons, while many pH optical sensors have been proposed for continuous pH monitoring, in vivo results have not been reported so far. In the present study, we use a novel pH sensor based on a polymeric sensing substrate, directly in contact with the blood, encapsulating the pH-indicator.20 The pH-sensitive fluorophore is the fluorescein -methacrylate 97%, which can be covalently linked to the polymeric sensing element. This sensing approach offers several advantages: (1) simple fabrication and low-cost, thus the sensing element is disposable; (2) thanks to the covalent link, minimal leaching of the fluorophore into the blood; (3) biocompatibility (fluorescein is used in several medical practises, e.g., fluoroangiography); and (4) mechanical robustness. The interrogation optical head was realized using a low-cost light source [light-emitting diode (LED)] and two photodiodes, to monitor both the power emitted by the LED and the fluorescence signal emitted by the sensing element. Fluorophores photobleaching was compensated by proper modulation of the optical source.21 Whole blood was used in this work to demonstrate the monitoring performances both in vitro and ex vivo experiments over long periods. In the next section a brief introduction of the principle of measurement is given whereas the optical transducer, flow cuvette and the electronic circuitary are described in the first paragraph of Sec. 3. Sections 3.3, 3.4, and 3.5 deal with the description of the experimental setup and the measurement procedure, while the results of the sensor characterization, both in vitro and in ex vivo are reported in Sec. 4. Finally, conclusions are drawn and discussed in Sec. 5. 2.Theoretical BackgroundThe proposed sensing approach consists in the fluorometric determination of pH.22 Fluorescence measurements of pH are based on the detection of the concentration of the acid and base forms of the fluorophore and are not related to activity of the hydrogen ions as in potentiometric pH determinations. However, the unknown ionic strength of the sample affects the equilibrium constant, and hence the pH calculated from the measured degree of dissociation of the indicator. Thus this approach requires a proper calibration procedure. It is already known that fluorescence intensity of fluorescein molecule is dramatically reduced at acidic pH when excitation is performed at 490 nm.23 In particular, as discussed in the next section, we deploy the pH-dependency of the emission spectra of the fluorescein -methacrylate 97%. The response curve of this sensing approach derives from the mass-action law relationship between pH and radiation intensity.24 Considering the free dye, if the fluorescence intensity of the fully protonated system is and assuming equal to the fluorescence contribution of the deprotonated system, the intensity of fluorescence emission in the presence of the sample under test is then converted to pH, by the relation:25 where is the acid-base constant of the indicator, is the excitation light intensity, and is equal to . It has to be noticed that the parameters , , and are insensitive to possible small fluctuations of the excitation light intensity. Considering the dye covalently linked to the polymer matrix, Eq. (1) is modified25,26 and become: where is a numerical coefficient, introduced to determine the slope of the function between and . In fact, the chemical and physical properties of the matrix encapsulating the dye (e.g., polarity and viscosity) could affect its sensitivity near the , thus having different slopes for the same indicator in different matrices. Rewriting Eq. (2) in terms of , gives the well-known sigmoidal function:26The pH of blood is related to the constituents of the bicarbonate buffer system by the modified Henderson-Hasselbalch equation:27 where is the acid dissociation constant of the carbonic acid, which is equal to 6.1, is the concentration of bicarbonate in the blood, and is the concentration of carbonic acid in the blood. Considering the partial pressure of carbon dioxide, , rather than , Eq. (4) can be written as:Equation (5) provides a pH value for healthy human beings between 7.30 and 7.45. These pH values are very close to the of our sensing membrane, i.e., , thus the argument of the logarithmic function in Eq. (2) is close to one. According to the first-order Taylor polynomial of the logarithmic function, the approximation of Eq. (2) is: Since pH values are very close to the of our sensing membrane, i.e., , the term is close to zero. According to the first-order Taylor polynomial of the rational function, Eq. (6) can be rewritten as:Rewriting Eq. (8) in terms of , it gives: where3.Materials and MethodsThe measuring device and the experimental setups have been developed to evaluate the approach under in vitro conditions on fresh cow blood and ex vivo via monitoring of blood pH in animal models, i.e., a pig and a sheep, undergoing surgery with ECC. 3.1.Optical Transducer and Flow CuvetteAs schematically shown in Fig. 1, the optical transduction of the pH value is based on the fluorescence of a polymeric film directly in contact with the blood flowing in the ECC. Fig. 1Schematic representation of the measurement principle. A polymeric sensing matrix, placed in the flow cuvette directly in contact with the blood, is interrogated by the optical head properly driven by the electronic circuitry.  Through an optical head, the fluorescein is excited and the emitted fluorescence signal is collected; finally, a driver, front-end, and signal processing electronics drives the excitation light source and acquires the information of interest. The polymeric sensing matrix is one of the most important element of the sensor, since it is directly in contact with the blood. So it needs high mechanical strength, but, at the same time, it has to guarantee a fast mass transfer, and in particular penetration of hydrogen ions, in order to improve the response time. Finally, it has to be characterized by a low dye leaching. A hydrophilic polymer has been chosen as the matrix, and it has been realized using hydroxyethyl methacrylate (HEMA) which is biocompatible, and it is characterized by a good thermodynamic affinity with water.28 Moreover, in order to improve the mechanical strength and to avoid a too high swelling, comonomers with functionality four have been added. In particular, a reactive divinyl terminated polyether macromer has been used to increase the chain mobility within the polymer matrix, thus to improve the response time. The fluorescein -methacrylate 97% is used as the indicator. Since it contains an acrylate group, it is able to covalently link to the polymeric matrix, thus avoiding the dye leaching. The polymeric solution is deposited on polyvinyl chloride (PVC) round substrates and is photopolymerized in an ultra violet (UV)-oven. A picture of the polymeric sensing element, placed in a flow cuvette, is shown in Fig. 2. The polymeric sensing element is interrogated by an optical head, which has to excite the fluorescein, to collect the fluorescence signal and to monitor the power of the light source. Since the fluorescein -methacrylate is characterized by an excitation spectrum centered at the wavelength of about , a blue LED () has been used to excite it. Moreover, two photodiodes have been used as photodetectors, one to collect the fluorescence signal and one to monitor the optical power emitted by the LED, thus avoiding the influence of fluctuations of the optical power of the LED. Finally, as usual in fluorescence measurements, two optical filters have been used; in particular, an excitation filter (low-pass filter, ) on the light path of the excitation beam and an emission filter (bandpass filter, ) on the light path of the fluorescence signal. A schematic representation and a picture of the optical head are shown in Fig. 3. Fig. 3Schematic representation (a) and a picture (b) of the optical head. It consists of a blue LED, two photodiodes (to monitor the power emitted by the LED and to collect the fluorescence signal), and finally two optical filters: an excitation filter on the light path of the excitation beam and an emission filter on the light path of the fluorescence emission beam. 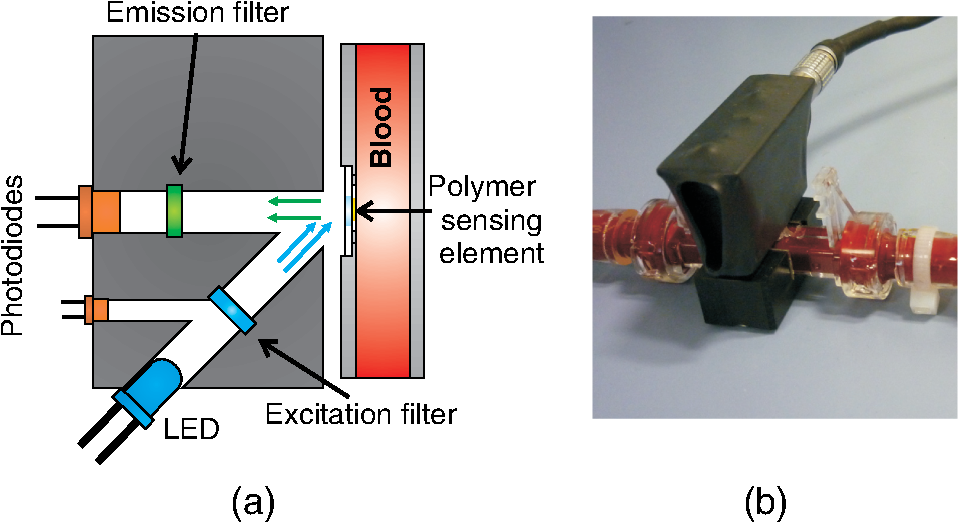 3.2.Driving Electronics and Analog Signal Processing CircuitryThe operation of the measuring device is based on the electronic circuitry for exciting the blue LED and conditioning the signals provided at the photodiode detectors output. According to our previous paper,21 the blue LED is excited by current pulses (duration 800 ms) at a frequency of 0.125 Hz. During the pulse the current was modulated sinusoidally at a frequency of 6.06 kHz. This double modulation allows us to reduce the effects of photobleaching21 and improve the signal-to-noise ratio operating a proper demodulation of the photodetectors output. The front-end electronics consists in two channels devoted to the processing of the monitor and fluorescence photogenerated current signals. Each channel includes: (1) a low-noise transimpedance preamplifier; (2) a high-Q bandpass filter with center frequency at 6.06 kHz; (3) a lock-in amplifier; (4) a lowpass filter with a 70-Hz passband cutoff, and (5) an analog-to-digital converter. Figure 4 shows the block diagram of the electronics and two pictures of the measuring system including the optical head. 3.3.Regression Modelhas been estimated by the voltage ratio, , between the signals generated by the front-end electronics, i.e., and . Since the proportionality coefficient between and and parameters and in Eq. (9) are unknown, the relationship between pH and was determined using a linear regression model. Starting from Eq. (9), we introduced two regression coefficients and calculated through a least squares method relating the values of and the actual pH values measured by the blood gas analyzer according to the regression model: This linear approximation is considered to be valid in the pH range of interest (RoI) (6.9 to 8). 3.4.Experimental Protocol for In Vitro TestFigure 5 shows the mock system assembled to simulate the blood condition during ECC. It consists of: (1) a centrifugal pump, capable of guaranteeing a flux up to ; (2) a heat exchanger based on the Peltier effect (temperature ranging 15°C to 39°C); (3) an oxygenator; and (4) an arterial/venous bubble filter. The whole circuit volume, including the centrifugal pump, the heat exchanger, the oxygenator, the arterial-venous bubble filter and the tubing set is 760 ml. The flow cuvette was positioned in the tubing connecting the filter and the reservoir, on the arterial line. The optical probe was fixed to the flow cuvette according to the setup shown in Fig. 3, and the fuorescence and monitor signals were collected and analyzed by the front-end electronics that generates . A constant blood flow () was maintained throughout the experiments. Blood samples were obtained from the extracorporeal line close to the flow cuvette (sampling valve). The protocol described above was repeated for two different blood temperatures, 37°C and 32°C, since frequently in cardiac surgery a moderate ipothermia condition is induced. The dependence of the sensor on the blood saturation was not investigate, since it is correlated with the variation of pH. Fig. 5Block diagram (a) and picture (b) of the mock system realized to simulate the blood condition during ECC. It consists of a centrifugal pump, an oxygenator, a heat exchanger, an arterial/venous bubble filter, a sampling valve, a flow cuvette, and tubings. 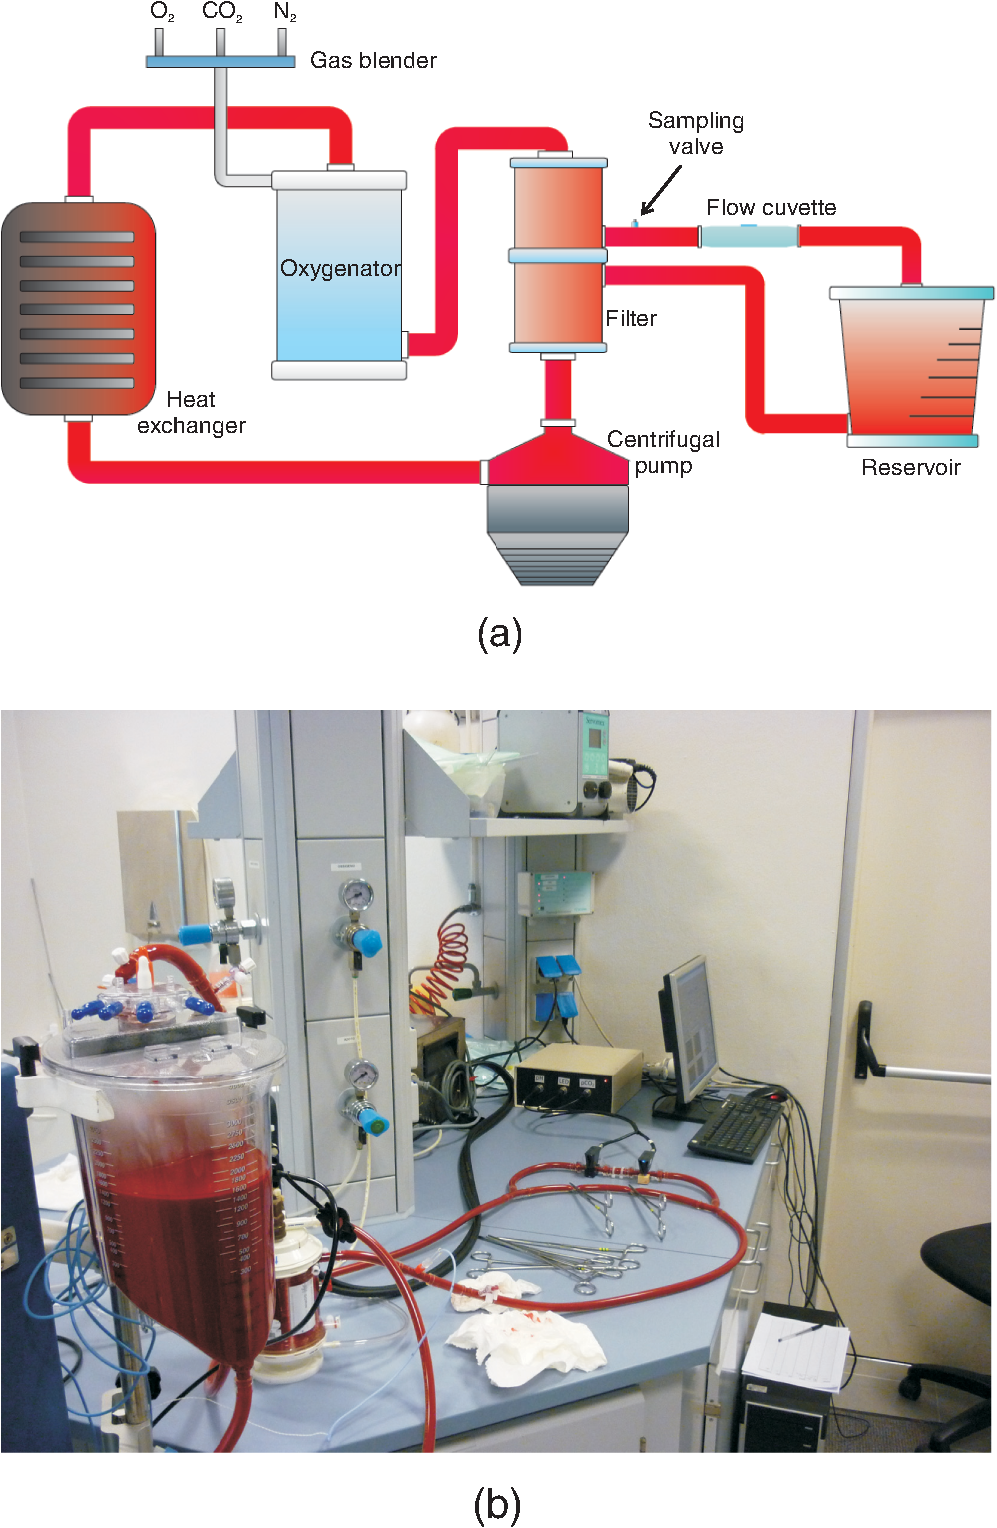 The cow was exsanguinated at local slaughterhouse 1 h before the experiment. The collected blood was stored in heparinized container at 4°C during the transportation. Whole blood is an intrinsically complex fluid and difficult to manipulate, thus great care was devoted to not alterate natural condition of the sample. Before the experiment, the blood was diluted with saline solution and used to fill the reservoir with 3 L of fluid. The hemodilution was adjusted to provide sample with a hematocrit of 33% to 34%. The values of partial pressure of oxygen (), carbon dioxide (), and pH were adjusted to normal physiological range previous the measurement session. All blood gas analyses were performed with a commercial blood gas analyzer (ABL, Radiometer A/S, Copenhagen, Denmark). 3.5.Experimental Protocol for Ex Vivo TestThe study was approved by the the Animal Care Ethical Committee of the University of Modena and Reggio Emilia. The experiments followed the recommendations described in the Italian law (D.L. 27-1-1992 n. 116). A veterinary doctor was constantly involved in the activities to control animals wellness and health. First experiment was performed on an adult female pig (see note, Table 1). To confirm the results obtained during this experiment a second sensor has been tested on an adult female sheep (see note, Table 2). Table 1Details of the pig involved in the ex vivo experiment.
Table 2Details of the sheep involved in the ex vivo experiment.
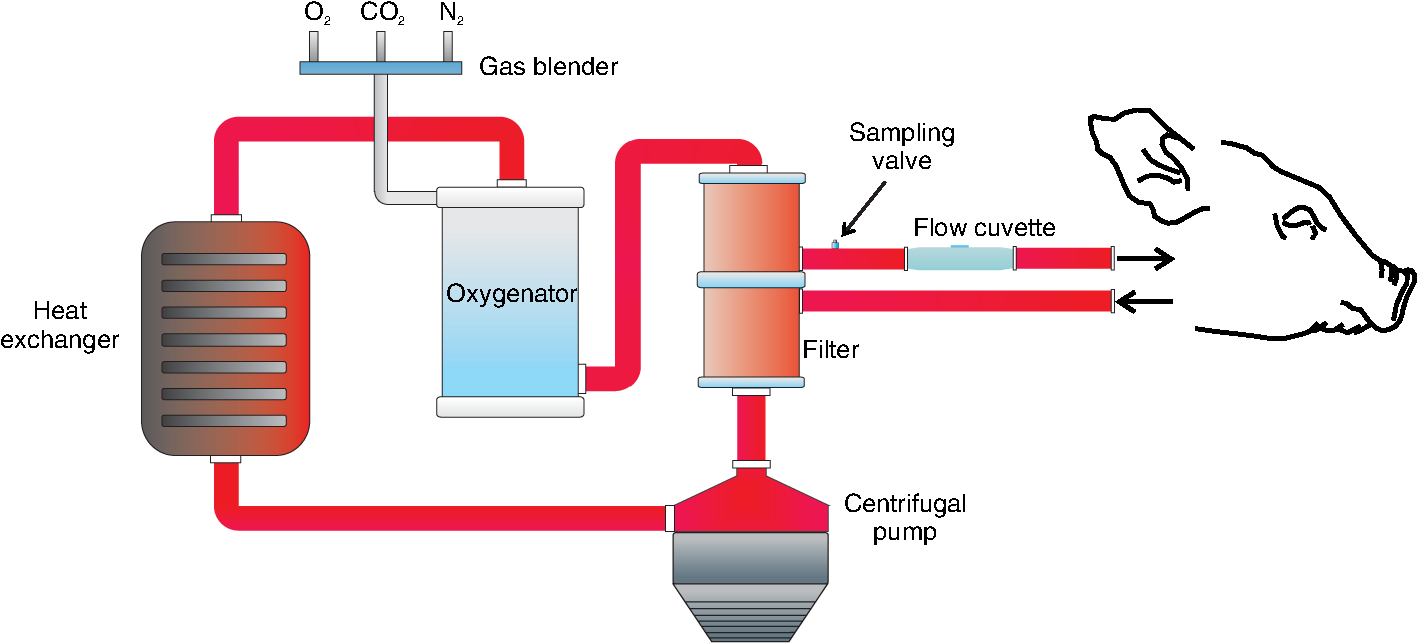
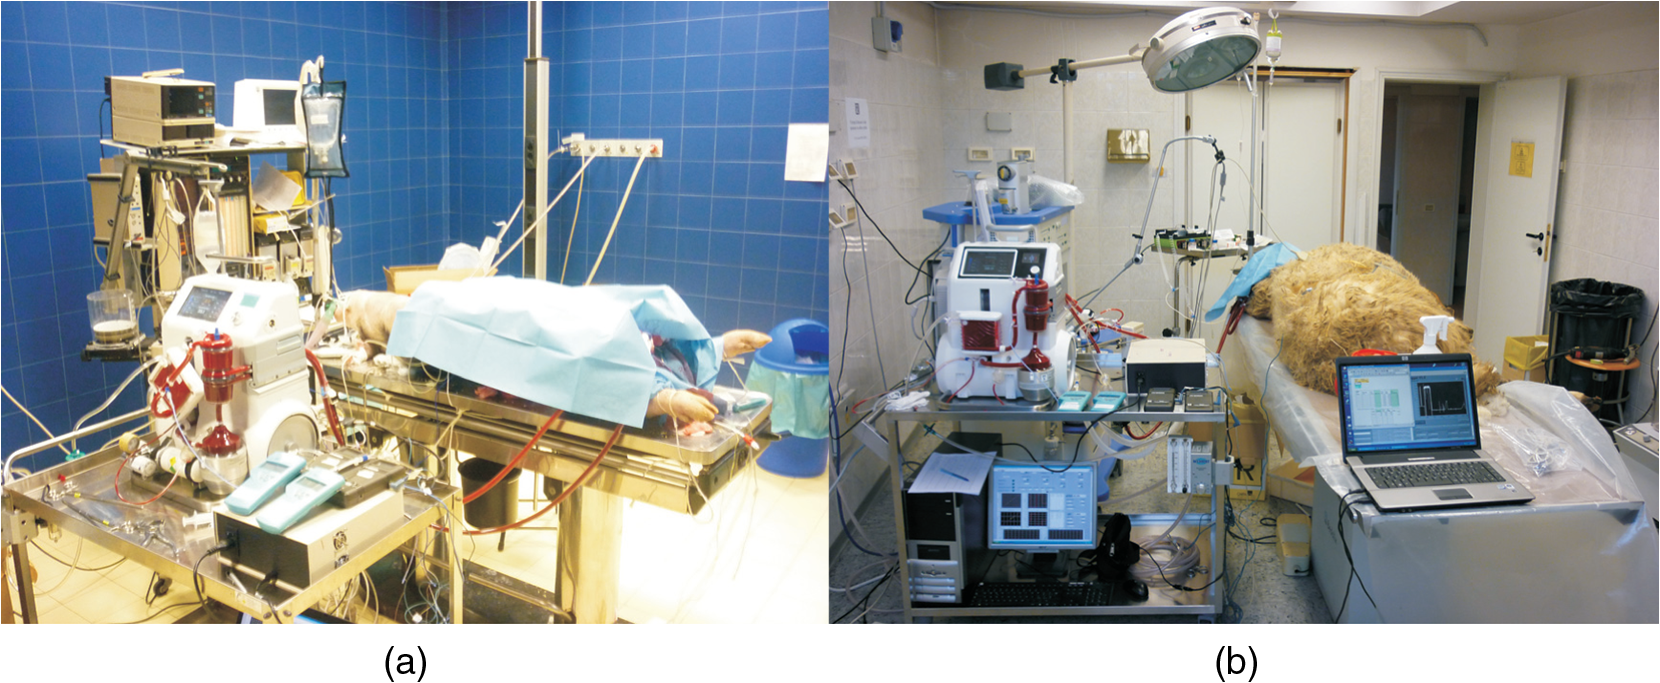
During each surgery the sensor (different sensing elements have been used in the two experiments) was attached to the arterial line of the ECC circuit. A total of 20 samples were analyzed by a a blood gas analyzer (ABL, Radiometer A/S, Copenhagen, Denmark) during the two surgeries with pH varying in the range 7.2 and 7.5. The experimental setup for ex vivo evaluation of the measuring system is shown in Fig. 6. It consists of the standard ECC setup including the flow cuvette placed between the animal and the arterial filter. The following blood parameters were monitored during the experiment: blood flow rate by flow probes (H9XL Flow Probe, Transonic Systems Inc., Artisan Sci. Co., Champaign, Illinois), blood pressures by digital sensors (DPI 705, Druck Ltd, Leicester, England), blood temperatures by thermistor probes (Exacon® Medical Temperature Probe, Exacon Scientific A/S, Roskilde, Denmark) and digital thermometer (Omega HH41, Engineering Inc., Stamford, Connecticut), blood gases (: oxygen partial pressure in the arterial blood; : oxygen partial pressure in the venous blood; : carbon dioxide partial pressure in the arterial blood; : hemoglobin oxygen saturation in the arterial blood) by a blood gas analyzer (ABL, Radiometer A/S, Copenhagen, Denmark); hematocrit by a HCT minicentrifuge (Hematocrit Centrifugette 4203, ALC International S.r.L., Cologno Monzese, Milan, Italy), blood electrolytes and activated clotting time (ACT) (ACT Plus™, Medtronic Perfusion Systems, Minneapolis, Minnesota). Heparin was continuously infused during the experiment in order to keep the ACT between 300 s and 450 s. The pig was perfused for 9 h in venous-arterial mode (iliac artery and vein were cannulated by two bypass cannulas), in normothermic condition (37.5°C to 38°C). The sheep was perfused for 11 h in venous-arterial mode (right carotid artery and jugular vein were cannulated by two bypass cannulas), under controlled hypothermia (33.2°C and 34.5°C). The pH of blood was sampled with a time interval of 1 h in each ex vivo experiment, obtaining nine samples in the ex vivo experiment on the pig and 11 on the sheep. The pictures of the environment test during the two ex vivo experiments are shown in Fig. 7. 4.Results4.1.In Vitro Experimental ResultsIn Fig. 8, versus time is shown, for a measurement performed on cow blood, changing the pH of the blood. The dots are the average values of the signal recorded at each reference pH (diamonds), measured by the blood gas analyzer. During this test, both the flow rate and the temperature of blood were kept constant, at a value of and 37°C, respectively. The pH of the blood was changed using gases, in particular carbon dioxide and nitrogen. The oxygen was kept quite constant, thus the saturation was always above 90%. The hematocrit of the blood was always kept at a value of 33% to 34%. Fig. 8versus time measured in vitro, changing the pH of the blood. The dots are the average values of the signal recorded at each reference pH (diamonds) measured by the blood gas analyzer.  The data interpolation was obtained by applying the regression model on the mean values of , calculated over a time interval of 60 s, at each reference pH value. The coefficients , and the correlation index determined by the regression model are reported in Table 3. Table 3Coefficients A˜ and B˜ of the regression model and correlation index, determined considering the mean values of the Vratio (averaged over a time interval of 60 s).
The linearity and the difference between the pH measured by our system and the pH determined by the blood gas analyzer are shown in Fig. 9. Fig. 9Estimated pH versus reference pH and the interpolation line (a). The interpolation line was obtained by applying the regression model on the mean values of the , calculated over an interval of 60 s, at every reference pH value. Difference between the estimated pH and the reference pH, versus the reference pH (b).  The mean square error value, calculated as: was determined to be 0.0243 units of pH (2.2% of the RoI).Frequently in cardiac surgery a moderate ipothermia condition is induced. To investigate the potential influence of this procedure on the recorded signal, measurements were performed varying the temperature from 37°C to 32°C. During this test, the temperature was initially kept at a value of 37°C, then was brought to 32 °C, and finally changed back to 37°C. In Fig. 10, versus time is shown; during the time period included between the two black vertical dashed lines the temperature was brought to 32°C. The dots are the average values of the signal measured at each reference pH (diamonds). Fig. 10versus time measured during an in vitro experiment. The dots are the average values of the signal measured at each reference pH (diamonds). To investigate the potential influence of a moderate ipothermia condition on the recorded signal, the temperature was initially kept at a value of 37°C, then was brought to 32°C (between the two black vertical dashed lines), and finally changed back to 37°C.  Results of the regression method, calculated considering only the pH measured at 37°C, applied to the mean values of the (averaged over a time interval of 60 s) are shown in Fig. 11. The diamonds are the reference pH measured at 37°C, whereas the triangles were measured at 32°C. Fig. 11Estimated pH versus reference pH and the interpolation line, obtained by applying the regression model on the mean values of the recorded at 37°C. The diamonds are the data acquired at 37°C, whereas the triangles were measured at 32°C.  The coefficients , , and the correlation index determined by the regression model are reported in Table 4. Table 4Coefficients A˜ and B˜ of the regression model and correlation index, determined considering the mean values of the Vratio (averaged over a time interval of 60 s) of the pH recorded at 37°C.
The mean square errors, calculated according to Eq. (12), were 0.0150 units of pH for the acquisition at 37°C (1.3% of the RoI) and 0.0280 for the acquisition at 32°C (2.5% of the RoI). 4.2.Ex Vivo Experimental ResultsIn ex vivo experiments, the pH was changed only with little variations, thus avoiding to compromise the physiological functions of the animals. The linearity between the pH measured by our system and the pH determined by the commercial blood gas analyzer is shown in Fig. 12. The coefficients , , and the correlation index determined by the regression model are reported in Table 5. Fig. 12Estimated pH measured by our system versus reference pH determined by the commercial blood gas analyzer and the interpolation line, measured in the ex vivo tests performed on the pig (a) and on the sheep (b).  Table 5Coefficients A˜ and B˜ of the regression model and correlation index, determined considering the mean values of the Vratio (averaged over a time interval of 60 s) in the ex vivo experiments on a pig and on a sheep.
The mean error was determined to be 0.0038 units of pH (0.3% of the RoI) for the experiment performed on the sheep and 0.0208 units of pH (1.9% of the RoI) for the one performed on the pig. 5.Discussion and ConclusionsIntermittent sampling of blood and the consequent delay between blood withdraw and pH data availability to medical staff can represent a critical aspect, especially during unexpected conditions that might happen during ECC. In this paper, we present a high correlation ( of 0.9887 and 0.9936 in vitro and of 0.9431 and 0.9901 ex vivo) between pH value determined by our device and pH measured by a commercial blood gas analyzer during in vitro and ex vivo experiments. The proposed measuring system that includes a biocompatible film in contact with blood, generated accurate and consistent measurements of blood pH during in vitro and ex vivo experiments. The continuous and real-time characteristics of the haematic pH sensor described in this article may improve the safety of patient management during ECC. The obtained results demonstrate the possibility of monitoring pH in real-time during ECC using a disposable sensing element based on the fluoresceine -methacrylate 97%, included in a crosslinked polymer matrix. Dye leaching is minimized by the covalent link between the fluorophore and polymer matrix, nevertheless, even in presence of minimal leaching due to a not complete reaction of fluoresceine -methacrylate this fluorophore is absolutely biocompatible and not toxic for the patient. After calibration, we found a mean square error lower than the 3% of the RoI both for in vitro and ex vivo measurements. Considering an ipothermic treatment at 32°C, the mean square error, calculated with the calibration curve obtained considering only the pH values recorded at 37°C, was lower than 3% of the measuring range. This means that this sensor is suitable for iphotermic treatment without the need of a new calibration curve. However, a different set of calibration coefficients was obtained for each sensing element. This variation is mainly associated to the reproducibility of the deposition of the polymer film on the substrate. Therefore a calibration procedure before each ECC treatment is required. This might be problematic, since at least two points of calibration are required. This procedure leads to two main disadvantages: (1) a commercial blood gas analyzer is always required in order to calibrate the sensor (limiting its field of application); (2) calibrating the sensor on a human being may be difficult since, in normal conditions, pH has little variations. This means that the sensor is likely to be calibrated with two near points, with a high probability of committing a big error for pH values out of the range of calibration. These problems could be overcome calibrating the sensor with two buffer physiological solutions with an already-known pH. Nevertheless, this approach could be problematic for perfusionists who are accustomed to use only one priming physiological solution. The developed system is not right away suitable for clinical applications. For this reason, future work will look at the fabrication of the sensing element to improve the repeatability of the sensors response. In this way, it will be possible to calibrate some sample sensors of the same production lot before the use on ECC and then using the same calibration curve for all the sensors of the lot. Thus it could be possible to use a generic sensor on ECC just taking a point of calibration, in order to adjust the calibration offset. Moreover, we are considering to extend the proposed approach to the measurement of other blood parameters of interest in ECC, providing the basis for a multi-analyte blood gas sensor.29,30 This exciting development could lead to a new valuable clinical sensing tool for continuous monitoring of blood in ECC. ReferencesD. Schneditzet al.,
“Extracorporeal Sensing Techniques in Cardiovascular Disorders in Hemodialysis,”
Contrib. Nephrol., Karger, 149
(1), 35
–41
(2005). Google Scholar
J. TusaH. He,
“Critical care analyzer with fluorescent optical chemosensors for blood analytes,”
J. Mater. Chem., 15
(27–28), 2640
–2647
(2005). http://dx.doi.org/10.1039/b503172a JMACEP 0959-9428 Google Scholar
A. PesatoriM. NorgiaL. Rovati,
“Self-mixing laser doppler spectra of extracorporeal blood flow: a theoretical and experimental study,”
IEEE Sens. J., 12
(3), 552
–557
(2012). http://dx.doi.org/10.1109/JSEN.2011.2131646 ISJEAZ 1530-437X Google Scholar
A. PesatoriM. NorgiaL. Rovati,
“Low-cost optical flowmeter with analog front-end electronics for blood extracorporeal circulators,”
IEEE Trans. Instrum. Meas., 59
(5), 1233
–1239
(2010). http://dx.doi.org/10.1109/TIM.2009.2038015 IEIMAO 0018-9456 Google Scholar
M. UshizimaS. MuuhlenI. Cestari,
“A low-cost transmittance transducer for measurement of blood oxygen saturation in extracorporeal circuits,”
IEEE Trans. Biomed. Eng., 48
(4), 495
–499
(2001). http://dx.doi.org/10.1109/10.915718 IEBEAX 0018-9294 Google Scholar
D. Myklejordet al.,
“Clinical evaluation of the on-line sensicath™ blood gas monitoring system,”
Heart Surg. Forum, 1
(1), 60
–64
(1998). Google Scholar
S. Perovet al.,
“Principles of optical oximetry in extracorporeal circulation systems,”
Biomed. Eng., 26
(5), 243
–247
(1992). http://dx.doi.org/10.1007/BF00559265 JBIEDR 0141-5425 Google Scholar
F. GameroM. UshizimaI. Cestari,
“Real time monitoring of oxygen saturation in extracorporeal circulation using an optical reflectance transducer,”
Artif. Organs, 25
(11), 890
–894
(2001). http://dx.doi.org/10.1046/j.1525-1594.2001.06899.x ARORD7 0160-564X Google Scholar
J. Jianget al.,
“Development of fiber optic fluorescence oxygen sensor in both in vitro and in vivo systems,”
Respir. Physiol. Neurobiol., 161
(2), 160
–166
(2008). http://dx.doi.org/10.1016/j.resp.2008.01.013 RPNEAV 1569-9048 Google Scholar
C. Morganet al.,
“Continuous neonatal blood gas monitoring using a multiparameter intra-arterial sensor,”
Arch. Dis. Child. Fetal Neonatal Ed., 80
(2), F93
–F98
(1999). BJANAD 0007-0912 Google Scholar
M. GanterA. Zollinger,
“Continuous intravascular blood gas monitoring: development, current techniques, and clinical use of a commercial device,”
Br. J. Anaesth., 91
(3), 397
–407
(2003). http://dx.doi.org/10.1093/bja/aeg176 BJANAD 0007-0912 Google Scholar
H. Endohet al.,
“Continuous intra-jugular venous blood-gas monitoring with the Paratrend 7 during hypothermic cardiopulmonary bypass,”
Br. J. Anaesth., 87
(2), 223
–228
(2001). http://dx.doi.org/10.1093/bja/87.2.223 BJANAD 0007-0912 Google Scholar
S. MarxerM. Schoenfisch,
“Sol-gel derived potentiometric pH sensors,”
Anal. Chem., 77
(3), 848
–853
(2005). http://dx.doi.org/10.1021/ac0486995 ANCHAM 0003-2700 Google Scholar
Z. LiuJ. LiuT. Chen,
“Phenol red immobilized PVA membrane for an optical pH sensor with two determination ranges and long-term stability,”
Sensor. Actuat. B Chem., 107
(1), 311
–316
(2005). http://dx.doi.org/10.1016/j.snb.2004.10.017 0925-4005 Google Scholar
P. HashemiR. Zarjani,
“A wide range pH optical sensor with mixture of neutral red and thionin immobilized on an agarose film coated glass slide,”
Sensor. Actuat. B Chem., 135
(1), 112
–115
(2008). http://dx.doi.org/10.1016/j.snb.2008.08.010 0925-4005 Google Scholar
L. Rovatiet al.,
“Construction and evaluation of a disposable pH sensor based on a large core plastic optical fiber,”
Rev. Sci. Instrum., 82
(2), 023106
(2011). http://dx.doi.org/10.1063/1.3541795 RSINAK 0034-6748 Google Scholar
D. WencelB. MacCraithC. McDonagh,
“High performance optical ratiometric sol-gel based pH sensor,”
Sensor. Actuat. B Chem., 139
(1), 208
–213
(2009). http://dx.doi.org/10.1016/j.snb.2008.12.066 0925-4005 Google Scholar
Z. Liet al.,
“A novel fluorescence ratiometric pH sensor based on covalently immobilized piperazinyl-1,8-napthalimide and benzothioxanthene,”
Sensor. Actuat. B Chem., 114
(1), 308
–315
(2006). http://dx.doi.org/10.1016/j.snb.2005.05.018 0925-4005 Google Scholar
I. Sánchez-Barragánet al.,
“A ratiometric approach for ph optosensing with a single fluorophore indicator,”
Analytica Chimica Acta, 562
(2), 197
–203
(2006). http://dx.doi.org/10.1016/j.aca.2006.01.033 ACACAM 0003-2670 Google Scholar
L. Ferrariet al.,
“Haematic pH sensor for extracorporeal circulation,”
Proc. SPIE, 8214 82140E
(2012). http://dx.doi.org/10.1117/12.906562 PSISDG 0277-786X Google Scholar
L. Ferrariet al.,
“Photobleaching effects in organic thin film sensing probes,”
in IEEE Int. Instrumentation and Measurement Technology Conf.,
1235
–1239
(2012). Google Scholar
Y. KostovG. Rao,
“Low-cost optical instrumentation for biomedical measurements,”
Rev. Sci. Instrum., 71
(12), 4361
–4374
(2000). http://dx.doi.org/10.1063/1.1319859 RSINAK 0034-6748 Google Scholar
I. JohnsonM. T. Z. Spence, Molecular Probes Handbook, A Guide to Fluorescent Probes and Labeling Technologies, 11th ed.Life Technologies, Invitrogen, Carlsbad, California
(2010). Google Scholar
J. K. TusaM. J. P. Leiner,
“Optodes fluorescentes pour analytes de l’urgence,”
Annales de Biologie Clinique, 61
(2), 183
–191
(2002). ABCLAI 0003-3898 Google Scholar
Y. A. Povrozinet al.,
“Near-infrared, dual-ratiometric fluorescent label for measurement of pH,”
Anal. Biochem., 390
(2), 136
–140
(2009). http://dx.doi.org/10.1016/j.ab.2009.03.047 ANBCA2 0003-2697 Google Scholar
A. S. Vasylevskaet al.,
“Novel coumarin-based fluorescent pH indicators, probes and membranes covering a broad pH range,”
Anal. Bioanal. Chem., 387
(6), 2131
–2141
(2007). http://dx.doi.org/10.1007/s00216-006-1061-6 ABCNBP 1618-2642 Google Scholar
E. Braunwaldet al., Harrison’s Principles of internal medicine, McGraw Hill, New York City
(2002). Google Scholar
L. LiL. J. Lee,
“Photopolymerization of HEMA/DEGDMA hydrogels in solution,”
Polymer, 46
(25), 11540
–11547
(2005). http://dx.doi.org/10.1016/j.polymer.2005.10.051 POLMAG 0032-3861 Google Scholar
N. Joglekaret al.,
“A review of blood gas sensors and a proposed portable solution,”
in Int. Symposium on Integrated Circuits,
244
–247
(2007). Google Scholar
C. CooneyB. Towe,
“Evaluation of microfluidic blood gas sensors that combine microdialysis and optical monitoring,”
Med. Biol. Eng. Comput., 42
(5), 720
–724
(2004). http://dx.doi.org/10.1007/BF02347556 MBECDY 0140-0118 Google Scholar
|