|
|
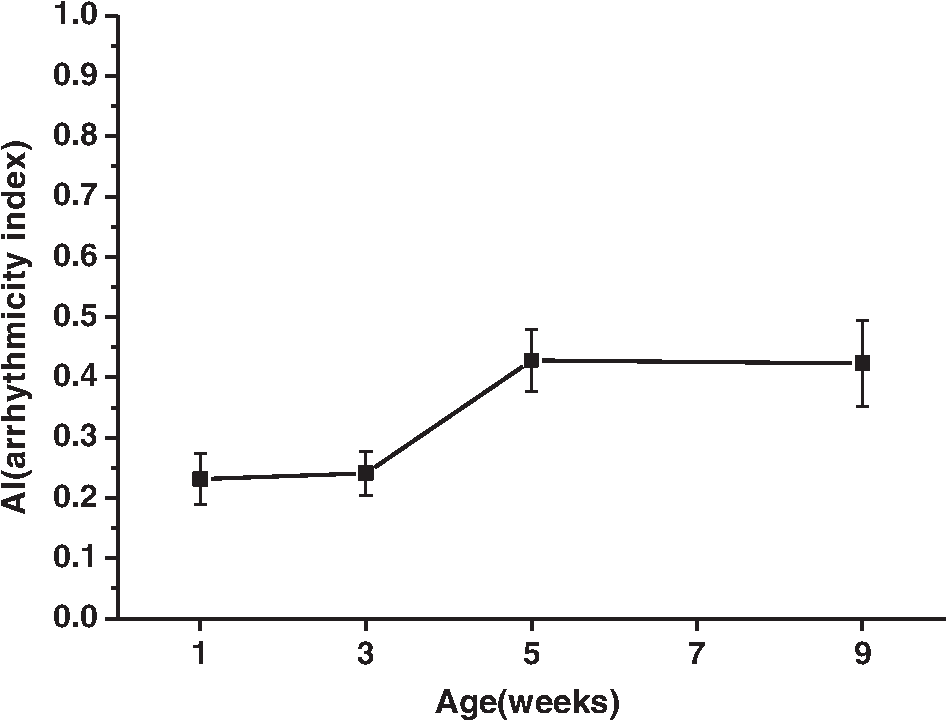
1.IntroductionDrosophila melanogaster has been a useful myocardial model for investigating human heart disease.1–4 Recently, many approaches have been proposed for assessing cardiac functions in Drosophila, such as using electropacing stress,5 optical coherence tomography (OCT),6 multielectrode array systems,7 semi-automatic optical heartbeat analysis (SOHA),8 atomic force microscopy,9 and multiple sensor electrocardiography.10 Among these, OCT is a powerful tool for producing noncontact and noninvasive tomographic images of biological tissues. By measuring the echo time delay and the intensity of backscattered light from a specimen, OCT uses inherent differences in the index of refraction in tissue, rather than enhancement with dyes, to differentiate various tissue types. The extended imaging depth in the scattering medium enables OCT to successfully obtain in vivo images of the adult heart in Drosophila.6,11–15 In previous studies using time-domain (TD) OCT, given the limitation of imaging speed, a number of heartbeat parameters have been obtained by manual counting; this involves tracking heart activity through a limited numbers of beats from M-mode OCT records.6,11,12 Since the recently developed frequency-swept lasers have improved sensitivity, making real-time B-mode and Doppler OCT imaging possible,13–15 high-throughput studies in Drosophila are now feasible. This requires an automated analyzing method for obtaining reliable measurements of dynamic heart function parameters in large samples or over a long period of time. Therefore, in this study we proposed a rapid OCT-based method for obtaining cardiac parameters from adult flies. Our method is very useful, particularly in experiments with a large sample size. We adopted the random walker algorithm for semiautomatic cardiac chamber segmentation in B-mode OCT images. Random walker is a semiautomatic segmentation method based on graph theory by Leo Grady;16 it requires that the user give some labels as input seed points for the cardiac chamber area and background. Greater detail of random walker segmentation will be described in the next section. First, we created an initial set of seed points for the random walker algorithm on the first frame. In the next frame, the cross-sections of the heart tube are automatically segmented in a total of 2000 frames, and the size of the inner margin is represented by area for each Drosophila. Then, depending on the histogram distribution of the changing area during each heartbeat cycle, an optimum threshold can be chosen automatically by an iterative process.17 Thus, each heart period (HP) is subdivided into two meaningful sections, which are used to represent diastolic and systolic intervals (DI and SI), respectively. These two parameters are important for detailed heartbeat analysis. The proposed method combines high-speed swept-source OCT (SS-OCT), for optical recording of beating hearts, with robust, semiautomatic analysis to rapidly detect and quantify, on a beat-to-beat basis, not only heart rate (HR) and HP but also DI and SI, and end-diastolic (EDA) and end-systolic area (ESA). These parameters can be used to determine dynamic parameters of heart function, including the arrhythmia index (AI) and percent fractional shortening (%FS). We also demonstrate age-related alterations observed in fly heart-function using this method. The convenience of the algorithm, and the relevance of our results to the human body, is also discussed. 2.Methods2.1.SS-OCT Imaging TechniqueDrosophila (), used as wild-type strain, were maintained on regular yeast glucose media at 25°C. For image assessment, flies were first anesthetized by exposure to Fly Nap® (Carolina Biological Supply Company, Burlington, North Carolina). Flies were then immobilized on a plastic petri dish using jelly glue, with the dorsal side facing the OCT probe. For each time point, a group of 10 flies of different ages, including one-, three-, five-, and nine-week-old flies, were examined using the SS-OCT system (OCM1300SS; ThorlabsInc., Newton, New Jersey). Two-dimensional OCT images were obtained in the longitudinal direction to identify the conical chamber (CC) of the heart [Fig. 1(a)]. Then, the OCT image orientation was rotated by 90 deg, such that the CC was acquired in the transverse plane of the Drosophila. Figure 1(b) and 1(c) shows representative transverse two-dimensional OCT images of the CC during diastole and systole, respectively, in a three-week-old wild-type Drosophila. Fig. 1Representative B-mode OCT images. The arrow shows the conical heart chamber (CC) (a) in longitudinal orientation and (b) and (c) in transverse orientation. The dorsal side is at the top of the images. Squares show the heart wall in the (b) diastolic and (c) systolic stage. (d) and (e) The process of implementation of the autosegmentation algorithm. (d) Original image, (e) Enhanced image, (f) Related probability distribution, (g) Red circle indicates the heart segmentation result. 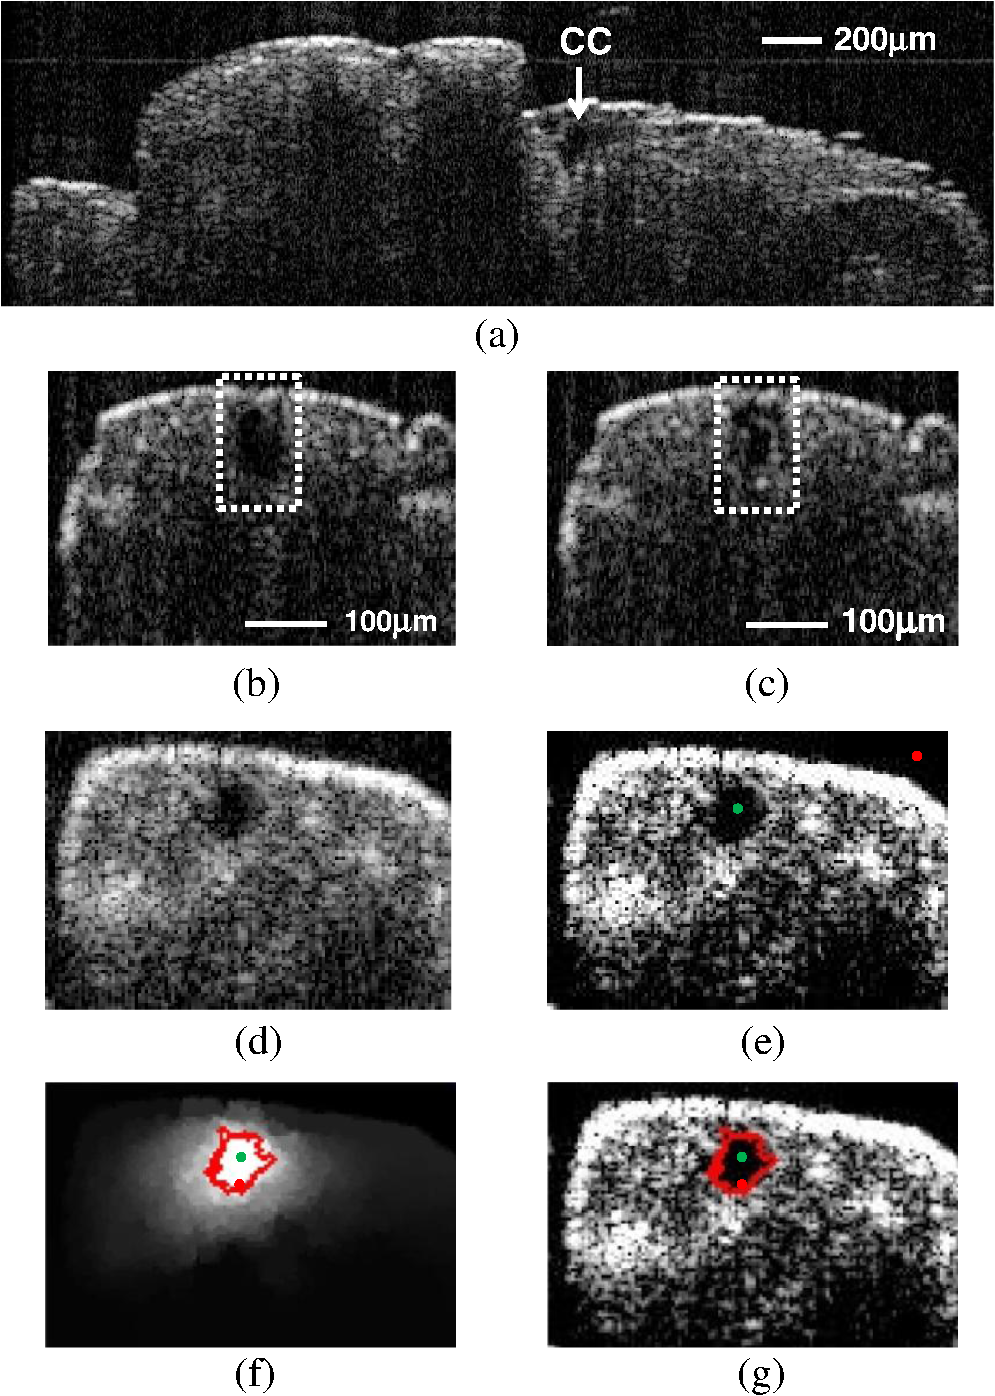 The SS-OCT system had a median wavelength of 1310 nm; an axial and transverse resolution of around 9 and 15 μm, respectively, in tissue; total power of 10 mW; and an A-scan rate of 16 kHz. For each measurement, around 2000 frames (each covering an area of , corresponding to in the direction) was obtained at 92 frames per second. 2.2.AlgorithmWe used a combination of two algorithms, written in Matlab, to automatically measure several heartbeat parameters in Drosophila. First, after contrast-enhancement of the original image, as shown in Fig. 1(d) and 1(e), an initial set of seed points are created by the user to indicate the inner margin (green point) of the heart chamber for the random walker algorithm. The red point is automatically provided by the algorithm, showing seed points at fixed positions to indicate the outer margin of the heart chamber and background. When the random walker moves from any pixel, it calculates a vector of probabilities, based on the correlation of both grey-level and distance for each pixel, to reach the specified seeds. As demonstrated in Fig. 1(f) and 1(g), the probability of every unlabeled point reaching the labeled points will be computed by this algorithm. Then, segmentation results can be obtained by performing thresholding on the probability map. The algorithm is summarized below, and more details can be found in Ref. 16. Based on graph theory, a graph consists of a pair of points, , with vertices set and edge set . The weight of an edge has a weight between neighboring vertices and , with intensity and . The weighting function is given by where is the constant for adjustment of . The discrete Dirichlet integral in a region is defined as where the Laplacian matrix is defined as in which is indexed by vertices and and is the degree of vertex . All pixels of the same region have a similar intensity, so that differentiating approximates zero. Given the labeled points , the unlabeled points can be solved by the discrete Dirichlet integral functionThe unlabeled area, , can be obtained by solving a sparse linear system in the differentiating as follows: It is only necessary to position seeds on one frame; thereafter, the edges of the CC are automatically detected on every frame. Figure 2 demonstrates the area inside the boundary of the heart tube in 100 frames, where peak and trough positions represent EDA and ESA of the Drosophila. Here, we define , which represents the extent of change in the cardiac chamber area during systole; it can provide an estimate of the contractility of the heart tube. HP is quantified as the time elapsed between the ends of two consecutive systoles (i.e., at the troughs of the filtered data, as indicated by the red line in Fig. 2). AI is defined as the standard deviation of HP, normalized to the median HP. This parameter provides quantitative representation of the arrhythmicity of the hearts of individual flies, which is useful for comparing groups of individuals. Fig. 2Change in area inside the segmented boundary of the heart tube during heart contraction. Blue: original data, red: filtered data for determining positions of troughs only. HP is the time between two troughs.  Furthermore, in order to automatically estimate the length of diastole and systole, we adopted an automatic thresholding-algorithm.17 First, we used the average value of the maximum and minimum areas on the histogram distribution during each heartbeat cycle as an initial estimate of the threshold . Then, we partitioned the area in each HP into lower and higher groups, R1 and R2, using the threshold . A new threshold is then created by calculating the mean values and of the two partitions, using the equation These three steps are repeated until the mean values, and , do not change in successive iterations; the optimum threshold can then be chosen automatically as a result of this iterative process. In the process, each HP is subdivided into two meaningful regions; Fig. 3 demonstrates two heartbeats, where SI is quantified as the interval during contraction (systole), which is, in turn, defined as the time occupied when a cardiac area smaller than the mean values of the lower group R1 are encountered. DI is then quantified as HP minus SI. 3.ResultsWe first tested how inputting different numbers as seed points and in different regions could affect the probability distribution and the final segmentation. The representative result is shown in Fig. 4. For comparison, Fig. 4(a) shows the segmentation results manually measured by our expert. Figure 4(b) to 4(d) shows the segmentation results from inputting one, two, and three seed points, respectively, to indicate the inner margin. The right column of Fig. 4 shows the enlarged images. For each image, we input seed points in 20 different randomly selected regions. Random walker segmentation resulted in the same mean area size (), irrespective of whether one, two, or three seed points were provided. The coefficients of variation (CV), which are defined as the standard deviation of area in percentage, normalized to the mean area, for seed points provided in different regions were 0.13%, 0%, and 0% for inputting one, two, or three seed points, respectively. This indicates that the algorithm has very high precision in segmenting the Drosophila heart tube in OCT images. Fig. 4Segmentation results from (a) manual segmentation by our expert, (b) to (d) semi-automated method, by inputting one, two, and three seed points, respectively. Right column shows the enlarged images.  Thereafter, we randomly selected 28 images (each with two seed points) and compared the size of the segmentation area with that obtained by manual segmentation. As shown in Fig. 5(a), the correlation coefficient between automated method and manual segmentation was 0.993, which demonstrated that the random walker algorithm is as accurate as the manual method in segmenting the Drosophila heart tube in OCT images. Fig. 5(a) Correlation of the segmentation results of area between the automated and manual methods. (b) Canonical correlation results of DI and SI using the automated thresholding and manual methods. R, correlation coefficient.  In order to assess whether SI and DI detection, based on the automated thresholding algorithm, differs from that defined by manual interpretation by an expert user, manual measurements for DI and SI were obtained by the user adjusting the thresholds on the histogram distribution of a segmented area (e.g., in Fig. 2, where five representative DI and SI were measured for each fly). Using the contraction pattern provided by M-mode OCT as an objective assessment of heart wall motion, the user could then finely adjust the thresholds. We randomly selected four movies taken of one-, three-, five-, and nine-week-old flies and compared the manual measurements obtained in this manner with the output of our algorithm. Both DI and SI periods in the heart of Drosophila were measured manually and using the automated thresholding algorithm. We evaluated the correlation of the manual and automated methods using canonical correlation, a statistical analysis method used to assess correlation of two sets of variables with more than one dimension.18 Figure 5(b) shows that the maximal canonical correlation found was 0.9989, which indicates that the algorithm defined SI and DI as accurately as did manual measurements. Figure 6 shows the M-mode contraction pattern, in which we can observe the phenomenon of prolonged relaxation time and irregular heart rhythms that occur with increasing age. In particular, flies in their ninth week of age displayed various forms of arrhythmia. Figures 7 to 10 summarize eight heartbeat parameters of male Drosophila derived and quantified by our automated algorithm, in their first, third, fifth, and ninth week, respectively. Data points represent the mean [±standard error of the mean (SEM)] for 10 files per datum point. Figure 7 shows a significant difference both in HP and HR between one- and three-week-old [analysis of variance (ANOVA), )], one- and five-week-old (ANOVA, ), one- and nine-week-old (ANOVA, ), three- and five-week-old (ANOVA, ), and three- and nine-week-old flies (ANOVA, ). It was also quite clear from our data (Fig. 8) that DI in particular increased with age, as compared to SI, with a significant difference in DI between three- and five-week-old flies (ANOVA, ). Moreover, the variation in DI was more obvious when comparing flies in their fifth and ninth weeks; this was consistent with Fig. 9, which shows the average AI, reflecting the age-related increase in arrhythmicity in flies (ANOVA, ). However, the average size for ESA remains similar across age, while a small but statistically insignificant increase in EDA is shown in Fig. 10(a). For this reason, no significant decline in FS was observed, as shown in Fig. 10(b). Fig. 6A representative M-mode OCT images in male Drosophila at one, three, five, and nine weeks of age.  Fig. 7Cardiac parameters in male Drosophila at one, three, five, and nine weeks of age showing (a) HP and (b) HR.  4.DiscussionDrosophila is an important model for investigating human heart diseases. Automated quantification of potentially relevant parameters from the model can replace labor-intensive manual work and generate more objective, accurate, and comprehensive metrics. A widely used approach for cardiac image analysis is to reduce complexity by using M-mode, which is the monodimensional projection of the image along a line. M-mode images are often used in echocardiography for the analysis of heart motion dynamics.19 Previous methods6,11,12 using M-mode OCT images were based on continuous in-depth scans in the midline of a fly’s cardiac chamber over time; cardiac parameters, including HR, end-diastole diameters, and end-systole diameters, are manually measured and derived by averaging a few cardiac cycles during a normal, regular rhythm. Automatic segmentation of cardiac M-mode images for identifying end-systole and end-diastole can be a challenge, although many methods have been proposed, such as gray-level histograms,20 fuzzy set,21 Markov random field models, neural networks, binarization, morphology,22 and many others. In these methods, borders are not well defined and the gray level is not uniform. Thus, Bertelli et al.23 proposed a semi-automated method, which segments cardiac M-mode images by using a multiclassifier for computing cardiac parameters, such as the ratio between the diameters in end-diastolic and end-systole, or the ratio between diastolic and systolic durations. The required computational time for the process is about 25 s. Fink et al.24 used a combination of two movement detection algorithms to track movement of heart edges from a semi-intact Drosophila heart. The user needs to adjust the thresholds and filters to finely tune the algorithm output, using M-mode as an objective assessment of heart wall movements. In this study, instead of following the segmentation of cardiac M-mode images, cardiac parameters are measured on the basis of changes in the whole cross-sectional area of the cardiac chamber, rather than by measuring the brightness (i.e., gray level change) between the edge of the superior and inferior walls during mid-diastole and mid-systole in M-mode OCT images. Our proposed semi-automated segmentation method, based on the random walker algorithm, can provide a unique, quality solution that is robust to weak/noisy object boundaries.16 This is because, according to the theory of random walker segmentation, the performance of the algorithm depends on the weighting function in Eq. (1). Noise is usually considered to be a disturbance in a local region. This means that a region with noise has a greater intensity difference between adjacent pixels than a region without noise. The weighting function determines the influence of intensity difference between adjacent pixels. It decreases the effect of noise and increases the boundary effect. Further details and proofs can be found in Ref. 25. There are some other well-known segmentation methods, such as active contours or graph cuts. Segmentation based on active contouring26 has large time complexity and poses a local energy minimization problem, so that the method does not always present a correct solution, especially when segmenting images with a tortuous boundary or high noise levels. Figure 1 shows images with a markedly tortuous boundary and high noise level. Another well-known algorithm, graph cuts,27 has been developed for automated and semi-automated segmentation. For automated segmentation, the performance of graph cuts is noticeably better than other methods. However, if an insufficient number of seeds is provided in the semi-automated segmentation, the “small cut” problem will decrease the correctness of segmentation. Grady16 showed that random walker segmentation can cope with images with a tortuous boundary or high noise levels, has no local energy minimization problem, or “small cut” drawback, even if a small number of seeds are used. Our data confirmed that even in the presence of a degraded boundary, such as the cardiac tube of Drosophila, the algorithm could perform segmentation successfully (with a very high correlation to manual segmentation, ). We also proved that when inputting more than two seed points, different regions of input would not affect the final segmentation result (). The automated thresholding algorithm is a simple and efficient statistical method for computing a threshold value automatically between two bimodal distributions, simply according to their mean value. In this study, we observed that the area distribution in diastole and systole followed a bimodal distribution. Thus, DI and SI, based on our algorithm, could be automatically and independently detected in each HP. This method was validated against manual interpretation by our expert, and the algorithm generated the SI and DI as accurately as did manual measurements (the methods were highly correlated, ). It should be noticed that there are periods of time when the speckle pattern is fixed on M-mode OCT images (Fig. 6); the rate of change of the heart segmented area at these times is zero, so that our automated thresholding algorithm detects “long” diastoles or systoles. The quantitative heartbeat parameters measured using our proposed method show that as flies age, HP lengthens [Fig. 7(a)], resulting in an age-related decline in HR [which is the inverse of HP; Fig. 7(b)]. We also found that the age-dependent decrease in HR may be due to a disproportionate increase in DI, compared to SI, with age (Fig. 8). Moreover, the current algorithm not only measures HR but also quantitatively expresses the age-dependent increase of heartbeat arrhythmicity (i.e., AI), which may be due to large variations in DI associated with age, particularly when comparing flies in their fifth and ninth weeks of age (Fig. 9). These findings are consistent with results obtained with a movement detection algorithm by Fink et al.24 Ocorr et al.7 also suggested that age-related cardiac dysfunction in the fly heart is due to a decrease in the efficacy of cardiac relaxation. Since age-dependent decreases in intrinsic HR, and increases in the incidence of AI, have also been documented in humans,28–31 our observation of the age-related changes in heart function of flies has correlates in humans. Large variations existed in both EDA and ESA within the tested groups, which may be due to differences in size between flies; however, use of %FS can eliminate the effect of body size. Fink et al.24 have reported age-dependent decreases in FS. However, in our study, no significant declines in %FS in fly hearts were observed with age, suggesting that muscle contractility remained similar across age. Previous studies using different cardiovascular stress methods to estimate end-systolic and end-diastolic dimensions also failed to detect significant alterations associated with aging.32,33 In this study, because the eight heartbeat parameters were automatically detected by manually positioning two seeds only on one frame, it only requires around 0.5 s to process a single fly (including a minimum of 100 cardiac cycles) with the proposed algorithm; this can be an efficient and useful approach for high-throughput gene-screening studies in Drosophila. Moreover, solving the solution of the random walker segmentation according to Eq. (5) is a linear system. Douglas et al.34 have demonstrated the design of analog circuit implementation from a linear system. This direct correspondence with analog electrical circuits opens the possibility for hardware implementation of the random walker segmentation algorithm. As the random walker algorithm can also operate in three dimensions, further research, combining faster SS-OCT scanning and more control of fly movement, may allow heart volume segmentation. 5.ConclusionHere, we presented an algorithm for cardiac image segmentation with high precision and high accuracy, based on a small set of pre-labeled pixels. Furthermore, the technique we described here allows an optimum threshold to be chosen automatically as a result of an iterative process. By applying the semi-automated segmentation and auto-threshold algorithm, we established an easier and more accurate quantification method for measuring heart parameters in Drosophila. Both algorithms involve the use of a few empirical parameters and are expected to perform robustly in the presence of noise. Using our approach, we were able to show age-dependent changes in fly heart-function, including HP increases; disproportionate increases in DI and SI, increases in AI, and a similar %FS across age. The combination of high-speed and successive B-mode imaging features of SS-OCT gives this technique potential for automatically assessing large numbers of individuals over significant periods of time. OCT-based automatic and rapid quantification of cardiac parameters can facilitate future high-throughput studies in Drosophila. AcknowledgmentsWe are grateful to the Bloomington Stock Center and Fly Core of Taiwan for fly stock. This work was supported by grants from the National Science Council (Grant No. NSC 96-2628-M-003-001-MY3) and National Health Research Institute (NHRIEX91-9109SC) of Taiwan. ReferencesT. Akasakaet al.,
“The ATP-sensitive potassium (KATP) channel-encoded dSUR gene is required for Drosophila heart function and is regulated by tinman,”
Proc. Natl. Acad. Sci. U. S. A., 103
(32), 1999
–2004
(2006). http://dx.doi.org/10.1073/pnas.0603098103 PNASA6 0027-8424 Google Scholar
A. Cammaratoet al.,
“Myosin transducer mutations differentially affect motor function, myofibril structure, and the performance of skeletal and cardiac muscles,”
Mol. Biol. Cell, 19
(2), 553
–562
(2008). http://dx.doi.org/10.1091/mbc.E07-09-0890 MBCEEV 1059-1524 Google Scholar
D. DulcisR. B. Levine,
“Glutamatergic innervation of the heart initiates retrograde contractions in adult Drosophila melanogaster,”
J. Neurosci., 25
(2), 271
–280
(2005). http://dx.doi.org/10.1523/JNEUROSCI.2906-04.2005 JNRSDS 0270-6474 Google Scholar
B. Monieret al.,
“Steroid dependent modification of Hox function drives myocyte reprogramming in the Drosophila heart,”
Development, 132
(23), 5283
–5293
(2005). http://dx.doi.org/10.1242/dev.02091 DEVPED 0950-1991 Google Scholar
R. J. WessellsR. Bodmer,
“Screening assays for heart function mutants in Drosophila,”
BioTechniques, 37
(1), 58
–60
(2004). http://dx.doi.org/10.2144/3701A0058 BTNQDO 0736-6205 Google Scholar
M. J. Wolfet al.,
“Drosophila as a model for the identification of genes causing adult human heart disease,”
Proc. Natl. Acad. Sci. U. S. A., 103
(5), 1394
–1399
(2006). http://dx.doi.org/10.1073/pnas.0507359103 PNASA6 0027-8424 Google Scholar
K. Ocorret al.,
“KCNQ potassium channel mutations cause cardiac arrhythmias in Drosophila that mimic the effects of aging,”
Proc. Natl. Acad. Sci. U. S. A., 104
(10), 3943
–3948
(2007). http://dx.doi.org/10.1073/pnas.0609278104 PNASA6 0027-8424 Google Scholar
K. Ocorret al.,
“Semi-automated optical heartbeat analysis of small hearts,”
J. Vis. Exp., 31 1435
(2009). http://dx.doi.org/10.3791/1435 JVEOA4 1940-087X Google Scholar
G. Kaushiket al.,
“In situ mechanical analysis of myofibrillar perturbation and aging on soft, bilayered Drosophila myocardium,”
Biophys J., 101
(11), 2629
–2637
(2011). http://dx.doi.org/10.1016/j.bpj.2011.10.042 BIOJAU 0006-3495 Google Scholar
K. Sláma,
“A new look at the comparative physiology of insect and human hearts,”
J. Insect Physiol., 58
(8), 1072
–1081
(2012). http://dx.doi.org/10.1016/j.jinsphys.2012.04.014 JIPHAF 0022-1910 Google Scholar
M. A. Chomaet al.,
“In vivo imaging of the adult Drosophila melanogaster heart with real-time optical coherence tomography,”
Circulation, 114
(2), E35
–E36
(2006). http://dx.doi.org/10.1161/CIRCULATIONAHA.105.593541 CIRCAZ 0009-7322 Google Scholar
L. S. Maet al.,
“Arrhythmia caused by a Drosophila tropomyosin mutation is revealed using a novel optical coherence tomography instrument,”
PLoS One, 5
(12), e14348
(2010). http://dx.doi.org/10.1371/journal.pone.0014348 1932-6203 Google Scholar
A. Braduet al.,
“Dual optical coherence tomography/fluorescence microscopy for monitoring of Drosophila melanogaster larval heart,”
J. Biophoton., 2
(6–7), 380
–388
(2009). http://dx.doi.org/10.1002/jbio.v2:6/7 JBOIBX 1864-063X Google Scholar
M. A. Chomaet al.,
“Heart wall velocimetry and exogenous contrast-based cardiac flow imaging in Drosophila melanogaster using Doppler optical coherence tomography,”
J. Biomed. Opt., 15
(5), 056020
(2010). http://dx.doi.org/10.1117/1.3503418 JBOPFO 1083-3668 Google Scholar
M. T. Tsaiet al.,
“Observations of cardiac beating behaviors of wild-type and mutant Drosophilae with optical coherence tomography,”
J. Biophoton., 4
(9), 610
–618
(2011). http://dx.doi.org/10.1002/jbio.201100009 JBOIBX 1864-063X Google Scholar
L. Grady,
“Random walks for image segmentation,”
IEEE Trans. Pattern Anal. Mach. Intell., 28
(11), 1768
–1783
(2006). http://dx.doi.org/10.1109/TPAMI.2006.233 ITPIDJ 0162-8828 Google Scholar
T. W. RidlerE. S. Calvard,
“Picture thresholding using an iterative selection method,”
IEEE Trans. Syst. Man Cybernet., 8
(8), 630
–632
(1978). http://dx.doi.org/10.1109/TSMC.1978.4310039 Google Scholar
D. R. HardoonS. SzedmakJ. Shawe-Taylor,
“Canonical correlation analysis: an overview with application to learning methods,”
Neural Comput., 16
(12), 2639
–2664
(2004). http://dx.doi.org/10.1162/0899766042321814 Google Scholar
M. A. Garcia-FernandezJ. L. ZamoranoJ. Azevedo, Doppler Tissue Imaging, 7
–21 McGraw-Hill, New York
(1997). Google Scholar
R. M. HaralickL. G. Shapiro,
“Image segmentation techniques,”
Comp. Vis. Graph. Image Process., 29
(1), 100
–132
(1985). http://dx.doi.org/10.1016/S0734-189X(85)90153-7 CVGPDB 0734-189X Google Scholar
O. J. TobiasR. Seara,
“Image segmentation by histogram thresholding using fuzzy sets,”
IEEE Trans. Image Process., 11
(12), 1457
–1465
(2002). http://dx.doi.org/10.1109/TIP.2002.806231 IIPRE4 1057-7149 Google Scholar
S. ManayA. Yezzi,
“Anti-geometric diffusion for adaptive thresholding and fast segmentation,”
IEEE Trans. Image Process., 12
(11), 1310
–1323
(2003). http://dx.doi.org/10.1109/TIP.2003.818039 IIPRE4 1057-7149 Google Scholar
L. Bertelliet al.,
“A semi-automatic system for segmentation of cardiac M-mode images,”
Pattern Anal. Appl., 9
(4), 293
–306
(2006). http://dx.doi.org/10.1007/s10044-006-0034-x 1433-7541 Google Scholar
M. Finket al.,
“A new method for detection and quantification of heart beat parameters in Drosophila, zebrafish, and embryonic mouse hearts,”
BioTechniques, 46
(2), 101
–113
(2009). http://dx.doi.org/10.2144/000113078 BTNQDO 0736-6205 Google Scholar
L. GradyG. Funka-Lea,
“Multi-label image segmentation for medical applications based on graph-theoretic electrical potentials,”
Computer Vision and Mathematical Methods in Medical and Biomedical Image Analysis, 230
–245 Springer-Verlag, Berlin Heidelberg
(2004). Google Scholar
J. A. Sethian, Level Set Methods and Fast Marching Methods, Cambridge University Press, Cambridge, United Kingdom
(1999). Google Scholar
Y. Y. BoykovM. P. Jolly,
“Interactive graph cuts for optimal boundary & region segmentation of objects in N-D images,”
in Proc. 8th IEEE Int. Conf. on Comput. Vis.,
105
–112
(2001). Google Scholar
G. Paternostroet al.,
“Age-associated cardiac dysfunction in Drosophila melanogaster,”
Circ. Res., 88
(10), 1053
–1058
(2001). http://dx.doi.org/10.1161/hh1001.090857 CIRUAL 0009-7330 Google Scholar
R. J. Wessellset al.,
“Insulin regulation of heart function in aging fruit flies,”
Nat. Genet., 36
(12), 1275
–1281
(2004). http://dx.doi.org/10.1038/ng1476 NGENEC 1061-4036 Google Scholar
A. D. JoseD. Collison,
“The normal range and determinants of the intrinsic heart rate in man,”
Cardiovasc. Res., 4
(2), 160
–167
(1970). http://dx.doi.org/10.1093/cvr/4.2.160 CVREAU 0008-6363 Google Scholar
J. S. Strobelet al.,
“Nonpharmacologic validation of the intrinsic heart rate in cardiac transplant recipients,”
J. Interv. Card. Electrophysiol., 3
(1), 15
–18
(1999). http://dx.doi.org/10.1023/A:1009811203861 1383-875X Google Scholar
T. Thomet al.,
“Heart disease and stroke statistics: 2006 update. A report from the American heart association statistics committee and stroke statistics subcommittee,”
Circulation, 113
(6), e85
–e151
(2006). http://dx.doi.org/10.1161/CIRCULATIONAHA.105.171600 CIRCAZ 0009-7322 Google Scholar
C. D. Furberget al.,
“Prevalence of atrial fibrillationin elderly subjects (the Cardiovascular Health Study),”
Am. J. Cardiol., 74
(3), 236
–241
(1994). http://dx.doi.org/10.1016/0002-9149(94)90363-8 AJNCE4 0258-4425 Google Scholar
C. C. DouglasJ. MandelW. L. Miranker,
“Fast hybrid solution of algebraic systems,”
SIAM J. Sci. Stat. Comp., 11
(6), 1073
–1086
(1990). http://dx.doi.org/10.1137/0911060 SIJCD4 0196-5204 Google Scholar
|