
|
|
1.IntroductionThe incidence of esophageal adenocarcinoma (EAC) has dramatically increased over the last four decades; since 1975, there has been a 463% increase among men and a 335% increase among women.1 This is of particular concern because EAC is associated with a very low five-year survival rate (12%) due primarily to diagnosis at a late stage.2 When diagnosed early, the five-year survival rate of EAC is 81%, but only a small fraction of esophageal cancers are detected at this stage.3 Patients with Barrett’s esophagus (BE), a condition caused by chronic acid damage to the esophagus over time, are known to be at an increased risk of developing EAC.4,5 Because of the high likelihood of developing dysplasia and cancer, patients with BE are recommended to undergo regular surveillance at designated intervals.6 During the standard surveillance procedure, white light examination is used to scan the entire Barrett’s segment for visible abnormalities, such as nodules and ulcerations. Since many neoplastic lesions can appear flat and indistinguishable from nondysplastic mucosa under white light imaging, random four-quadrant biopsies are taken every 1 to 2 cm along the Barrett’s segment.6 Unfortunately, this method has been shown to miss as many as 57% of dysplasias and cancers.7 Thus, there is an important need for new techniques that may improve the early diagnosis of EAC and its precursors. In an attempt to improve image contrast and diagnostic yield, a number of widefield endoscopic imaging modalities have been developed. Autofluorescence imaging (AFI) is sensitive to changes in stromal collagen fluorescence and increased epithelial thickness;8 neoplasia is associated with loss of detected autofluorescence intensity. AFI has been shown to identify abnormal lesions with 91% sensitivity.9,10 However, inflammatory lesions can also demonstrate loss of fluorescence, and the specificity of AFI can be as low as 43%;9 other studies have also shown high rates of false positives associated with AFI.11 Narrowband reflectance imaging uses narrow bands of blue and green illumination to enhance vascular content, indirectly enhancing the appearance of the glandular pit pattern and achieving a sensitivity range of 89% to 100% and a specificity range of 76% to 98% for detecting neoplasia.12–14 Moreover, reported specificities for detecting BE are as low as 65%.15 Though both technologies enhance mucosal changes in different ways, signal differences have been shown to aid clinical interpretation of mucosal features.10,11 However, limitations associated with false positives reinforce the need for new imaging techniques. Recent ex vivo studies suggest that two emerging widefield modalities show promise in improving the early recognition of esophageal neoplasia. In the first approach, cross-polarized imaging (CPI), tissue is illuminated with linearly polarized white light, and light re-emitted from the tissue surface is collected via a second linear polarizer, whose axis of transmission is oriented orthogonally to that of the incident light. CPI preferentially collects light scattered from subsurface tissue structures, thereby enhancing the contrast of deeper blood vessels.16 CPI has been shown in various organ sites to improve the identification of epithelial neoplasia,17,18 though it has yet to be implemented for in vivo endoscopic imaging. In the second approach, vital-dye enhanced fluorescence imaging (VFI), a fluorescent dye is used to enhance tissue fluorescence. Proflavine hemisulfate, a fluorescent contrast agent, stains cell nuclei, enabling observation of relevant changes in epithelial architecture associated with neoplastic progression. Ex vivo studies of VFI and proflavine staining in gastrointestinal tissues have shown that the agent allows for the evaluation of glandular architecture during widefield imaging.19 While CPI and VFI have demonstrated their utility in other organ sites or with ex vivo specimens, evaluating their utility for in vivo esophageal cancer screening requires the development of an upper GI endoscope capable of acquiring images in these modalities. Here, we describe the development and initial clinical evaluation of a modular video endoscope (MVE) that incorporates white light imaging (WLI), CPI, and VFI modalities. We present images acquired with the MVE from an ex vivo esophageal specimen with pathologically confirmed disease, as well as in vivo images acquired during endoscopic assessment of a patient with Barrett’s-associated neoplasia. 2.Materials and Methods2.1.InstrumentationThe MVE shown in Fig. 1 was designed to acquire images in three different modalities: conventional WLI, CPI, and VFI. The MVE consists of a modified high-definition () video processor (Pentax EPK-i), a standard upper GI video endoscope (Pentax EG-29901), and stainless steel modules attached to the distal tip of the endoscope containing the necessary optical filters for CPI or VFI implementation. Each module is coupled to the distal tip with a medium-sized, commercially available endoscope cap (Barrx Medical Inc., Sunnyvale, California) shown in the right panel of Fig. 1. The custom-designed filter modules maintain use of the standard features of the endoscope during CPI and VFI imaging, including the forward water jet used for irrigation and the air/water nozzle used to clear debris from the field of view (FOV) of the charge coupled device (CCD). The dimensions are shown in Fig. 2. In all three imaging modalities, the system is designed to be used at the standard working distance of the endoscope, ranging from 5 to 20 mm. A digital zoom feature allows up to 3× additional magnification. The FOV depends on both the working distance and the digital magnification; at a typical working distance of 10 mm, the FOV ranges from 15 to 45 mm in diameter, with a resolution of approximately 50 μm. At the minimum working distance of 5 mm, the FOV ranges from 5 to 15 mm in diameter, with a resolution of approximately 25 μm. Fig. 1The top diagram illustrates the placement of linear polarizers in front of the illumination light guides and CCD for CPI implementation. The image to the right of the CPI diagram shows the distal end of the endoscope tip with the CPI filter module in place. The bottom diagram illustrates the placement of the longpass filter in front of the CCD for VFI implementation. The image to the right of the VFI diagram shows the distal end of the endoscope tip with the VFI filter module in place. In VFI mode, the light guides emit blue light from the laser diode. The panel on the right shows the endoscope tip (top) and module assembly (bottom) using the silicone cap. 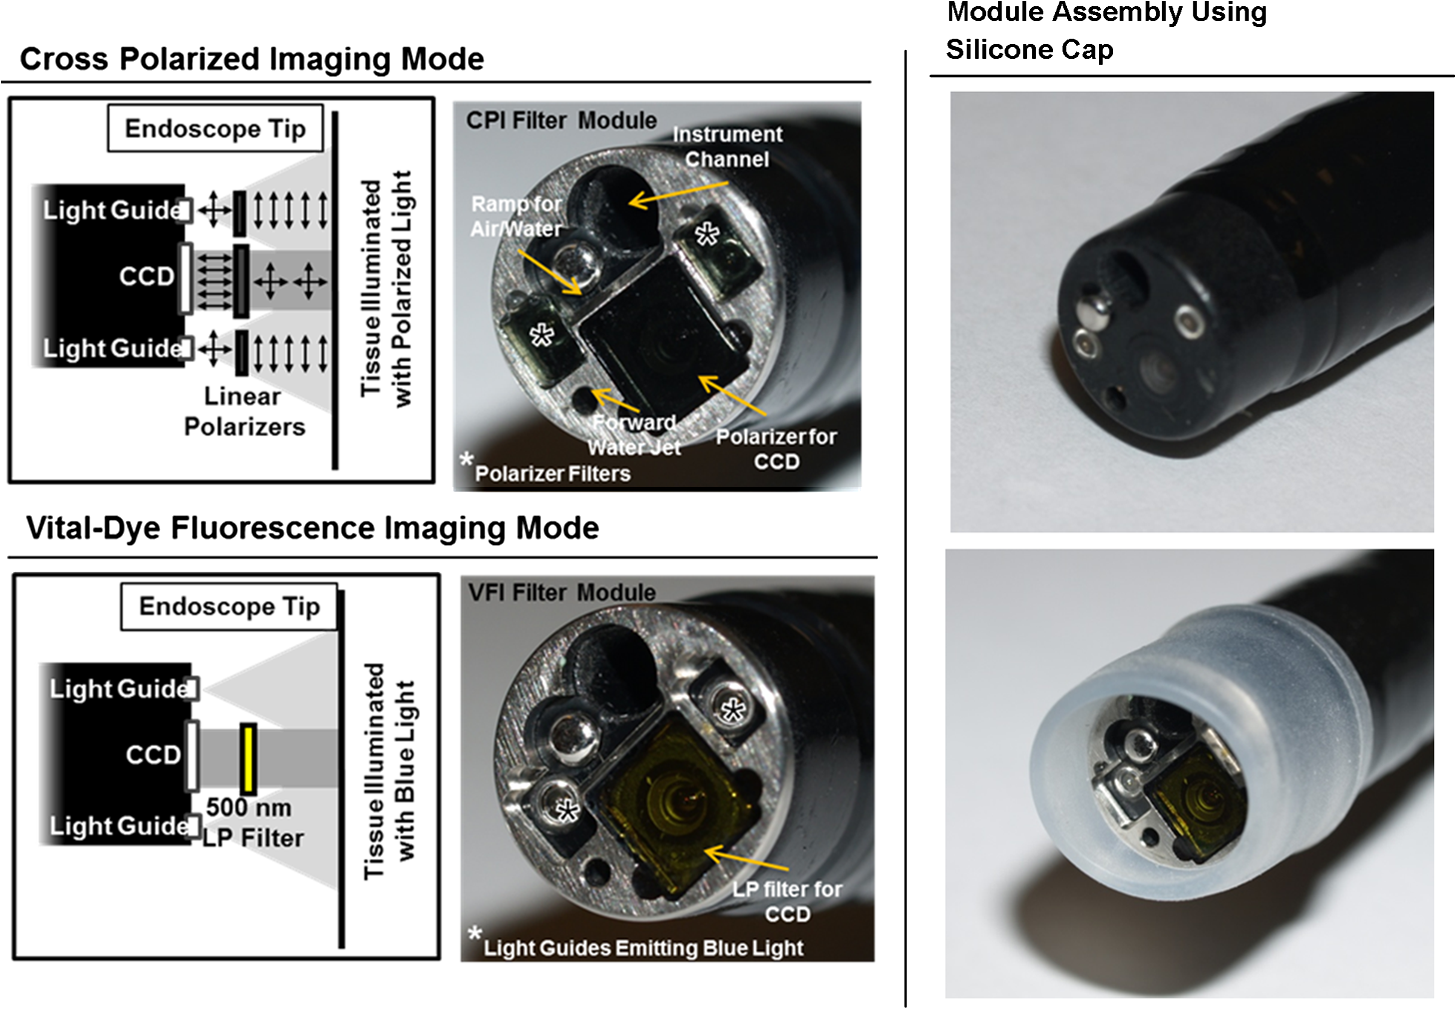 Fig. 2Front face of the module (a) and right cross-sectional profile (b) shown with dimensions (mm). Regions are labeled to indicate which features on the endoscope tip correspond to the cuts. Black stars in (a) indicate extruded cuts created to accommodate illumination channels. A cross-sectional profile (b) is obtained from the dotted line in (a). Blue arrows indicate extruded cuts made for filters and epoxy. The protrusion (white star) in (b) indicates the channel for the forward water jet. The protrusion was implemented to aid in alignment of the module and the endoscope tip.  2.1.1.Cross-polarized imagingIn CPI, tissue is illuminated with linearly polarized white light, and images are acquired through a second linear polarizer oriented to transmit only reflected light, with its axis of polarization oriented orthogonally to that of the illumination light. This serves both to reject specular reflection from the tissue surface and to enhance the appearance of subsurface vasculature. The top row of Fig. 1 shows the module designed to adapt the standard endoscope for CPI imaging. To achieve CPI, white light from the endoscope light guides pass through linear polarizers () contained in the cap, one in front of each end of the bifurcated light guide (indicated by the stars in the CPI filter module image of Fig. 1); this is done to accommodate the illumination channels that exist in the Pentax video endoscope. The module holds another linear polarizer () in front of the CCD camera; the axis of this polarizer is oriented orthogonally to that of the illumination polarizers. These filters are fixed in the module using optically clear epoxy (Epo-Tek, Billerica, Massachusetts). The filters are cut from HN22 polarizing sheets (Knight Optical Ltd., UK); the thickness of the film is 0.75 mm, and the maximum transmission of two orthogonally oriented sheets is 0.001%. With the CPI module in place, the surface irradiance at the center of the FOV is approximately at 5 mm and approximately at 10 mm; both are typical working distances for imaging. 2.1.2.Vital-dye fluorescence imagingIn VFI mode, tissue is illuminated with quasi-monochromatic light designed to excite fluorescence; a long-pass filter is placed in front of the CCD camera to reject specular reflection at the excitation wavelength and to allow for the collection of resulting fluorescence. The VFI module was designed specifically to image fluorescence following topical application of the fluorescent antiseptic proflavine hemisulfate, which has been shown to localize in cell nuclei. The agent has an absorption maximum at 450 nm and an emission maximum at 515 nm. The bottom row of Fig. 1 shows the module designed to adapt the standard endoscope for VFI imaging. To provide illumination during VFI, a 455-nm laser diode (Nichia Corporation, Tokyo, Japan) was installed in the Pentax EPK-i; light from the blue laser diode was coupled to the bifurcating light guide used during white light imaging, and a mechanical control on the processor was used to switch between the two illumination modes. A driver (Wavelength Electronics, Bozeman, Montana) controls the input current to the laser diode and thus allows variation of the illumination intensity. The module holds a custom-designed long-pass filter () passing wavelengths of more than 500 nm in front of the CCD for the collection of proflavine fluorescence. The filters were cut from a custom-coated colored glass filter (Schott North America, Inc., Duryea, Pennsylvania); the thickness of the filter is 0.8 mm, and the optical density (OD) at the illumination wavelength is 3.8. The filter was designed to have out-of-band rejection of at least OD 3 for light ranging from normal incidence up to 70 deg incidence, accommodating the angular FOV of the endoscope. The edges of the filter were coated black to minimize the effect of stray light on the image. The filters were installed using a medical-grade, optically clear epoxy (#301-2FL, Epo-tek, Billerica, Massachusetts). With the module and the blue laser diode in place, the surface irradiance at the center of the FOV is approximately at 5 mm and approximately at 10 mm; both are typical working distances for imaging. 2.1.3.High-resolution microendoscopyThe MVE was designed to acquire widefield images in both CPI and VFI modes; in addition, it was designed to be compatible with a high-resolution microendoscope (HRME) capable of resolving subcellular detail in areas identified as suspicious during widefield imaging. The HRME has been previously described20–22 and has been used during in vivo endoscopy to visualize gastrointestinal pathology using proflavine contrast.23 In this system, the light from a 455-nm LED is coupled to a fiber-optic bundle for tissue illumination. The fluorescence from proflavine stained tissue is collected by the bundle while in contact with the tissue and is delivered to a CCD camera through a 550-nm bandpass filter with a cut-on wavelength of approximately . The field of view of the HRME is 720 μm in diameter, and the spatial resolution is 4.5 μm. 2.1.4.Image captureImage collection is achieved through a custom designed interface (Labview 2010, National Instruments, Austin, Texas). The program displays the HD signal () via a DVI-to-USB capture card (Epiphan Systems, Ottawa, Ontario, Canada) and allows for the collection of both digital video and image frames. The interface also allows the user to adjust brightness and contrast where appropriate and to store information such as the date and time of the procedure. 2.1.5.Instrument performanceThe system resolution was determined by capturing an image of a U.S. Air Force resolution target (Newport Corp., Irvine, California). To assess background autofluorescence, images were acquired in VFI mode from a 2-in. diameter nonfluorescent frosted quartz disk (which approximates tissue reflectance) with settings that matched or exceeded those used for proflavine stained tissue. The measurements were used to verify the absence of excitation light leakage and to assess the performance of the emission filter. 2.2.Pilot StudyThe MVE was used to acquire images from clinically normal and abnormal areas of the esophagus in vivo during endoscopic surveillance and ex vivo immediately following surgical resection. Patients at Mount Sinai Medical Center were eligible to participate in the study if they met the following criteria: They had or previously had histologically confirmed Barrett’s metaplasia and were undergoing either routine surveillance or endoscopic treatment for Barrett’s metaplasia or Barrett’s-associated dysplasia. A healthcare provider described the study to eligible patients. Patients gave written informed consent prior to participation. The study was reviewed and approved by the IRBs at Mount Sinai Medical Center and Rice University. 2.2.1.Ex vivo imaging procedureThe MVE was used first to acquire images of an esophagectomy specimen. Immediately following surgical resection, the mucosal surface of the specimen was rinsed with saline and imaged with a digital single-lens reflex (SLR) camera under white light illumination. Visually abnormal and normal sites were identified by the study pathologist based on appearance; borders of these regions were marked on the white light image. Areas identified by the pathologist as grossly normal and abnormal were imaged using all three widefield imaging modalities; images were first acquired using WLI, then using CPI, and then in VFI mode. The specimen was imaged ex vivo at a fixed working distance of 5 mm to allow for optimal correlation between image sites and subsequent pathological assessment. Before VFI imaging, proflavine hemisulfate (0.01% w/v) was applied to the mucosal surface of the sample using a sterile cotton tip applicator. Excess proflavine was removed with dry gauze. Finally, high-resolution images were acquired using the HRME from clinically normal and abnormal areas. In order to ensure the same FOV was imaged with each imaging modality, the distance from the edge of the specimen, landmarks such as vessels, islands of squamous or columnar tissue, and the perimeter of the squamo-columnar junction were tracked as each widefield modality was used. To track high-resolution imaging, widefield images were taken of the probe in contact with the mucosa, verifying that the images were obtained from the same FOV. In an effort to reduce sampling error, black or blue ink was placed at each area imaged, fixed with acetic acid, and photographed. Since the ink spread to approximately 2 to 4 mm in diameter, the photograph guided the approximation of image sites on the resected specimens necessary to facilitate registration between widefield imaging, high-resolution imaging, and subsequent histopathologic evaluation. The specimen was then fixed in formalin and submitted for standard histopathologic analysis; vertical cross-sections were examined to grade and verify the presence of disease. The study pathologist, blinded to the image results, assigned diagnoses to histologic sections of inked areas using standard histologic criteria. 2.2.2.In vivo imaging procedureThe MVE was next used in vivo to acquire images during endoscopic surveillance using three high-definition imaging modalities: WLI, CPI, and VFI. After endoscopic surveillance using WLI, the scope was removed, the module for CPI was placed on the distal tip, and the scope was reinserted. The scope was removed again after CPI, the VFI module was installed, and the scope was inserted a third time. Following the third insertion, proflavine (5 to 10 mL) was administered via spray catheter (Olympus America, Center Valley, Pennsylvania) on the epithelial surface, and VFI images were acquired. Finally, the endoscopist introduced the HRME probe via the instrument channel of the endoscope and placed the probe in gentle contact with the tissue surface. HRME images were obtained from sites considered clinically abnormal using widefield imaging. Additional HRME images were obtained from sites that were considered clinically normal by widefield modalities. Widefield imaging in all three modes and high-resolution imaging were performed by a single endoscopist. In order to ensure the images in all modalities were taken at the same site, three pieces of information were recorded during the procedure: clinical landmarks indicated by the endoscopist (such as Barrett’s borders, islands, ulceration, or bleeding), endoscope depth and quadrant, and time stamps during the procedure (upper right hand corner of every video). Post-procedure, videos were evaluated frame by frame to ensure images from the same site were extracted from each modality. All extracted image frames associated with each image site were reviewed by researchers (NT, ML, SA, RRK). 2.2.3.Endoscopic image criteriaThe entire Barrett’s segment was scanned for apparent abnormalities with each image modality, using image criteria developed from previous ex vivo imaging studies.19,20 CPI images were considered suspicious if they demonstrated increased and abnormal vascularization, with crowding and branching of blood vessels, or if there were areas of glandular effacement. VFI images were considered suspicious if they demonstrated alterations in glandular architecture or glandular effacement. HRME images were considered abnormal if they exhibited enlarged, crowded, and pleomorphic nuclei. Images were also considered abnormal if they revealed overlapping glands that were heterogeneous in size and shape with irregular luminal spacing. Many abnormal areas also exhibited loss of overall glandular architecture.19,20 After imaging, biopsies were obtained from areas deemed suspicious in any of the imaging modes. Then, standard four-quadrant biopsies were taken every 1 to 2 cm of the BE segment. Images acquired from suspicious sites were compared to the histologic evaluation of the biopsy from the same site. In addition, biopsies of nonneoplastic regions containing Barrett’s metaplasia were obtained as controls. 3.Results3.1.Instrument PerformanceAt the minimum working distance of 5 mm, the system can resolve a line spacing of at least 24.8 μm (group 4, element 3). At a typical working distance of 10 mm, the system can resolve a line spacing of at least 49.5 μm (group 3, element 3); the performance was unchanged with the incorporation of the imaging modules. The ratio of signal from proflavine stained tissue to frosted quartz imaged using the same settings was always greater than 10:1. 3.2.Pilot Study3.2.1.Ex vivo: MVE images of esophagectomy specimenThe MVE was used to acquire images from five sites on a single esophagectomy specimen. Histopathology results were available from all five sites; two were diagnosed as non-neoplastic Barrett’s, two were diagnosed as adenocarcinoma, and one was diagnosed as carditis. Figures 3 and 4 show representative images of neoplastic and non-neoplastic tissue from this specimen. Figure 3 compares images of BE (top row) and adenocarcinoma (bottom row) in WLI and CPI modes. As expected, CPI images show reduced specular reflection (black arrows) and enhanced vascular contrast. In images of Barrett’s metaplasia, vessels are better visualized in the cross-polarized image when compared to the same areas in the white light image (white boxes). In the images showing adenocarcinoma, not only are the vessels better visualized, but the increase in vasculature and vessel branching associated with neoplasia is more readily apparent (white box). Fig. 3The top row shows (a) white light image and (b) cross-polarized images of Barrett’s metaplasia. The bottom row shows (c) white light image and (d) cross-polarized image of intramucosal carcinoma. Black arrows show areas where specular reflection appears reduced in the CPI image. White boxes in the CPI image indicate areas where vessel branching is enhanced when compared with the same areas in the WLI. Images were acquired from an ex vivo esophageal specimen.  Fig. 4The top row shows the (a) white light image, (b) vital-dye fluorescence image, and (c) high-resolution fluorescence image of proflavine-stained Barrett’s metaplasia. The white box in (b) indicates a region where glandular architecture is clearly visible. The bottom row shows the (e) white light image, (f) vital-dye fluorescence image, and (g) high-resolution fluorescence image of proflavine-stained intramucosal carcinoma. The yellow box in (f) indicates partial glandular effacement, and white boxes indicate complete effacement. The yellow arrows in (g) indicate small, irregularly shaped glands, and the yellow box indicates a gland with disrupted edges. The white box indicates an area of nuclear crowding. Corresponding histologic cross-sections are shown (d) and (f). Note the ink on the surface of each histologic section, verifying that the section was taken from the imaged area. Images were acquired from an ex vivo esophageal specimen.  Figure 4 shows images acquired from BE (top row) and adenocarcinoma (bottom row) in WLI and VFI modes. The VFI image of Barrett’s metaplasia allows for visualization of regular-appearing glandular architecture (white box). The edges of the glands are discernible, and the pattern appears consistent throughout the region. The corresponding HRME image shows nuclear staining primarily at the gland edges, indicating polarized nuclei, which is characteristic of non-neoplastic Barrett’s metaplasia.19,20 This feature can also be seen in the corresponding vertical histology cross-section, which shows Barrett’s metaplasia. The VFI image of adenocarcinoma allows visualization of partly effaced (yellow box) and completely effaced (white box) glandular architecture. The gland edges are no longer clearly discernible. The HRME image shows nuclear crowding, small and irregularly shaped glands (yellow arrows), loss of nuclear polarity within the glands (yellow box), and absence of glands in some areas (white box). These features are mirrored in the corresponding vertical histology cross-section, which shows adenocarcinoma. 3.2.2.In vivo: MVE images obtained during endoscopyIn vivo imaging was conducted on one patient. During the endoscopic procedure using the MVE, three sites were imaged (using all four modalities) and biopsied. Two sites were diagnosed as non-neoplastic BE, and one was diagnosed as adenocarcinoma. Figure 5 shows representative images from a site diagnosed as BE. In Fig. 5(a), the white light image shows glandular architecture with some vascular detail. The CPI image in Fig. 5(b) again shows enhanced vascular contrast. Indeed, both larger vessels and smaller vessels that were not visible during WLI become clear (white box). In the VFI image shown in Fig. 5(c), glands are present throughout the examined area. Gland borders appear wide, and there is little interruption between the border edges. High-resolution imaging with the HRME through the instrument channel of the endoscope in Fig. 5(d) allows for a magnified view of the features seen in VFI. Gland border edges appear regular (yellow boxes) and similar throughout the FOV. Nuclei within these regions appear polarized toward the gland edges. These features, along with intestinal-type goblet cells, are apparent in the corresponding vertical histology cross-section in Fig. 5(e), showing Barrett’s metaplasia, which is negative for dysplasia. Fig. 5In vivo images of an area of Barrett’s metaplasia in (a) white light, (b) cross-polarized, (c) vital-dye fluorescence, and (d) high-resolution imaging modes. The white boxes in (b) indicate areas where the appearance of vessel branching is enhanced. The yellow boxes in (d) show regular gland edges and indicate gland borders where nuclei are primarily polarized toward the edge. The corresponding histopathology cross-section is shown in (e).  Figure 6 shows images from a site diagnosed as adenocarcinoma. In Fig. 6(a), the WLI shows a flat, nonulcerated lesion with both vascular and glandular abnormalities. In the CPI image of the same area, shown in Fig. 6(b), the pattern of vessel branching is easier to assess when compared with WLI (white box). A VFI image of the same area, shown in Fig. 6(c), shows glands that appear partly effaced in some regions (white boxes) and completely effaced in others (yellow boxes). Proflavine staining is heterogeneous throughout the area. The HRME image shown in Fig. 6(d) reveals crowded glandular structures with irregular gland borders (yellow boxes), along with nuclear crowding both within the glands and outside of the glands (white box). Nuclei also appear pleomorphic. The histologic section presented in Fig. 6(e) was diagnosed as adenocarcinoma. Fig. 6In vivo images of an area of adenocarcinoma in (a) white light, (b) cross-polarized, (c) vital-dye fluorescence, and (d) high-resolution imaging modes. The white boxes in (b) indicate areas where appearance of vessel branching is enhanced when compared to (a). The white boxes in (c) indicate partial glandular effacement, and the yellow boxes indicate complete effacement. The yellow boxes in (d) show irregular gland edges, and the white box indicates a border where nuclei appear crowded. The corresponding histopathology cross-section is shown in (e), where black boxes indicate areas of LGD, HGD, and ACA. 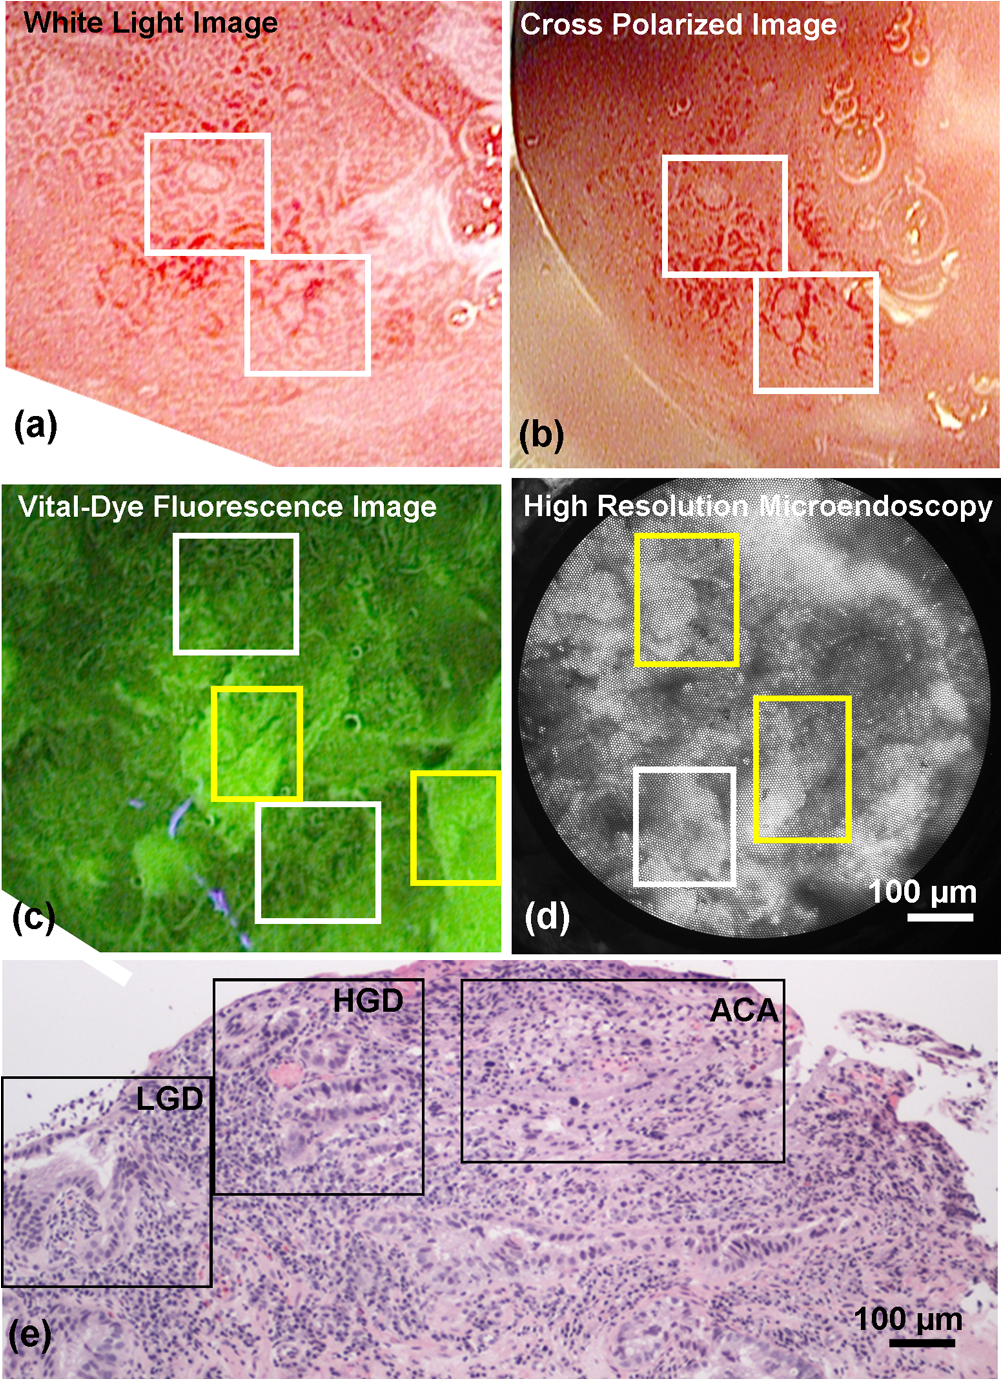 4.DiscussionIn summary, we reported the technical development and initial ex vivo and in vivo evaluation of a multimodal endoscopic imaging system capable of high-definition white light imaging, cross-polarized reflectance imaging, and vital-dye enhanced fluorescence imaging. We showed technical compatibility with a previously reported high-resolution microendoscope imaging system, demonstrating the potential for the multimodal endoscope to be used in conjunction with probe-based microendoscopic technologies. CPI and VFI are novel endoscopic modalities that probe important mucosal features; CPI enhances vasculature, while VFI highlights changes in glandular architecture. Additionally, HRME imaging allows higher-resolution examination of glandular morphology, including nuclear characteristics such as pleomorphism and crowding. We have demonstrated the feasibility of these modalities by imaging areas of Barrett’s metaplasia and associated neoplasia on an esophagectomy specimen. We verified that the key image features of neoplastic and non-neoplastic tissue were also observed during an in vivo surveillance procedure. The results suggest that key pathological features seen in CPI, VFI, and HRME imaging are not easily visible during standard endoscopic white light imaging. Therefore, these imaging methods may be useful in future in vivo studies for discriminating dysplasia and cancer from Barrett’s metaplasia. In this study, we find that CPI improves visualization of vasculature without significantly altering the white light appearance of the image. A number of groups have used vascular contrast enhancement to improve disease detection. Groner et al. used cross-polarization to improve the visualization of microcirculation.16 Roblyer et al. used CPI to probe the diffusely reflecting light predominately coming from deep mucosal layers.18,24 Though vascular contrast enhancement can be valuable, an inherent tradeoff of CPI is the loss of surface architecture due to the rejection of photons reflected off the tissue surface. Moreover, as the spatial resolution of white light imaging continues to improve through the development of higher-definition endoscopes, we must evaluate whether CPI would add a significant amount of information over those improvements. Regardless, a larger study is necessary to understand whether the tradeoff that enhances the ability to visualize deeper blood vessels would improve overall accuracy. VFI with proflavine contrast improves visualization of glandular architecture by providing contrast to epithelial cell nuclei. This is particularly important because glandular architecture changes during the progression to neoplasia.25 Previous studies using other modalities have shown that the assessment of such features can improve Barrett’s surveillance.12 Narrowband imaging reveals some glandular features that have been documented and have been used to identify neoplasia with high sensitivity12,13 but low specificity in identifying Barrett’s metaplasia.15 Since VFI uses a nuclear stain, it provides a more direct assessment of glandular architecture. The added benefit of using VFI is the potential for implementing high-resolution imaging at the same time, thus providing the ability to monitor nuclear changes at two different scales. For instance, the histology section presented in Fig. 6(e) was diagnosed as adenocarcinoma, but the histologically verified presence of both LGD and HGD within the regions, indicated by black boxes in Fig. 6(e), may be contributing to the overall heterogeneity in the VFI image shown in Fig. 6(c). A situation like this may prompt the endoscopist to use the HRME probe on a number of sites within the area imaged by VFI to understand the differences in proflavine signal and help determine, for example, the area to biopsy. The HRME allows for more detailed interrogation of glandular architecture and the examination of features such as nuclear size, shape, distribution, and crowding. Previous studies have shown that these features can be consistently identified in HRME images and correlate with the appearance observed in H&E stained histologic sections.19–21 Moreover, image processing algorithms have been developed for quantitative analysis of digital HRME images; initial pilot studies show high sensitivity and specificity for identifying neoplastic lesions,26 suggesting the potential to use HRME imaging together with algorithm-assisted identification of early cancers and high-grade dysplasia. Proflavine is the principal component of acriflavine, which has been used during in vivo fluorescence imaging in Europe and Australia without any noted adverse effects.27 Indeed, this investigational in vivo human study of confocal microscopy for gastrointestinal cancers uses topical acriflavine at 0.05% concentration, five times more than what is used for VFI and HRME imaging. Moreover, the agent has been clinically used as an antibacterial agent. In neonatal care, triple dye (a combination of brilliant green, proflavine hemisulfate, and gentian violet) is routinely used as a topical antibacterial agent on the umbilical stump of newborn babies,28 with a recent review of the practice categorizing toxicity as rare.29 In this pilot study, the proflavine concentration is significantly lower than that of commercial triple dye, 0.11% (w/v) (Kerr Triple Dye, Vista Pharm, Birmingham, Alabama). Though each of the presented modalities appears to improve the visualization of relevant mucosal changes, additional studies are needed to determine the overall in vivo effectiveness of each modality. Indeed, larger in vivo studies are needed to assess the sensitivity and specificity for detection of neoplasia for each modality and whether this represents an improvement over white light examination and standard four-quadrant biopsies. Thus, the development of an instrument that can easily implement these modalities in vivo is particularly useful. Testing each modality individually will help determine which imaging technique would be most useful to clinicians for in vivo surveillance; the result would be a potential candidate for widespread clinical testing. In the future, additional studies looking at both qualitative and quantitative image features are needed to investigate which are most relevant for endoscopic image interpretation. The module-based imaging technique presented here allows for the testing of new imaging modalities to determine feasibility quickly. This modular concept can be adapted to any video endoscope for the upper or lower gastrointestinal tract, thereby extending its utility to the detection of additional gastrointestinal abnormalities, such as colon and gastric cancers. Past widefield fluorescence imaging studies using contrast agents did not take full advantage of recent CCD advances, potentially limiting what mucosal features could be resolved. By using a filter module to image, we can maintain the benefits of the high-definition CCD () while enabling the examination of different optical markers of disease. Moreover, this dual-scale platform can be adapted to measure other molecular targets that have been used in the gastrointestinal tract with similar excitation and emission properties,30 such as 2-NBDG or other targeted fluorescence contrast agents.31,32 Furthermore, the signal associated with these fluorescent contrast agents can be quantified and used to aid in subjective image interpretation,26,30 thereby further increasing its potential as a surveillance tool. AcknowledgmentsWe acknowledge Pentax Medical’s assistance during implementation. We appreciate the work of Josephine Mitcham in coordinating patient accrual for this study. This work is supported through the National Institute of Health Academic Industrial Research Partnership Grant No. 1R01CA140257-01A1. ReferencesL. M. BrownS. S. DevesaW. H. Chow,
“Incidence of adenocarcinoma of the esophagus among white Americans by sex, stage, and age,”
J. Natl. Cancer Inst., 100
(16), 1184
–1187
(2008). http://dx.doi.org/10.1093/jnci/djn211 JNCIEQ Google Scholar
E. I. SihvoM. E. LuostarinenJ. A. Salo,
“Fate of patients with adenocarcinoma of the esophagus and the esophagogastric junction: a population-based analysis,”
Am. J. Gastroenterol., 99
(3), 419
–424
(2004). AJGAAR 0002-9270 Google Scholar
G. Portaleet al.,
“Modern 5-year survival of resectable esophageal adenocarcinoma: single institution experience with 263 patients,”
J. Am. Coll. Surg., 202
(4), 588
–596
(2006). http://dx.doi.org/10.1016/j.jamcollsurg.2005.12.022 JACSEX 1072-7515 Google Scholar
W. J. Blotet al.,
“Rising incidence of adenocarcinoma of the esophagus and gastric cardia,”
J. Am. Med. Assoc., 265
(10), 1287
–1289
(1991). http://dx.doi.org/10.1001/jama.1991.03460100089030 JAMAAP 0098-7484 Google Scholar
A. J. Cameron,
“Epidemiology of columnar-lined esophagus and adenocarcinoma,”
Gastroenterol. Clin. North Am., 26
(3), 487
–494
(1997). http://dx.doi.org/10.1016/S0889-8553(05)70308-3 GCNAEF 0889-8553 Google Scholar
K. K. WangR. E. Sampliner,
“Updated guidelines 2008 for the diagnosis, surveillance and therapy of Barrett’s esophagus,”
Am. J. Gastroenterol., 103
(3), 788
–797
(2008). http://dx.doi.org/10.1111/j.1572-0241.2008.01835.x AJGAAR 0002-9270 Google Scholar
M. Viethet al.,
“Histological analysis of endoscopic resection specimens from 326 patients with Barrett’s esophagus and early neoplasia,”
Endoscopy, 36
(9), 776
–781
(2004). ENDCAM Google Scholar
M. KaraR. S. DaCostaB. C. WilsonN. E. MarconJ. Bergman,
“Autofluorescence-based detection of early neoplasia in patients with Barrett’s esophagus,”
Dig. Dis., 22
(2), 134
–141
(2004). http://dx.doi.org/10.1159/000080312 DIDIEW 0257-2753 Google Scholar
M. A. Karaet al.,
“Endoscopic video autofluorescence imaging may improve the detection of early neoplasia in patients with Barrett’s esophagus,”
Gastrointest. Endosc., 61
(6), 679
–685
(2005). http://dx.doi.org/10.1016/S0016-5107(04)02577-5 GAENBQ 0016-5107 Google Scholar
M. A. Karaet al.,
“A randomized crossover study comparing light-induced fluorescence endoscopy with standard videoendoscopy for the detection of early neoplasia in Barrett’s esophagus,”
Gastrointest. Endosc., 61
(6), 671
–678
(2005). http://dx.doi.org/10.1111/j.1572-0241.2008.01835.x GAENBQ 0016-5107 Google Scholar
W. L. Curverset al.,
“Endoscopic tri-modal imaging for detection of early neoplasia in Barrett’s oesophagus: a multi-centre feasibility study using high-resolution endoscopy, autofluorescence imaging and narrow band imaging incorporated in one endoscopy system,”
Gut, 57
(2), 167
–172
(2008). http://dx.doi.org/10.1136/gut.2007.134213 GUTTAK 0017-5749 Google Scholar
M. A. Karaet al.,
“Detection and classification of the mucosal and vascular patterns (mucosal morphology) in Barrett’s esophagus by using narrow band imaging,”
Gastrointest. Endosc., 64
(2), 155
–166
(2006). http://dx.doi.org/10.1016/j.gie.2005.11.049 GAENBQ 0016-5107 Google Scholar
P. Sharmaet al.,
“The utility of a novel narrow band imaging endoscopy system in patients with Barrett’s esophagus,”
Gastrointest. Endosc., 64
(2), 167
–175
(2006). GAENBQ 0016-5107 Google Scholar
H. C. Wolfsenet al.,
“Prospective, controlled tandem endoscopy study of narrow band imaging for dysplasia detection in Barrett’s esophagus,”
Gastroenterology, 135
(1), 24
–31
(2008). http://dx.doi.org/10.1053/j.gastro.2008.03.019 GASTAB 0016-5085 Google Scholar
J. Mannathet al.,
“Narrow band imaging for characterization of high grade dysplasia and specialized intestinal metaplasia in Barrett’s esophagus: a meta-analysis,”
Endoscopy, 42
(5), 351
–359
(2010). http://dx.doi.org/10.1055/s-0029-1243949 ENDCAM Google Scholar
W. Groneret al.,
“Orthogonal polarization spectral imaging: a new method for study of the microcirculation,”
Nat. Med., 5
(10), 1209
–1212
(1999). http://dx.doi.org/10.1038/13529 1078-8956 Google Scholar
C. Balas,
“A novel optical imaging method for the early detection, quantitative grading, and mapping of cancerous and precancerous lesions of cervix,”
IEEE Trans. Biomed. Eng., 48
(1), 96
–104
(2001). http://dx.doi.org/10.1109/10.900259 IEBEAX 0018-9294 Google Scholar
D. Roblyeret al.,
“Multispectral optical imaging device for in vivo detection of oral neoplasia,”
J. Biomed. Opt., 13
(2), 024019
(2008). http://dx.doi.org/10.1117/1.2904658 JBOPFO 1083-3668 Google Scholar
N. Thekkeket al.,
“Vital-dye enhanced fluorescence imaging of GI mucosa: metaplasia, neoplasia, inflammation,”
Gastrointest. Endosc., 75
(4), 877
–887
(2012). http://dx.doi.org/10.1016/j.gie.2011.10.004 GAENBQ 0016-5107 Google Scholar
T. J. Muldoonet al.,
“High-resolution imaging in Barrett’s esophagus: a novel, low-cost endoscopic microscope,”
Gastrointest. Endosc., 68
(4), 737
–744
(2008). http://dx.doi.org/10.1016/j.gie.2008.05.018 GAENBQ 0016-5107 Google Scholar
T. J. Muldoonet al.,
“Subcellular-resolution molecular imaging within living tissue by fiber microendoscopy,”
Opt. Express, 15
(25), 16413
–16423
(2007). http://dx.doi.org/10.1364/OE.15.016413 OPEXFF 1094-4087 Google Scholar
M. PierceD. YuR. Richards-Kortum,
“High-resolution fiber-optic microendoscopy for in situ cellular imaging,”
J. Vis. Exp., 47 e2306
(2011). http://dx.doi.org/10.3791/2306 JVEOA4 1940-087X Google Scholar
M. C. Pierceet al.,
“Low-cost endomicroscopy in the esophagus and colon,”
Am. J. Gastroenterol., 106
(9), 1722
–1724
(2011). http://dx.doi.org/10.1038/ajg.2011.140 AJGAAR 0002-9270 Google Scholar
D. Roblyeret al.,
“Comparison of multispectral wide-field optical imaging modalities to maximize image contrast for objective discrimination of oral neoplasia,”
J. Biomed. Opt., 15
(6), 066017
(2010). http://dx.doi.org/10.1117/1.3516593 JBOPFO 1083-3668 Google Scholar
R. C. Haggitt,
“Barrett’s esophagus, dysplasia, and adenocarcinoma,”
Hum. Pathol., 25
(10), 982
–993
(1994). http://dx.doi.org/10.1016/0046-8177(94)90057-4 HPCQA4 0046-8177 Google Scholar
T. J. Muldoonet al.,
“Evaluation of quantitative image analysis criteria for the high-resolution microendoscopic detection of neoplasia in Barrett’s esophagus,”
J. Biomed. Opt., 15
(2), 026027
(2010). http://dx.doi.org/10.1117/1.3406386 JBOPFO 1083-3668 Google Scholar
A. L. Polglaseet al.,
“A fluorescence confocal endomicroscope for in vivo microscopy of the upper- and the lower-GI tract,”
Gastrointest. Endosc., 62
(5), 686
–695
(2005). http://dx.doi.org/10.1016/j.gie.2005.05.021 GAENBQ 0016-5107 Google Scholar
P. A. Janssenet al.,
“To dye or not to dye: a randomized, clinical trial of a triple dye/alcohol regime versus dry cord care,”
Pediatrics, 111
(1), 15
–20
(2003). http://dx.doi.org/10.1542/peds.111.1.15 PEDIAU 0031-4005 Google Scholar
T. P. McConnellet al.,
“Trends in umbilical cord care: scientific evidence for practice,”
Newborn Infant. Nurs. Rev., 4
(4), 211
–222
(2004). http://dx.doi.org/10.1053/j.nainr.2004.09.004 1527-3369 Google Scholar
N. Thekkeket al.,
“Pre-clinical evaluation of fluorescent deoxyglucose as a topical contrast agent for the detection of Barrett’s-associated neoplasia during confocal imaging,”
Technol. Cancer Res. Treat., 10
(5), 431
–441
(2011). TCRTBS 1533-0346 Google Scholar
M. GoetzT. D. Wang,
“Molecular imaging in gastrointestinal endoscopy,”
Gastroenterology, 138
(3), 828
–833
(2010). http://dx.doi.org/10.1016/j.gie.2012.08.029 GASTAB 0016-5085 Google Scholar
S. LuT. D. Wang,
“In vivo cancer biomarkers of esophageal neoplasia,”
Cancer Biomark., 4
(6), 341
–350
(2008). CBAIBM 1574-0153 Google Scholar
|


