

|
|
|
In vivo whole animal luminescence imaging is a useful technique as it helps to understand human diseases, drug development and discovery, and target validation.1,2 In both bio- and chemiluminescence imaging, the spatial resolution is severely limited by the optical scattering nature of tissue. To improve spatial resolution hybrid approaches which combine the advantages of ultrasonic and optical imaging can be applied.3–8 In photo-acoustic tomography (PAT), ultrasound (US) waves are excited by irradiating tissue with nanosecond scale pulses of light. Optical absorption by tissue chromophores, such as haemoglobin, produces a small temperature rise; which leads to an initial pressure increase followed by relaxation, resulting in the emission of broadband low amplitude acoustic waves. A PAT image can be regarded as an US image in which the contrast depends on the optical absorption properties of the tissue.4 In US modulated optical tomography (USMOT), light illuminates the tissue and US is used to modulate the light within the tissue. The detected modulated optical signal at each US scan position is used to form an image. Three main modulation mechanisms have been described:3 (1) US induced variation of the optical properties due to compression and rarefaction of the medium, (2) modulation of the optical phase due to US displacement of scatterers, and (3) modulation of the optical phase due to US modulation of the refractive index. The latter two are effects that can only be observed when using coherent light. As only incoherent light is used in bio- and chemiluminescence imaging, mechanism number 1 causes the US modulation of luminescence. To date, USMOT has not been able to replicate the high quality blood vessel images obtained by PAT. However, USMOT can provide additional or complementary information through imaging tissue scattering5 or directly mapping fluorescence in 3D.6–8 This work demonstrates, to our knowledge, the first implementation of US modulated luminescence tomography (USMLT) in which imaging resolution can be improved by using US to modulate luminescence generated within an optically scattering medium. In this scenario, PAT cannot be applied as the light source is generated internally within the tissue and an external light source is redundant. In the experiment (Fig. 1), a signal generator (Tektronix AFG3022B) and an RF power amplifier (Amplifier Research 150A100B) provide continuous wave excitation of a focused 1 MHz US transducer (Olympus Panametrics V314 NDT, 2.54 cm focal length). The US is focused at a position close to, but not on, a luminescent target. Although ideally the focus would be on the target, the offset position is to ensure that the US is not distorted by the target which is not acoustically matched to the background medium. A water tank sits on a computer controlled motorized stage (Standa 8MT175-50). A photomultiplier tube (PMT, Hamamatsu H5783-20) situated 8 cm from the surface of the gel tissue phantom is employed as a detector with an aperture () in front to control the detected light level. The PMT signal is fed into an amplifier (Stanford Research Systems SR445A), followed by an oscilloscope (OSC, Tektronix TDS2024B 8-bit ADC) for DC measurement and to a lock-in amplifier (LIA, Stanford Research Systems SR844) for AC measurement. The input impedance of the SR445A is 500 Ω which provides a 3 dB bandwidth for the PMT and amplifier of 3 MHz. The LIA has a 10 s time constant, 12 dB filter slope, and a full scale sensitivity of (rms: root mean square). The LIA is synchronized with the system by using the US drive signal as a reference. The typical peak pressure of the US is 0.42 MPa (measured using a Precision Acoustics 1705 hydrophone, 1 mm diameter needle). The targets are 1-mm-diameter, 5-mm-long clear polyamide tubes filled with a chemiluminescent material (mixture of the dye, diphenyl oxalate and hydrogen peroxide, used in the consumer market within “glow sticks”) which emits at a center wavelength of 550 nm. The targets are embedded at a depth of 7 mm within an , , and tissue phantom made from agarose gel mixed with polystyrene microspheres (scattering coefficient , anisotropy factor ). No additional absorption is added and so the absorption coefficient is comparable to that of water.9 Two line-scans, each taking , are carried out by scanning the sample along the -axis, the first with a single chemiluminescent target and the second with two chemiluminescent targets displaced by 5 mm. Fifty measurements are acquired at each position to provide an average value with error bars (standard deviation of the data). AC and DC line-scans, normalized by their maximum values after subtracting the noise floor (), of the single luminescent target are shown in Fig. 2. USMLT (AC trace) produces superior imaging resolution [full width half maximum ] compared to the conventional DC light line-scan (). Line-scans of the sample containing two luminescent targets are shown in Fig. 3. Figure 3(a) and 3(b) shows the normalized AC and normalized DC scans, respectively. USMLT can clearly resolve two objects which cannot be resolved in the DC light scans with a signal to noise ratio (SNR) of (, where and are the signal and noise voltages, respectively). After 3 h, both the AC and DC scans are approximately 4 times weaker than the original signal but the two targets can still be resolved in the AC image with an AC SNR of . Lateral resolution could be further improved by using higher frequency US, improved axial resolution could be obtained using pulsed US, albeit at the expense of SNR. Fig. 1Experimental setup. UST: ultrasound transducer; PMT: photomultiplier; I-V: transimpedance amplifier; LIA: lock-in amplifier; and OSC: oscilloscope. 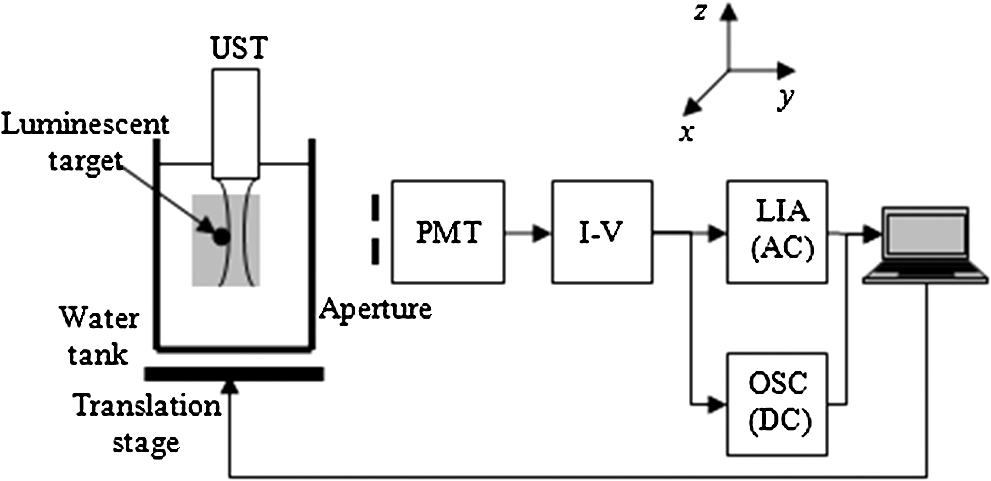 Fig. 2Scan of a single luminescent target (diameter 1 mm) embedded at the mid-plane of a scattering medium (, , and ). 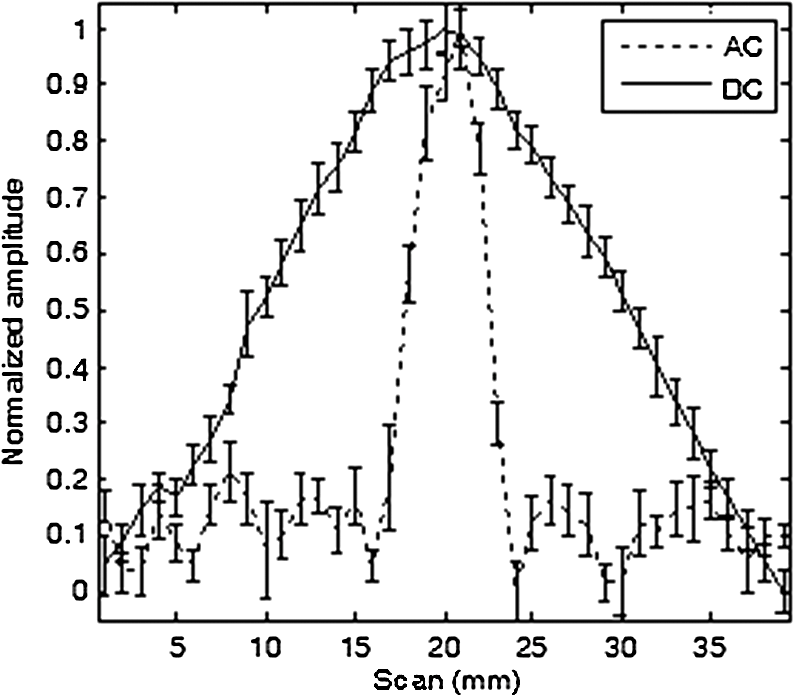 Fig. 3Scan of two luminescent targets (diameter 1 mm and separation 5 mm) embedded at the mid-plane of a scattering medium (, , and ). (a) AC measurement. (b) DC measurement.  As discussed, when incoherent light is generated within the sample (with no external optical excitation) the ideal position of the US focus is over the target. To better understand image formation and spatial resolution, it is useful to consider an isotropic point source of luminescence generated within the scattering medium which diffuses through the sample. US modulation of the light at the point source produces the maximum modulation of the signal. Modulating the light using an US focus offset from the source reduces the amount of light that passes through the US focal zone and hence the detected signal. For example, using a Monte Carlo model of light propagation for the optical properties and geometry used in the experiment, the proportion of light reaching a 1 mm diameter area (representing the US focus) situated 1 mm away from the luminescent point source is only 6.3%. Even though this is a relatively small proportion, it has a detrimental effect on the spatial resolution as light produced away from the US focus can still be modulated and contribute to the detected signal. However, due to diffusion this contribution reduces as the US focus moves away from the source of bioluminescence. A useful indication of the additional degradation in spatial resolution due this effect can be obtained from the diffusion length which in this case is 1.5 mm. Having demonstrated the potential of USMLT in a phantom it is highly pertinent to discuss whether it could be practically applied in preclinical models. Light levels obtained from the single luminescent target are used to estimate the AC light collection capability of the system. Based on a geometrical calculation, placing an optical power meter (Thorlabs Pm 120) directly in front of the target, with no scattering medium present, collects of the emitted light. A reading of 4 nW indicates that is being emitted isotropically by the target. According to Ref. 10, the photon flux emitted from a single bioluminescent bacterium is approximately photons per second. This is equivalent to at 550 nm (Power , where is the number of photons/sec, is Planck’s constant, is the optical frequency). Thus, a bioluminescent sample containing bacteria within 4 μL (5-mm-long cylindrical tube with 1 mm diameter) can be detected by the system with a SNR of 2 (based on the measured system noise floor of ). This is equivalent to a concentration of which is comparable to the typical concentration in bioluminescence imaging ().3,11 A Monte Carlo simulation was carried out to further investigate the detected light levels for typical bacteria concentrations at different bioluminescent wavelengths. A murine model is simulated as an infinite slab geometry which has the bioluminescent source positioned in the center, a thickness of 2 cm with the optical properties shown in Table 1. SNR is calculated based on the measured noise floor of the experimental system and to estimate the minimum detectable bacteria concentration, we set an . Table 1, column 5 shows the minimum concentration of bacteria required to obtain an for the detector employed in the experiment. SNR could be increased by employing a larger diameter detector, e.g., Table 1, column 6 shows the minimum detectable concentration for a detector diameter of 2 cm. Longer wavelength bioluminescence is useful as the absorption of haemoglobin is low in the near infrared. The larger detector allows a further reduction in the minimum detectable bacteria concentration. It has also been suggested that SNR could be further improved by the use of microbubbles8 which we will explore in further experiments. USMLT enables imaging of luminescent targets within turbid media at higher resolution compared to DC imaging. In this case PAT cannot be applied as it relies on absorption of light from an external source. In bio- and chemiluminescence imaging the light is generated within the tissue without requiring an external source. Table 1Optical properties12,13 of the samples (thickness=2 cm) at different wavelengths. The minimum detectable bacteria concentration is based on an SNR threshold of 2 and a measured experimental noise floor of 0.4 μVrms. D is the diffusion length, assuming g=0.8.
AcknowledgmentsThis work was supported by the Biotechnology and Biological Sciences Research Council UK (BB/F004826/1 and BB/F004923/1). Thanks to Dr. Diwei He for helpful discussions. ReferencesA. Rodaaet al.,
“Bio- and chemiluminescence imaging in analytical chemistry,”
Anal. Chim. Acta, 541
(1–2), 25
–36
(2005). http://dx.doi.org/10.1016/j.aca.2004.11.083 ACACAM 0003-2670 Google Scholar
K. R. Zinnet al.,
“Noninvasive bioluminescence imaging in small animals,”
ILAR J., 49
(1), 103
–115
(2008). http://dx.doi.org/10.1093/ilar.49.1.103 IJLOAC 1084-2020 Google Scholar
L. V. Wang,
“Mechanisms of ultrasonic modulation of multiply scattered coherent light: a Monte Carlo model,”
Opt. Lett., 26
(15), 1191
–1193
(2001). http://dx.doi.org/10.1364/OL.26.001191 OPLEDP 0146-9592 Google Scholar
P. Beard,
“Biomedical photoacoustic imaging,”
Interface Focus, 1
(4), 602
–631
(2011). http://dx.doi.org/10.1098/rsfs.2011.0028 Google Scholar
P. X. Laiet al.,
“Real-time monitoring of high-intensity focused ultrasound lesion formation using acousto-optic sensing,”
Ultrasound Med. Biol., 37
(2), 239
–252
(2011). http://dx.doi.org/10.1016/j.ultrasmedbio.2010.11.004 USMBA3 0301-5629 Google Scholar
N. T. Huynhet al.,
“Effect of object size and acoustic wavelength on pulsed ultrasound modulated fluorescence signals,”
J. Biomed. Opt., 17
(7), 076008
(2012). http://dx.doi.org/10.1117/1.JBO.17.7.076008 JBOPFO 1083-3668 Google Scholar
B. YuanY. Liu,
“US-modulated fluorescence from rhodamine B aqueous solution,”
J. Biomed. Opt., 15
(2), 021321
(2010). http://dx.doi.org/10.1117/1.3333546 JBOPFO 1083-3668 Google Scholar
B. Yuan,
“US-modulated fluorescence based on a fluorophore quencher-labeled microbubble system,”
J. Biomed. Opt., 14
(2), 024043
(2009). http://dx.doi.org/10.1117/1.3120493 JBOPFO 1083-3668 Google Scholar
R. M. PopeE. S. Fry,
“Absorption spectrum (380-700 nm) of pure water. II. Integrating cavity measurements,”
Appl. Opt., 36
(33), 8710
–8723
(1997). http://dx.doi.org/10.1364/AO.36.008710 APOPAI 0003-6935 Google Scholar
E. A. Widder,
“Bioluminescence in the ocean: origins of biological, chemical, and ecological diversity,”
Science, 328
(5979), 704
–708
(2010). http://dx.doi.org/10.1126/science.1174269 SCIEAS 0036-8075 Google Scholar
J. Dragavonet al.,
“In vivo excitation of nanoparticles using luminescent bacteria,”
Proc. Natl. Acad. Sci. U. S. A., 109
(23), 8890
–8895
(2012). http://dx.doi.org/10.1073/pnas.1204516109 PNASA6 0027-8424 Google Scholar
K. Calabroet al.,
“Gender variations in the optical properties of skin in murine animal models,”
J. Biomed. Opt., 16
(1), 011008
(2011). http://dx.doi.org/10.1117/1.3525565 JBOPFO 1083-3668 Google Scholar
G. AlexandrakisF. R. RannouA. F. Chatziioannou,
“Tomographic bioluminescence imaging by use of a combined optical-PET (OPET) system: a computer simulation feasibility study,”
Phys. Med. Biol., 50
(17), 4225
–4241
(2005). http://dx.doi.org/10.1088/0031-9155/50/17/021 PHMBA7 0031-9155 Google Scholar
|


