
|
|
1.IntroductionThe accurate and complete removal of tumor, with minimal removal of healthy surrounding tissue, is guided by the examination of pathology. The preparation of pathology, either during surgery or after, is time-consuming and labor-intensive. In the setting of nonmelanoma skin cancers, frozen pathology that is prepared during Mohs surgery requires 20 to 45 min per excision, and two or more excisions are performed, such that the total preparation time lasts from two to several hours.1 In other settings such as with head-and-neck and breast cancer, fixed pathology is prepared after surgery. Preparation of fixed sections requires one to two days. Since it takes such a long time to obtain pathology results, the patient is sent home immediately after surgery. If the pathology shows positive tumor margins, the patient must undergo additional surgery (resection), and/or radiotherapy or chemotherapy. The incomplete removal of tumor and positive margins are reported to occur in 20 to 70% of patients, depending on the surgical setting.2,3 Although the rates of resections can be reduced by aggressive removal of tissue from a wide margin around the tumor, it can affect the functionality of the organ or produce unacceptable aesthetical results for the patient. Therefore the objective is to minimize the removal of healthy tissue by reducing the margins and still perform complete removal of the tumor. To address this problem, high-resolution optical imaging methods capable of displaying nuclear and cellular morphology, offer the possibility for rapid detection of tumors in large areas of freshly excised or biopsied tissue. Currently, confocal microscopy, full-field optical coherence tomography, multispectral macro-imaging, multiphoton microscopy, fluorescence lifetime imaging and other approaches are being developed for this purpose.4–16,17 We have been developing confocal mosaicing microscopy as a technology platform for imaging tumor margins in fresh tissue excisions from surgery2,3,13–15 to provide high-resolution images of large areas of tissue within minutes. Previously, we collected square-shaped images with aspect ratios of , and stitched them together with custom software into a mosaic to display a large field of view. Mosaicing of images to display of excised tissue from Mohs surgery was demonstrated in 9 min.13–15 In a blinded examination of 45 fluorescence mosaics by two Mohs surgeons, basal cell carcinoma margins were detected with an overall sensitivity of 96.6% and a specificity of 89.2%.18,19 The results of this preclinical study demonstrated the promise of confocal mosaicing microscopy. Although 9 min is certainly faster than the hours or days required for preparing conventional (frozen or fixed) pathology, routine implementation in surgical settings will require shorter processing times. The unequivocal feedback from surgeons was that this technology was unlikely to be adopted unless the speed was improved. The clear expectation was that to reach practical and routine use in any operating room setting, mosaicing must meet the surgeons’ need to examine tumor margins in large areas () within a few minutes. To address this need we designed a faster approach called “strip mosaicing.” The initial instrumentation work for strip mosaicing was reported last year.20 Strip mosaicing is performed with a combination of optical and mechanical scanning. The tissue is mechanically translated across a linearly scanned focused laser beam. This approach is faster because the speed of mosaicing strips is primarily governed by the fast line acquisition rate in the confocal microscope20 and does not use the single frame acquisition method previously reported.14,18 In this paper, we report further advances and enhancement of the electronics and mechanics, the development of custom software, and the overall integration of hardware and software into an approach that demonstrates imaging of of human skin tissue with 1-μm lateral resolution in 90 s and of breast tissue with 0.8-μm lateral resolution in 13 min. The enhancements include a device to mount and flatten fresh tissue from surgery, improvements in the tissue translation stage for speed, accuracy and precision, synchronization of the optical and mechanical scanning to optimize alignment among and registration of strips, and stitching of image strips in parallel with acquisition using custom software. 2.Materials and Methods2.1.Mosaicing MethodOur previous mosaicing method required stitching square-shaped images, with aspect ratio, in two dimensions, as shown in Fig. 1(a). The newly developed method acquires rectangular-shaped long strips of images,20 with aspect ratio for a 10-mm long strip, and stitches along the length of the strip as shown in Fig. 1(b). The elimination of a stitching dimension reduces the processing time and the artifacts due to illumination fall-off by half. Fig. 1Comparison of mosaicing concepts: (a) mosaicing of square-shaped images in two dimensions; (b) mosaicing of rectangular-shaped long strips in one dimension (this figure is reproduced from Ref. 20). 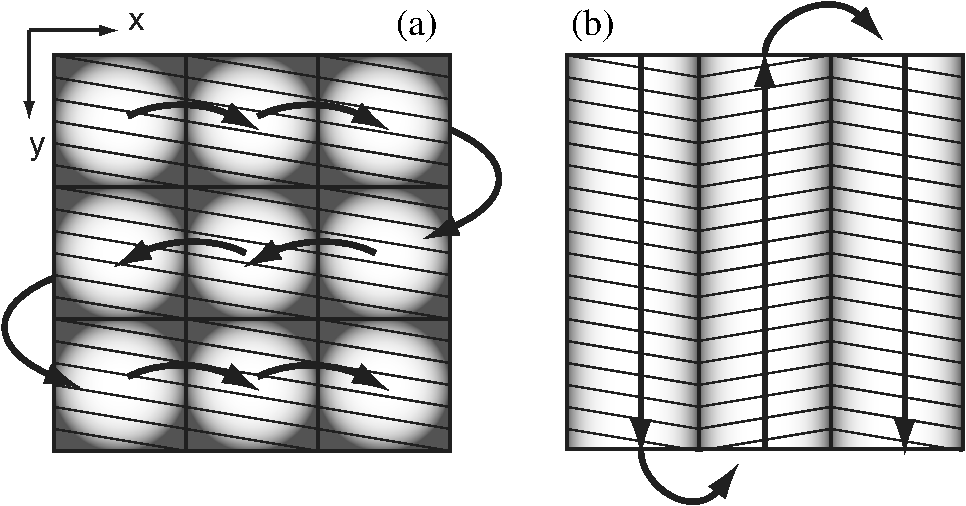 The strip mosaicing scheme, with combined optical and mechanical scanning, is shown in Fig. 2. The fast optical scanner produces a scan-line (in the direction) that defines the width of a strip. Scanning the length of the strip (in the direction) is performed by translating the stage in the direction orthogonal to the line. When the acquisition of a strip image is completed (“forward scan” in direction), the stage moves in the direction a distance equal to or less than the width of the strip. Then the stage moves along the strip length but in the opposite direction (“return scan”), and another strip image is acquired. This process of acquiring strip images, sequentially in opposite directions (forward scan followed by return scan) is repeated until the entire tissue is imaged. The aspect ratio of a strip is restricted only by the mechanical limits of the scanning stage. Fig. 2Schematic of the strip-scanning mechanism. The fast optical scan ( axis scan) defines the width of a strip. The slow mechanical scan along the length of the strip ( axis scan) is performed by translating the stage in the direction orthogonal to the axis. When the acquisition of a strip image is completed (“forward scan”), the stage moves in the direction a distance equal to or less than the width of the strip. Then the stage moves along the strip length, but in the opposite direction (“return scan”), and another strip image is acquired. This process of acquiring strip images is repeated until the entire tissue is imaged.  2.2.Instrumentation2.2.1.Confocal microscopeOur system is based on a modified breadboard version of a commercial confocal microscope (Vivascope 2000, Lucid Inc, Rochester, NY). Details are available in our earlier papers.13–15,18,19 The microscope is set up to acquire images in fluorescence. The microscope is in an inverted configuration designed to image excised or biopsied tissue ex vivo. The illumination is from a 488-nm laser that delivers on the tissue. A 24-sided polygonal mirror scans the laser in the direction sweeping a line at through a , 0.75 numerical aperture (NA) water immersion objective lens (StableView, Lucid Inc.) The length of the scanned line, which defines the width of the strip, is 485 μm. The theoretical lateral resolution, according to the Rayleigh criterion, is 0.4 μm (Airy radius) and the expected diffraction-limited optical sectioning is 2.3 μm. The objective lens is custom-designed to image through a 1-mm-thick glass slide. In normal operation, this line is optically scanned in the orthogonal direction ( direction) by a galvanometrically driven mirror to produce a square image. To acquire a long rectangular-shaped strip image, we center and lock the position of the stop the galvanometric scanner. 2.2.2.Mechanical stageThe mechanical specifications of the translation stage, such as straightness, flatness, repeatability and accuracy are important factors for long strip scans. We use a high-quality dual-axis stage (BioPrecision2, Ludl Electronics Products, Hawthorne, NY) to mechanically translate the tissue with respect to the objective lens. The straightness and flatness of this stage is . Therefore, for a translation of 10-mm travel, the maximum deviation in straightness is 0.8 μm between any two strips. This is well within the overlap between any two strips. The maximum deviation in flatness is also within the optical sectioning of 2.3 μm. The translation stage is equipped with a position encoder (MAC5000, Ludl). The encoder outputs are sent to a fast data acquisition card for synchronization in real time. The commands to initiate and control the movement of stages are sent to the controller through a USB bus. 2.2.3.Synchronization of strips in the y directionIn our earlier configuration,20 the translation stage mechanical scan (slow scan in direction) was driven by a stepper-motor without a position encoder. We accomplished the synchronization of the polygon driven optical scan (fast scan in direction) and the translation stage mechanical scan (slow scan in direction) by counting the steps from the stepper-motor. This method turned out to be unreliable. We observed mismatch of up to 75 lines, between any two strips, due to missing steps in the motors and the resulting lack of position accuracy. This mismatch was corrected with software during stitching of the strips but at the expense of more computer processing and increased time for creating mosaics. However, the current position synchronization in the direction reduces the work of the stitching algorithm, thus reducing the time required to complete the mosaic. The synchronization mechanism that we report in this paper ensures that the theoretical maximum mismatch between any two strips is one line in the direction. Figure 3 shows the synchronizing scheme for the strips. Fig. 3The synchronizing scheme for the strips. A translation stage cycle consists of two mechanical movements that produce two image strips: the “forward scan” to , and the “return scan” to . The velocity profiles are depicted in red for the forward movement, and blue for the return. The image is acquired within the constant velocity portion (d), between and , of the scans. This avoids distortion of the mosaic due to compression or elongation of pixels. Therefore, we choose a scan distance (D) for the translation stage such that the region of constant velocity (d) is larger than the size of the tissue sample. After the forward scan is initiated and the stage reaches , the “position trigger” signal is asserted to arm the counter that monitors horizontal synchronization pulses (HSYNC) from the asynchronous optical scanner. When the HSYNC counter receives the next HSYNC pulse, the data acquisition begins. When the stage reaches , the HSYNC counter resets and the acquisition continues until the last line is complete in the strip image. Then the stage decelerates and stops at . Once the translation stage moves in the direction to a predetermined position that sets the width of the strip and the overlap between adjacent strips, the return scan is initiated from to . It follows a similar mechanism to the forward scan. This cyclical process, forward scan and return scan, is repeated until the entire tissue is imaged.  2.2.4.Tissue flattening and stage levelingIn order to image a large area, the surface of the tissue is scanned in a two-dimensional (2-D) “image plane,” which is perpendicular to the optical axis of the objective lens in the microscope (Fig. 4). However, surgically excised tissue has a three-dimensional (3-D) topography with varying shape and size. Furthermore, the tissue has variable mechanical compliance; for example, skin tissue is relatively stiff whereas breast tissue is soft and gel-like. This requires that the tissue surface be flattened onto a 2-D plane that conforms to the image plane of the microscope [Fig. 4(c)]. For this purpose we designed a tissue flattening and mounting device, as shown in Fig. 4(a). Fig. 4Schematic representation of the tissue-flattening device: (a) 2-D view of the tissue (in red) inside the cassette in its natural shape, as often seen in Mohs surgical excisions, with the edges curved up from the image plane and the lower (to be imaged) surface not flattened. The cassette is shown to be open with no force is applied to the water-filled bladder; (b) view of the closed tissue-cassette before mounting on the tip-tilt plate; the thumbscrews A, B, and C can be used to adjust the tip and tilt of the image plane relative to the optical axis, so as to orient the two at exactly 90 deg to each other; (c) schematic representation shows how the tissue is flattened, relative to the image plane and optical axis, by the water filled bladder when force is applied to it. 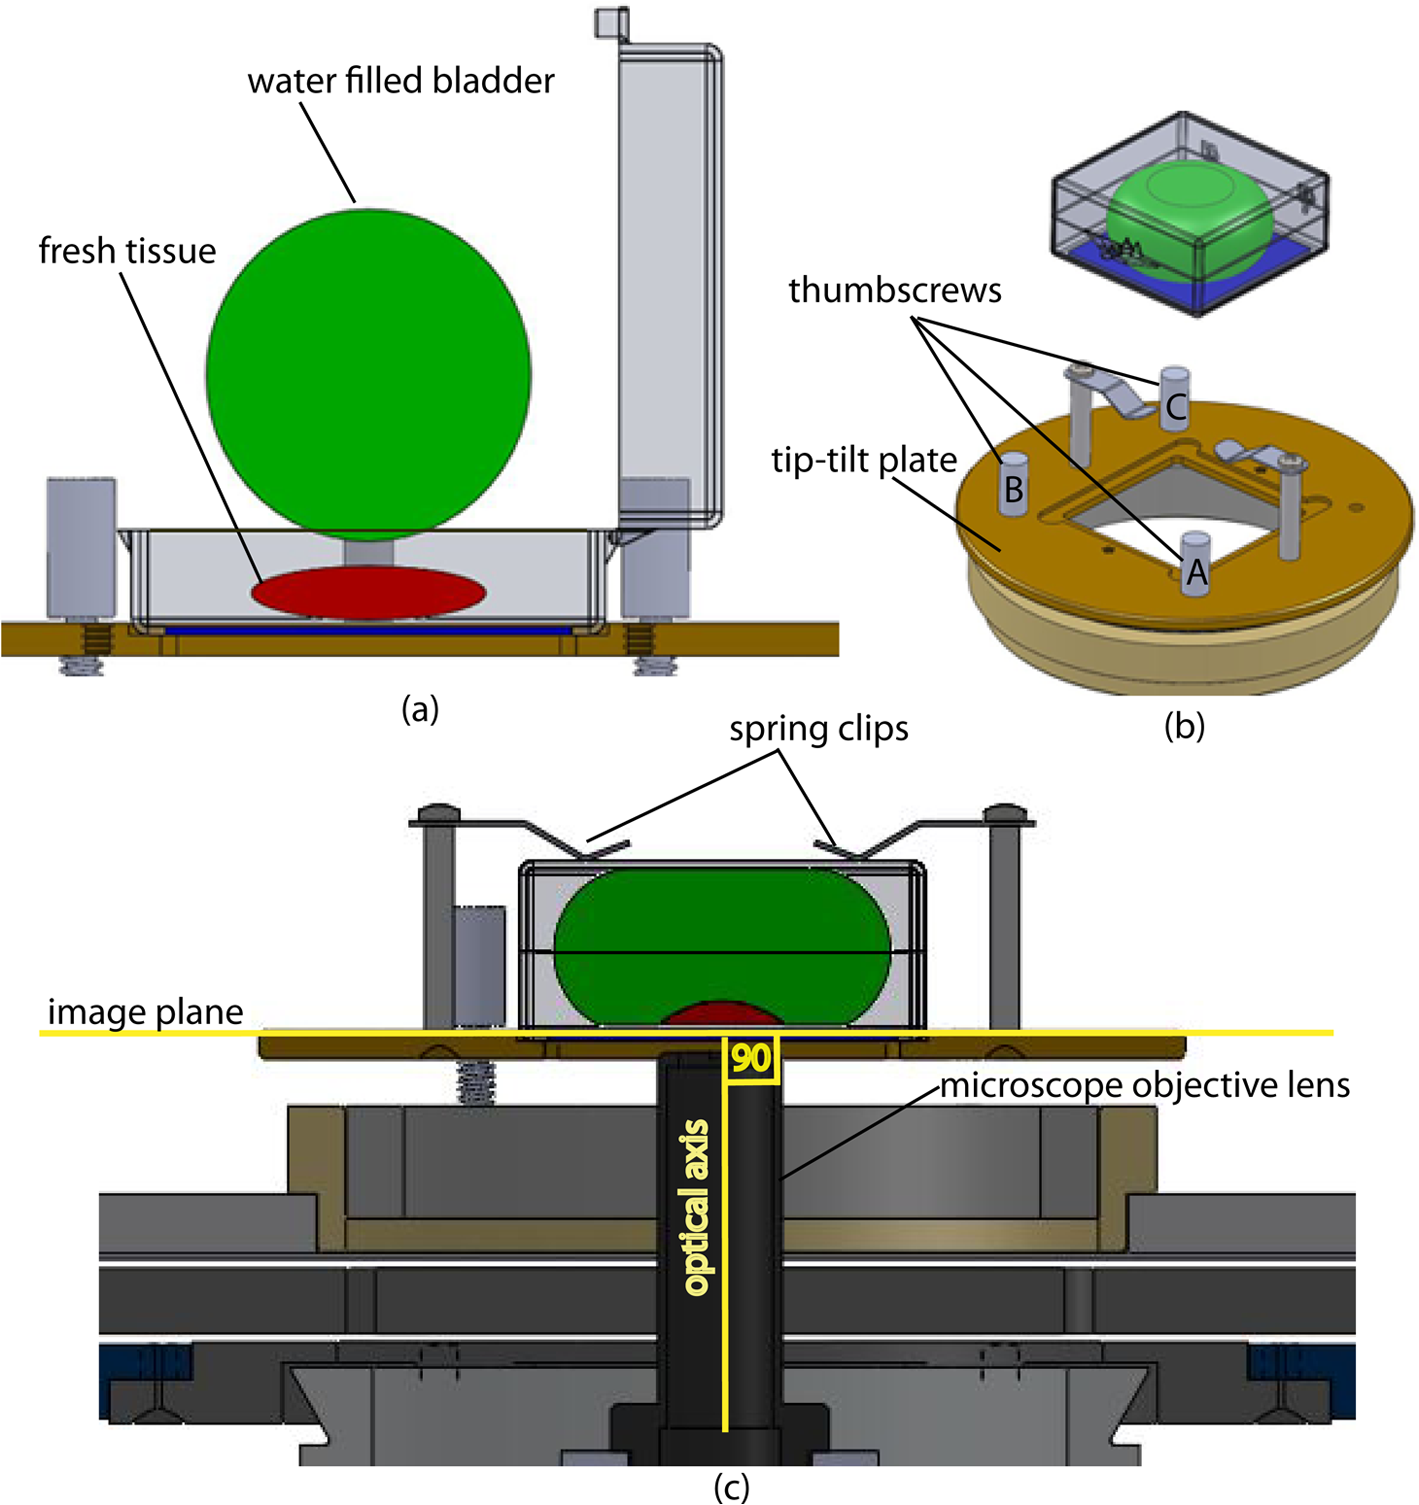 We use a rubber bladder filled with water to flatten the tissue onto a 1-mm-thick BK7 window inside a cassette Fig. 4(a). To flatten the desired (lower) surface, the user places the tissue at the center of the cassette, the water-bladder on top and closes the cassette cover. Then the tissue-cassette is placed on the tip-tilt plate, secured with two spring-loaded clips and placed on the microscope. Acquisition of a large number of images over a large area at constant depth requires the imaging and scanning planes to be coincident. This is obtained by adjusting the tip-tilt plate with spring-loaded thumbscrews [Fig. 4(b)]. The three thumbscrews are placed at right angles to each other, and tip/tilt can be adjusted by initially turning either thumbscrew A or C [Fig. 4(a)], while observing images of the glass window at four corners. The image of the window may be either a circular spot when focused on the surface or a ring due to field curvature when focused past the glass. This adjustment is performed in an iterative manner until the images at the four corners appear identical to each other. This device and the alignment method allow large tissues to be matched to the image plane of the microscope, and enables mosaicing over large areas. The mounting of the tissue cassette and the adjustment of the tip-tilt are robust enough to allow repeatable operation during extended periods without the need to realign. 2.2.5.Tissue preparationDiscarded excisions skin and breast tissues were obtained under two IRB-approved protocols. The Dermatology Service provided discarded tissue from Mohs surgery, and breast tissue was obtained from The Evelyn H. Lauder Breast Center at Memorial Sloan-Kettering Cancer Center (MSKCC). Details about collection and handling of the tissues from Mohs surgery and staining methods have been extensively described in our earlier papers.14,21 The staining of nuclear morphology is accomplished by soaking the tissue in 0.6-mM acridine orange for 30 s for skin tissue and 1 min for breast tissue, followed by rinsing the excess with isotonic phosphate buffered saline solution. 2.3.Acquisition of MosaicsFor acquisition of mosaics, the resolution is set in our acquisition system to the level of nuclear and other morphologic detail needed to match standard histology. While relatively lower resolution may be adequate for imaging skin tissue, higher resolution is needed to analyze breast tissue. The images are acquired in LabView and displayed in 8-bits. The 8-bit pixel depth was chosen because of our previous experience and for practical reasons. Clinical results from our previous studies18,19 have validated that 8-bits are sufficient for this particular application. Our Mohs surgeons found the quality of the resulting images to be clinically acceptable and were able to evaluate mosaics, in a manner similar to their reading of histopathology, with sensitivity of 96.6% and specificity of 89.2%. Another consideration is that 8-bit mosaics of large areas produce images of 300 to 400 MB. Increasing the depth to 16-bits would double their size making them difficult to manipulate. Such large image files pose practical challenges for subsequent processing and storing. This is further addressed in Sec. 2.5 on display of mosaics. The fluorescence images are captured with a fast DAQ card (PCI-6115 and Labview, National Instruments, Austin TX). The captured image strips are stitched with custom software developed by our group. 2.3.1.Mosaics of skin tissueThe acquisition time is limited by the speed of the optical (polygon) scanning rate of . The line is sampled with a 6.5-MHz pixel clock. Our theoretical lateral resolution (Airy radius) is . For the resulting spot diameter of , adequate sampling requires two lines per resolvable distance, which requires the speed of the mechanical stage to be less than []. However, we scan our stage at choose to under-sample by a factor of about 4.7 to reduce the acquisition time. This results in a pixel size of in both and directions. This is adequate for the interpretation of images of skin by Mohs surgeons and pathologists, as was explained in our earlier paper.20 Once the scan is completed, the stage moves 400 μm laterally, leaving approximately a 19% overlap between any two strips. We repeat this process until the tissue is fully scanned. 2.3.2.Mosaics of breast tissueThe evaluation of breast tissue demands higher lateral resolution. To achieve a higher resolution, we slowed the polygon scan speed to 6.5 kHz, while holding sampling pixel clock at 6.5 MHz, thus slowing the acquisition time of a strip. To maintain adequate sampling, we must scan the mechanical stage at []. However, we move the stage at , which results in under-sampling of about 3.8. At this stage speed, the resulting pixel size is in both and directions. The lateral move of the stage is 480 μm. 2.4.Stitching of Image StripsA stitching algorithm was written in Matlab (R2011a, Mathworks, Inc.) to automatically register image strips in the order in which they are collected. The stitching algorithm has three parts: a registration algorithm, an intensity fall-off correction, and blending in the overlap region between the two strips. The strip-scanning method, as compared with the traditional mosaicing method, simplifies registration of images, as each image needs to be registered to only one neighbor instead of two. Strips are registered pair-wise using a phase correlation method chosen for speed and ease of implementation, as it is easily computed by fast Fourier transform (FFT). Computing the phase correlation between the two images produces a 2-D matrix of correlation values where the coordinate of each value in the correlation matrix corresponds to a possible offset between the two images. The correlation value is maximal at the coordinate at which the same features in the two images overlap. But, because the correlation of two rectangular functions (such as two images) is a triangle function, the correlation is biased toward solutions near zero offset between the two images (the peak of the triangle). The bias is removed in the direction by dividing the phase correlation matrix by a triangle function. The removal of the bias emphasizes the noise near the edges of the correlation matrix, where solutions of maximal offset between the two images lie. Solutions of maximal offset correspond to no overlap between the images. Because we expect the images to overlap by an amount that is set by the stage motors, we can exclude solutions outside of the expected range. Therefore coordinates in the noisy region near the edges of the correlation matrix are excluded from the search region. In the direction, we expect solutions near zero offset, and therefore the removal of the bias was determined to be unnecessary along the direction. The solution for offset and offset between the two images is found by determining the maximum of the correlation matrix after the bias has been removed and the edges of the matrix have been excluded from the search region. Performing a 2-D FFT on very large images requires a large amount of memory. In practice, only a small section of the strip is required to perform registration, as long as the chosen length of the section is greater than the offset between the two strips. The chosen strip section must contain features to register. In our setup, the tissue lies in the center of the glass window. Hence, a section that is 10 to 30% the length of the strip is chosen from the center region of each strip. This also serves the purpose of restricting the possible offset solutions to those that we know are most likely to be a good match. The search region is further restricted to coordinates near that expected from our knowledge of the stage motion. Generally, an apodizing window function is applied to an image before performing a phase-correlation algorithm to reduce high-frequency edge effects. However, in this case, the illumination fall-off across the strips serves this purpose. The illumination fall-off is corrected after the registration algorithm is applied. Because the optical scanning through the objective lens is in one dimension only, the illumination fall-off is along only the direction of each strip. The fall-off is corrected by averaging each strip along its length, normalizing, and dividing each line in the strip by the normalized average fall-off profile of the strip. In the overlap region between strips, the strips are blended by a weighted average of the overlapping pixels determined by the pixel distance to the edge of the strip. Pixels close to the edge of the strip are weighted less than pixels farther away. The result is a seamless mosaic, with more weight given to pixels near the center of the strip and less weight given to pixels near the edges of the strip. 2.5.Display of MosaicsThe mosaics are displayed in 8-bits on a large monitor with (30-in. flat-screen Dell 222–7175, with a GeForce 8800 GTS video card).When histopathology is examined with a bright field microscope, using, typically, a , 0.08NA objective lens with white light illumination, the observed field of view (FOV) is 10 mm with resolution. This FOV consists of approximately assuming one pixel per one optical resolution point. Our display matches this standard -view of histopathology. Zooming allows one to view submosaics at full resolution, mimicking the pathologist’s ability to switch to higher magnifications when necessary. Our Matlab program can easily manage the manipulation and display of mosaics of FOV . However, for larger mosaics, the program exhausts allowed allocated memory in our current system. (Potential future implementation at the bedside in, say, diverse and low-resource settings may require alternative practical and lower-cost approaches. One approach, for example, is scaling large mosaics to smaller size, while maintaining pathology-equivalent , which results in final size of 3 to 4 MB. This approach has been validated for adequate clinical quality and sensitivity and specificity by our Mohs surgeons.18,19 3.ResultsFigures 5Fig. 6Fig. 7Fig. 8Fig. 9 to 10 show examples of strip mosaics of varying sizes, with their corresponding hematoxylin and eosin (H&E)-stained pathology. The mosaics are shown in fluorescence contrast, following staining with acridine orange. The resolution and nuclear-level morphology in the mosaics may not be easily appreciated in these figures, but is more clearly seen when viewed on our large monitor with adequate pixelation. In these figures, we include inset areas that are displayed with zoom to show the resolution and level of detail. Fig. 5A mosaic consisting of 24 fluorescence image strips of excised tissue from Mohs surgery. Typical features such as sebaceous glands (a) and eccrine glands (b) can be seen. Nests of superficial basal cell carcinomas (c) shown with arrows are observed, showing increased density of nuclei. The mosaic dimensions are (width x height) with . Note that the magnified areas are display zooms obtained from the original image showing the detail and resolution of the mosaic. The features in the mosaic compare well, in general, to the pathology (Fig. 6) in terms of location, shape, size, nuclei of cells (shown in bright white) and overall morphology of both basal cell carcinomas and normal features.  Fig. 6Frozen H&E-stained pathology of excised tissue from Mohs surgery. This frozen section corresponds to a tissue slice that is adjacent to (but not exactly of) the imaged surface shown in Fig. 5. The features in inset areas A, B, and C are clearly identified across the two figures. 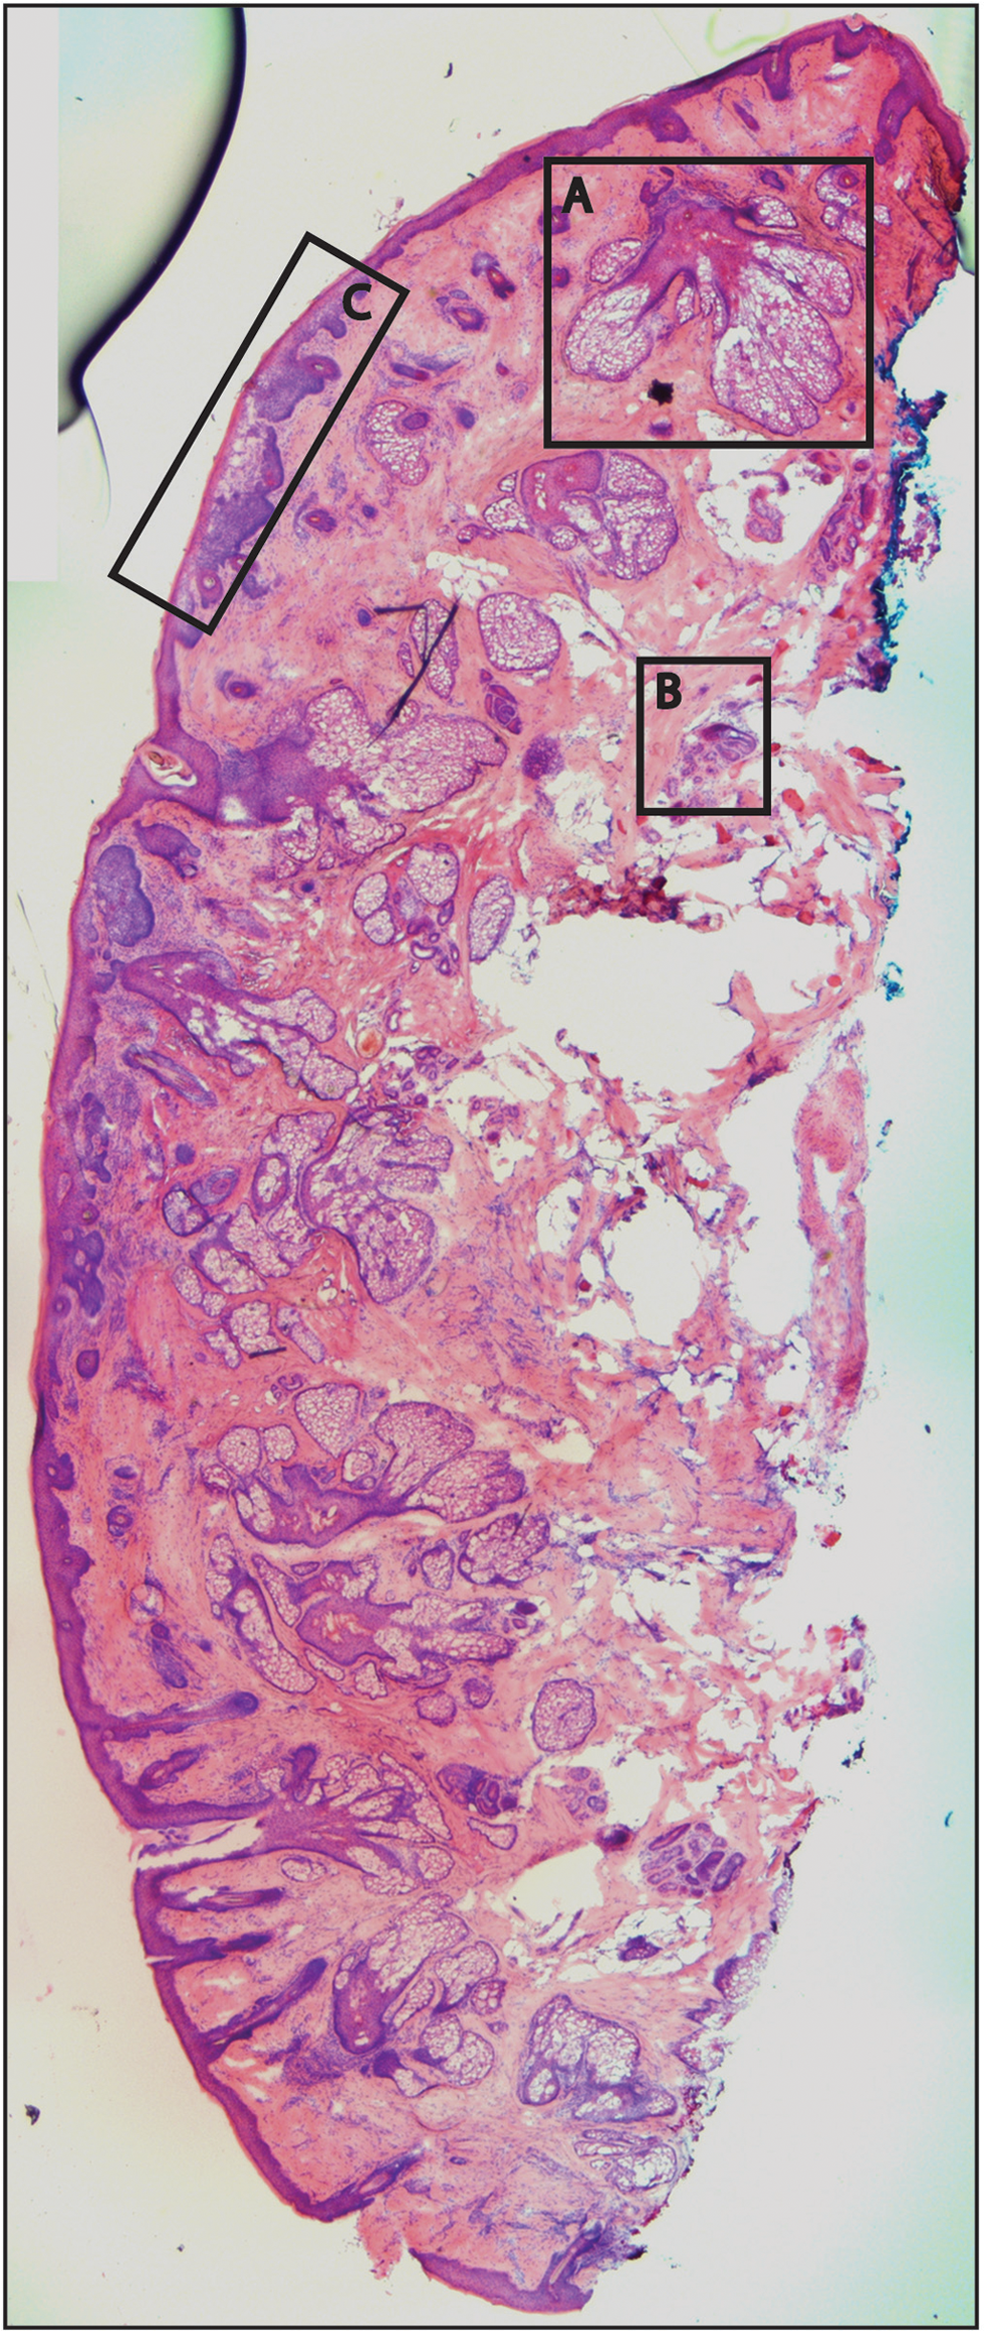 Fig. 7A mosaic consisting of 17 fluorescence image strips of excised tissue from Mohs surgery. Typical features such as sebaceous glands (a), eccrine glands (b), and hair follicle (c) are seen. The mosaic dimensions are () with . The features in the mosaic compare well to the pathology (Fig. 8), in terms of location, shape, size, nuclei of cells (shown with arrows), and overall morphology.  Fig. 8Frozen H&E-stained pathology of excised tissue from Mohs surgery. The frozen section corresponds to a tissue slice adjacent to (but not exactly of the) imaged surface shown in Fig. 7. The features in inset areas A, B, and C are clearly identified across the two figures.  Fig. 9A mosaic, consisting of 85 fluorescence image strips, of excised tissue from breast cancer surgery. The mosaic shows a central bright-appearing region of tumor and outlying somewhat darker-appearing regions of fat and fibrous tissue. The nucleus of cells appear to be bright. Closer inspection (insets) shows: (a) cancer cells invading a region of fat cells (b) a breast duct with hollow lumen (c) cancer cells proliferating in a duct. (Continued on next page.) 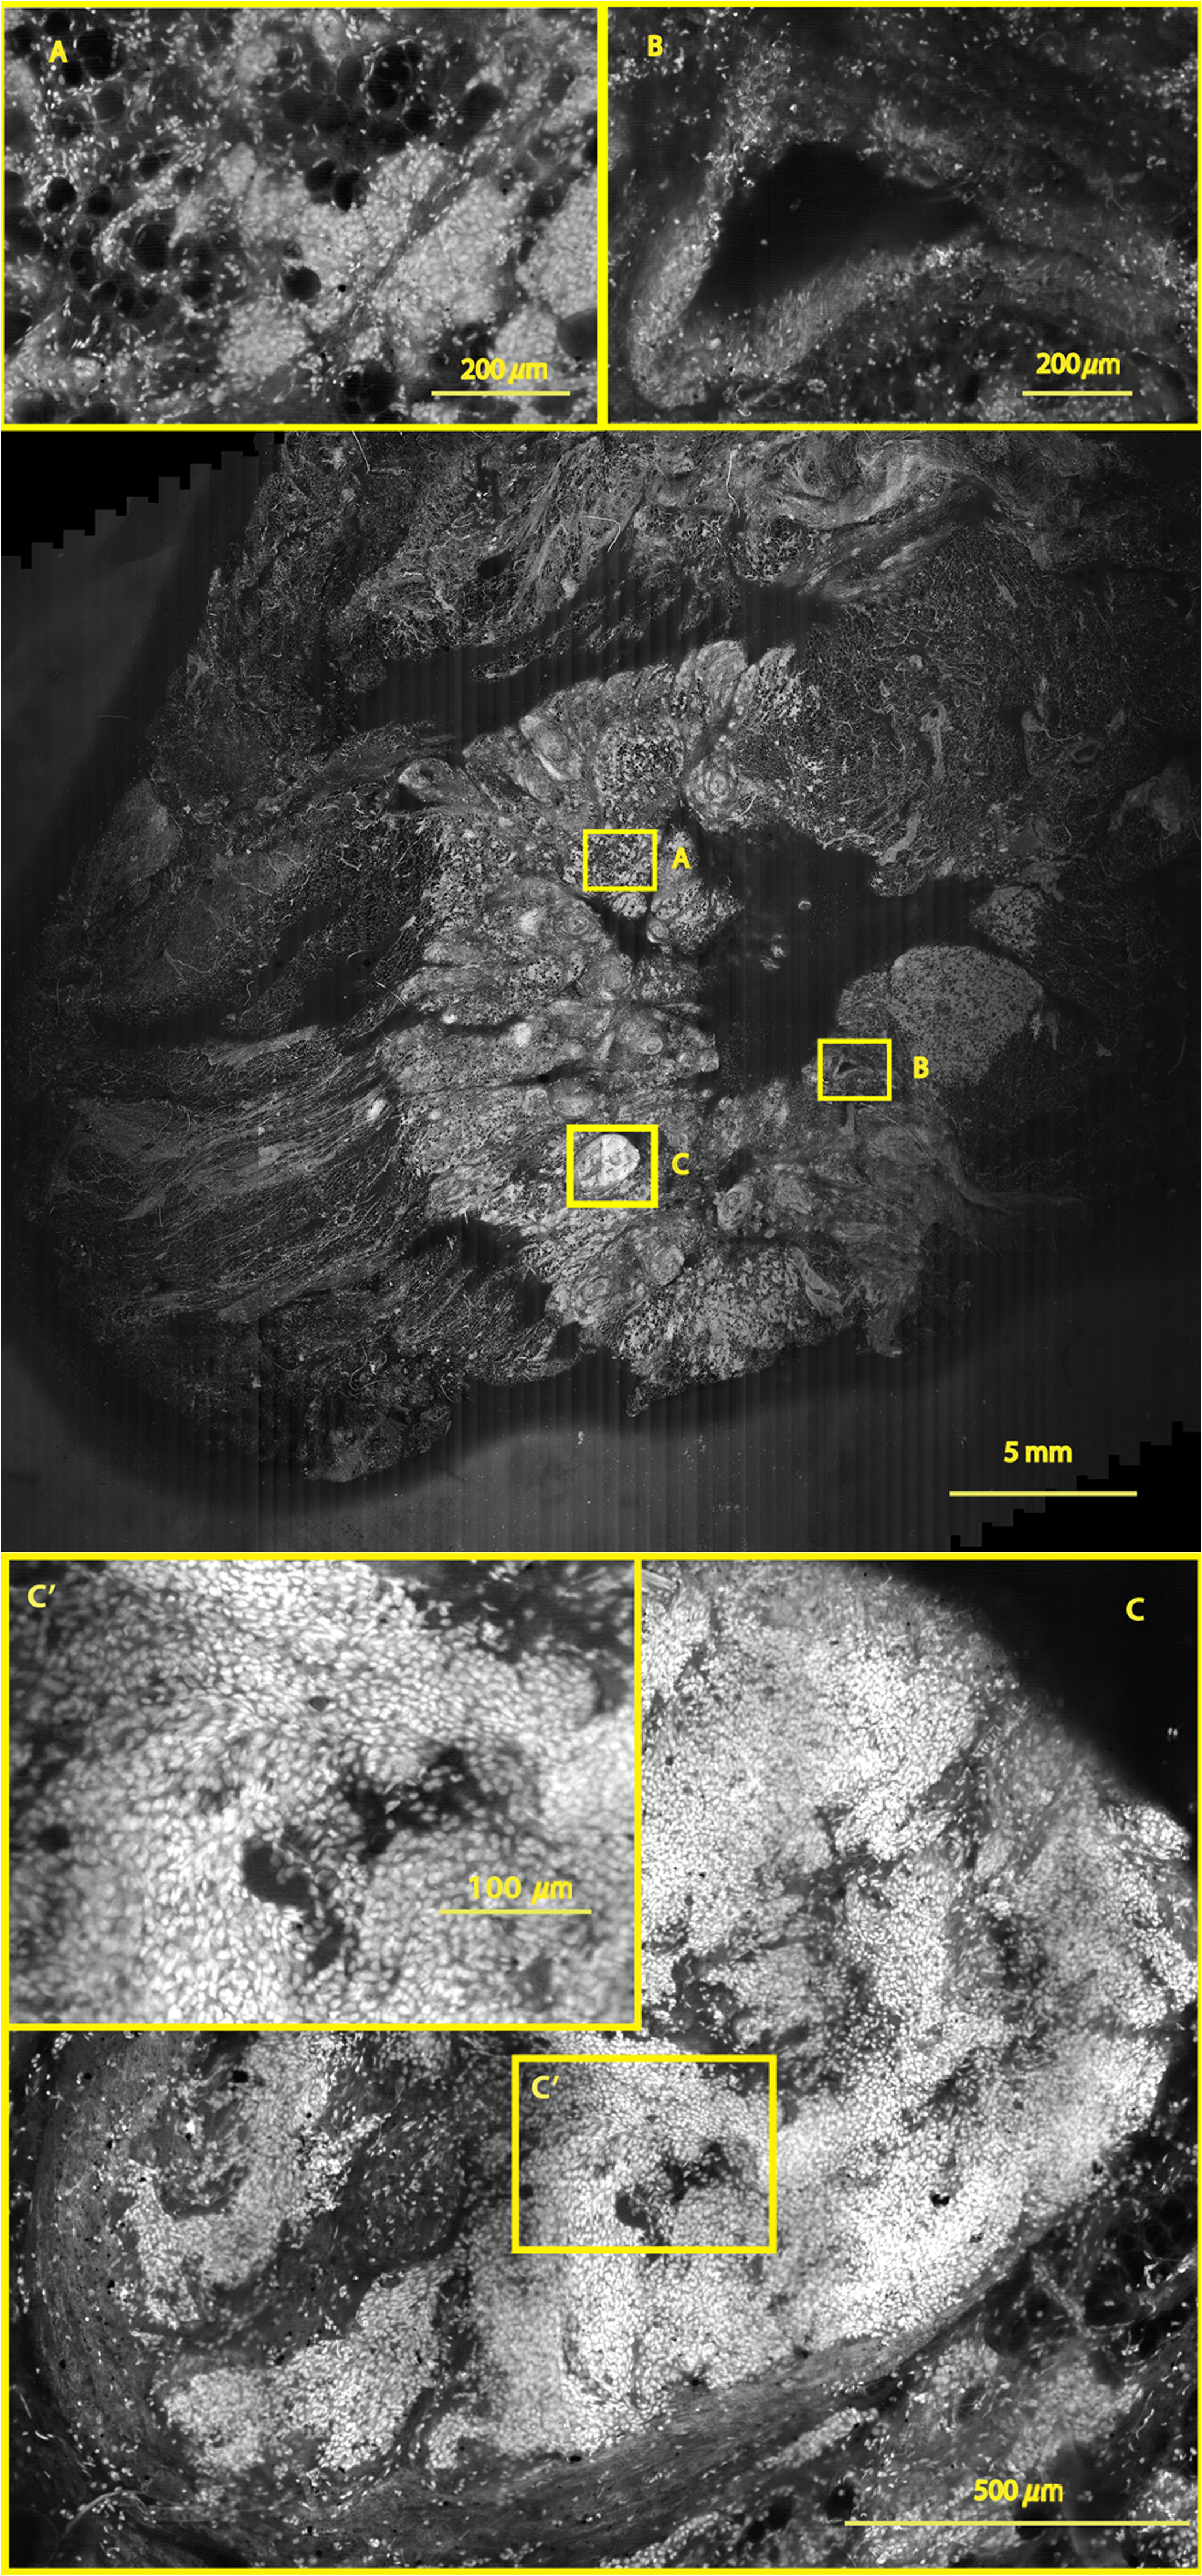 Fig. 10Fixed H&E-stained pathology of excised tissue from breast surgery. Labels indicate matching regions to the confocal mosaic in Fig. 9: (a) a duct; (b) ductal carcinoma in situ; and (c) invasive cancer cells.  3.1.Skin Tissue from Mohs SurgeryFigure 5 shows a strip mosaic of a skin excision from Mohs surgery. The measured time for the mosaic, consisting of 24-strip images, was about 3 min. This mosaic was created before we implemented simultaneous stitching with the acquisition. The strips were stitched after acquisition was completed, adding approximately an extra 96 s to complete the mosaic. Nuclear detail and morphology is seen in the magnified insets A, B, and C. The morphologic features in the mosaics compare well to those in the corresponding pathology (Fig. 6) for both basal cell carcinomas and normal skin. However, a perfect one-to-one correlation of individual features is not always expected (nor desired by Mohs surgeons), because tissue is pliant and thus susceptible to distortions introduced during the fixturing for mosaicing or processing for frozen sections. As a result, the pathology is usually of a 5-μm-thin tissue section that may be adjacent to, but not exactly of, the imaged surface. Figure 7 is also a strip mosaic of a skin excision from Mohs surgery. This mosaic is consisting of 17-strip images. The image strips were stitched simultaneously with acquisition, and the mosaic was completed in 55 s [The simultaneous stitching eliminating the extra time that was otherwise required for some of our earlier mosaics (Fig. 8)]. The nuclear detail and morphology is seen in the magnified insets A, B, and C. The morphologic features in the mosaics compare well to corresponding pathology (Fig. 8). 3.2.Breast Tissue from Breast Cancer SurgeryFigure 9 is a strip mosaic of breast tissue from a lumpectomy. The actual size of the tissue is about . A step-shaped artifact can be seen at the upper and lower edges of the mosaic (Fig. 9). This was due to a malfunction in the tissue translation stage. [The malfunction manifested as a loss of position in the scan along the strip ( direction) while stepping in the orthogonal direction ( direction.)] Thirty 3.5-cm-long image strips were acquired in 13 min and stitched after acquisition. For this mosaic, we can only report the acquisition time due to hardware limitation in the present implementation. The scan of a such large area requires about 60 image strips. Our stitching program (written in Matlab) runs out of allowed allocated memory during attempts to stitch all the 2.5-cm long strips. Each strip is a factor of 2.5 longer than our usual 10-mm strip. In this mosaic we first stitched four 2.5-cm strips and used ImageJ to merge 4-strip images together to create the mosaic. In the future, this hurdle may be overcome by implementing a graphic processing unit (GPU) dedicated for stitching and display. Since the strips are being stitched during acquisition we expect the full mosaic could be produced in 13 min with a dedicated GPU (plus the time to scan and stitch the last strip). Within the mosaic, regions of interest can be identified. The central bright-appearing region is tumor and the outlying darker-appearing regions are primarily fat and connective tissue. Upon closer inspection, cellular and increased nuclear density is visible. For example, inset B of Fig. 9 shows a duct. A normal duct is made up of a double layer of cells surrounding an empty lumen. In this case, the normal growth of the epithelial cells has been disrupted and while the overall shape resembles a duct, the cellular architecture shows that this is no longer a typical cellular pattern. Inset C of Fig. 9 shows proliferation of cell growth in a duct. Instead of the normal double-cell layer, cells have grown inward to the lumen. The cells are contained within the boundaries of the duct, suggesting a ductal carcinoma in situ. Inset A of Fig. 9 shows invasive carcinoma in which the cancer cells have invaded the surrounding fat cells. The fat cells are large and appear dark. The tumor cells are small with bright nuclei. 4.Summary and DiscussionOur previous approaches for confocal mosaicing microscopy proved the feasibility of imaging nuclear and cellular morphology and tumor margins in large areas of freshly excised tissue.13–15,21,22 Two Mohs surgeons demonstrated their ability to read mosaics in a manner similar to their examination of pathology, and detect basal cell carcinoma margins in Mohs surgical excisions with high sensitivity and specificity.18,19 Although mosaicing could be performed in several minutes, the speed was still too slow to enable routine and practical use in Mohs and other surgical settings. To overcome this barrier and address the request for shorter times of surgeons, we designed a faster approach called “strip mosaicing.” The initial feasibility was reported last year.20 In this paper, we presented further advances in electronics, mechanics, custom software, and the overall integration of hardware and software into an approach that offers further improvement in speed. Strip mosaicing confocal microscopy offers an imaging technology platform for rapid detection of tumor margins directly in fresh tissue during surgery. Large amounts of tissue may be examined quickly enough to be of practical use in diverse surgical settings. The imaging may potentially be developed into an adjunct for pathology, to enable more complete and accurate removal of tumor. Further improvements in strip mosaicing may be achieved in several ways:
As shown in this paper, tissues from Mohs surgery and breast tumors are good tests to demonstrate strip mosaicing indifferent surgical settings. This approach may also find applications in other tissues, and not only in surgical settings but also in clinics for rapid screening of biopsies. Each application will, of course, present its own challenges in terms of the mechanical properties (shape, size, topography, compliance) of the tissue to be imaged, availability and efficacy of contrast agents, speed requirement and tissue fixturing for translation to the bedside. Currently there are many mosaicing approaches being developed for microscopy of processed tissue23–33 as well as for in vivo.34–39 Our instrumentation design will help in developing those approaches. Beyond imaging excised tissue, a similar approach may be possible on patients to delineate tumor margins in vivo, either preoperatively or intraoperatively in surgical wounds. Preliminary feasibility of such techniques has been reported for mosaicing on skin in vivo17,34–39 and also in shave-biopsied wounds in which residual tumor (basal and squamous cell carcinoma) margins were delineated.40 In the future, an approach that involves mosaicing both on excised tissue at the bedside and intra-operatively on the patient may prove useful for detecting tumor margins in a rapid, efficient, and cost-effective manner. AcknowledgmentsThe authors gratefully acknowledge support from NIH grant R01EB012466 from NIBIB’s Image Guided Interventions Program (Program Director Dr. Steve Krosnick). We thank Drs. Kishwer Nehal and Erica Lee for supplying discarded tissue from Mohs surgery, and Drs. Melissa Murray and Monica Morrow for supplying tissue from breast cancer surgeries (under IRB-approved protocols), and, most importantly, for their enthusiastic collaborative involvement with image analysis and correlation to pathology. We are grateful to Dr. Chris Glazowski for help with assembly and alignment of the microscope, Bill Fox and Scott Grodevant at Lucid Inc. and our machine shop at MSKCC for technical support. ReferencesM. Rajadhyakshaet al.,
“Confocal examination of nonmelanoma cancers in thick skin excisions to potentially guide mohs micrographic surgery without frozen histopathology,”
J. Investig. Dermatol., 117
(5), 1137
–1143
(2001). http://dx.doi.org/10.1046/j.0022-202x.2001.01524.x JIDEAE 0022-202X Google Scholar
R. Haqueet al.,
“Surgical margins and survival after head and neck cancer surgery,”
BMC Ear Nose Throat Disord., 6 2
(2006). http://dx.doi.org/10.1186/1472-6815-6-2 BENTCT 1472-6815 Google Scholar
L. Jacobs,
“Positive margins: the challenge continues for breast surgeons,”
Ann. Surg. Oncol., 15
(5), 1271
–1272
(2008). http://dx.doi.org/10.1245/s10434-007-9766-0 ASONF4 1068-9265 Google Scholar
M. Y. Al-ArashiE. SalomatinaA. N. Yaroslavsky,
“Multimodal confocal microscopy for diagnosing nonmelanoma skin cancers,”
Laser. Surg. Med., 39
(9), 696
–705
(2007). http://dx.doi.org/10.1002/(ISSN)1096-9101 LSMEDI 0196-8092 Google Scholar
M. Jainet al.,
“Multiphoton microscopy in the evaluation of human bladder biopsies,”
Arch. Pathol. Lab. Med., 136
(5), 517
–526
(2012). http://dx.doi.org/10.5858/arpa.2011-0147-OA APLMAS 0003-9985 Google Scholar
M. Jainet al.,
“Modified full-field optical coherence tomography: a novel tool for rapid histology of tissues,”
J. Pathol. Inform., 2 28
(2011). http://dx.doi.org/10.4103/2153-3539.82053 2229-5089 Google Scholar
D. Kanget al.,
“Comprehensive imaging of gastroesophageal biopsy samples by spectrally encoded confocal microscopy,”
Gastrointest. Endosc., 71
(1), 35
–43
(2010). http://dx.doi.org/10.1016/j.gie.2009.08.026 GAENBQ 0016-5107 Google Scholar
T. Makinoet al.,
“Multiphoton tomographic imaging: a potential optical biopsy tool for detecting gastrointestinal inflammation and neoplasia,”
Cancer Prev. Res. (Phila.), 5
(11), 1280
–1290
(2012). http://dx.doi.org/10.1158/1940-6207.CAPR-12-0132 CPRACC 1940-6207 Google Scholar
R. Patalayet al.,
“Multiphoton multispectral fluorescence lifetime tomography for the evaluation of basal cell carcinomas,”
PloS one, 7
(9), e43460
(2012). http://dx.doi.org/10.1371/journal.pone.0043460 JOURDD 0248-0018 Google Scholar
M. A. Salduaet al.,
“Imaging inflammation in mouse colon using a rapid stage-scanning confocal fluorescence microscope,”
J. Biomed. Opt., 17
(1), 016006
(2012). http://dx.doi.org/10.1117/1.JBO.17.1.016006 JBOPFO 1083-3668 Google Scholar
M. T. Tilliet al.,
“Real-time imaging and characterization of human breast tissue by reflectance confocal microscopy,”
J. Biomed. Opt., 12
(5), 051901
(2007). http://dx.doi.org/10.1117/1.2799187 JBOPFO 1083-3668 Google Scholar
H. Yooet al.,
“Reflectance confocal microscopy for the diagnosis of eosinophilic esophagitis: a pilot study conducted on biopsy specimens,”
Gastrointest. Endosc., 74
(5), 992
–1000
(2011). http://dx.doi.org/10.1016/j.gie.2011.07.020 GAENBQ 0016-5107 Google Scholar
Y. G. Patelet al.,
“Confocal reflectance mosaicing of basal cell carcinomas in Mohs surgical skin excisions,”
J. Biomed. Opt., 12
(3), 034027
(2007). http://dx.doi.org/10.1117/1.2750294 JBOPFO 1083-3668 Google Scholar
D. S. Gareauet al.,
“Confocal mosaicing microscopy in Mohs skin excisions: feasibility of rapid surgical pathology,”
J. Biomed. Opt., 13
(5), 054001
(2008). http://dx.doi.org/10.1117/1.2981828 JBOPFO 1083-3668 Google Scholar
D. S. Gareauet al.,
“Confocal mosaicing microscopy in skin excisions: a demonstration of rapid surgical pathology,”
J. Microsc., 233
(1), 149
–159
(2009). http://dx.doi.org/10.1111/j.1365-2818.2008.03105.x JMICAR 0022-2720 Google Scholar
A. N. Yaroslavskyet al.,
“Combining multispectral polarized light imaging and confocal microscopy for localization of nonmelanoma skin cancer,”
J. Biomed. Opt., 10
(1), 014011
(2005). http://dx.doi.org/10.1117/1.1854173 JBOPFO 1083-3668 Google Scholar
K. E. Loewkeet al.,
“Real-time image mosaicing for medical applications,”
Stud. Health Technol. Inform., 125 304
–309
(2007). SHTIEW 0926-9630 Google Scholar
J. K. Karenet al.,
“Detection of basal cell carcinomas in Mohs excisions with fluorescence confocal mosaicing microscopy,”
Br. J. Dermatol., 160
(6), 1242
–1250
(2009). http://dx.doi.org/10.1111/bjd.2009.160.issue-6 BJDEAZ 1365-2133 Google Scholar
D. S. Gareauet al.,
“Sensitivity and specificity for detecting basal cell carcinomas in Mohs excisions with confocal fluorescence mosaicing microscopy,”
J. Biomed. Opt., 14
(3), 034012
(2009). http://dx.doi.org/10.1117/1.3130331 JBOPFO 1083-3668 Google Scholar
S. Abeytungeet al.,
“Rapid confocal imaging of large areas of excised tissue with strip mosaicing,”
J. Biomed. Opt., 16
(5), 050504
(2011). http://dx.doi.org/10.1117/1.3582335 JBOPFO 1083-3668 Google Scholar
J. Biniet al.,
“Confocal mosaicing microscopy of human skin ex vivo: spectral analysis for digital staining to simulate histology-like appearance,”
J. Biomed. Opt., 16
(7), 076008
(2011). http://dx.doi.org/10.1117/1.3596742 JBOPFO 1083-3668 Google Scholar
D. S. Gareau,
“Feasibility of digitally stained multimodal confocal mosaics to simulate histopathology,”
J. Biomed. Opt., 14
(3), 034050
(2009). http://dx.doi.org/10.1117/1.3149853 JBOPFO 1083-3668 Google Scholar
G. Babaloukaset al.,
“Evaluation of three methods for retrospective correction of vignetting on medical microscopy images utilizing two open source software tools,”
J. Microsc., 244
(3), 320
–324
(2011). http://dx.doi.org/10.1111/jmi.2011.244.issue-3 JMICAR 0022-2720 Google Scholar
A. Bennassaret al.,
“Rapid diagnosis of two facial papules using ex vivo fluorescence confocal microscopy: toward a rapid bedside pathology,”
Dermatol. Surg., 38
(9), 1548
–1551
(2012). http://dx.doi.org/10.1111/dsu.2012.38.issue-9 DESUFE 1076-0512 Google Scholar
M. L. Berlangaet al.,
“Three-dimensional reconstruction of serial mouse brain sections: solution for flattening high-resolution large-scale mosaics,”
Front. Neuroanat., 5
(17), 1
–8
(2011). http://dx.doi.org/10.3389/fnana.2011.00017 FNREB8 1662-5129 Google Scholar
S. K. Chowet al.,
“Automated microscopy system for mosaic acquisition and processing,”
J. Microsc., 222
(Pt 2), 76
–84
(2006). http://dx.doi.org/10.1111/jmi.2006.222.issue-2 JMICAR 0022-2720 Google Scholar
S. Debarbieuxet al.,
“Perioperative confocal microscopy of the nail matrix in the management of in situ or minimally invasive subungual melanomas,”
Br. J. Dermatol., 167
(4), 828
–836
(2012). http://dx.doi.org/10.1111/bjd.2012.167.issue-4 BJDEAZ 1365-2133 Google Scholar
W. Y. HsuW. F. P. PoonY. N. Sun,
“Automatic seamless mosaicing of microscopic images: enhancing appearance with colour degradation compensation and wavelet-based blending,”
J. Microsc., 231
(3), 408
–418
(2008). http://dx.doi.org/10.1111/j.1365-2818.2008.02052.x JMICAR 0022-2720 Google Scholar
P. Khurdetet al.,
“Global error minimization in image mosaicing using graph connectivity and its applications in microscopy,”
J. Pathol. Inform., 2 S8
(2011). http://dx.doi.org/10.4103/2153-3539.92039 2229-5089 Google Scholar
F. Piccininiet al.,
“Multi-image based method to correct vignetting effect in light microscopy images,”
J. Microsc., 248
(1), 6
–22
(2012). http://dx.doi.org/10.1111/jmi.2012.248.issue-1 JMICAR 0022-2720 Google Scholar
J. L. Schroederetet al.,
“Rapid overlapping-volume acquisition and reconstruction (ROVAR): automated 3-D tiling for high-resolution, large field-of-view optical microscopy,”
J. Microsc., 243
(1), 103
–110
(2011). http://dx.doi.org/10.1111/jmi.2011.243.issue-1 JMICAR 0022-2720 Google Scholar
H.-C. ShaoW.-L. HwangY.-C. Chen,
“Optimal multiresolution blending of confocal microscope images,”
IEEE Trans. Biomed. Eng., 59
(2), 531
–541
(2012). http://dx.doi.org/10.1109/TBME.2011.2175446 IEBEAX 0018-9294 Google Scholar
C. Sunet al.,
“Mosaicing of microscope images with global geometric and radiometric corrections,”
J. Microsc., 224
(2), 158
–165
(2006). http://dx.doi.org/10.1111/j.1365-2818.2006.01687.x JMICAR 0022-2720 Google Scholar
V. Beckeret al.,
“High-resolution miniprobe-based confocal microscopy in combination with video mosaicing (with video),”
Gastrointest. Endosc., 66
(5), 1001
–1007
(2007). http://dx.doi.org/10.1016/j.gie.2007.04.015 GAENBQ 0016-5107 Google Scholar
N. Bedardet al.,
“Real-time video mosaicing with a high-resolution microendoscope,”
Biomed. Opt. Express, 3
(10), 2428
–2435
(2012). http://dx.doi.org/10.1364/BOE.3.002428 BOEICL 2156-7085 Google Scholar
P. Kimet al.,
“In vivo wide-area cellular imaging by side-view endomicroscopy,”
Nat. Meth., 7
(4), 303
–305
(2010). http://dx.doi.org/10.1038/nmeth.1440 1548-7091 Google Scholar
K. E. Loewkeet al.,
“In vivo micro-image mosaicing,”
IEEE Trans. Biomed. Eng., 58
(1), 159
–171
(2011). http://dx.doi.org/10.1109/TBME.2010.2085082 IEBEAX 0018-9294 Google Scholar
T. Vercauterenet al.,
“Robust mosaicing with correction of motion distortions and tissue deformations for in vivo fibered microscopy,”
Med. Image Anal., 10
(5), 673
–692
(2006). http://dx.doi.org/10.1016/j.media.2006.06.006 MIAECY 1361-8415 Google Scholar
T. Vercauterenet al.,
“Mosaicing of confocal microscopic in vivo soft tissue video sequences,”
in Medical Image Computing and Computer-Assisted Intervention—Miccai 2005, Pt 1,
753
–760
(2005). Google Scholar
A. Scopeet al.,
“In vivo reflectance confocal microscopy of shave biopsy wounds: feasibility of intraoperative mapping of cancer margins,”
Br. J. Dermatol., 163
(6), 1218
–1228
(2010). http://dx.doi.org/10.1111/bjd.2010.163.issue-6 BJDEAZ 1365-2133 Google Scholar
|


