|
|
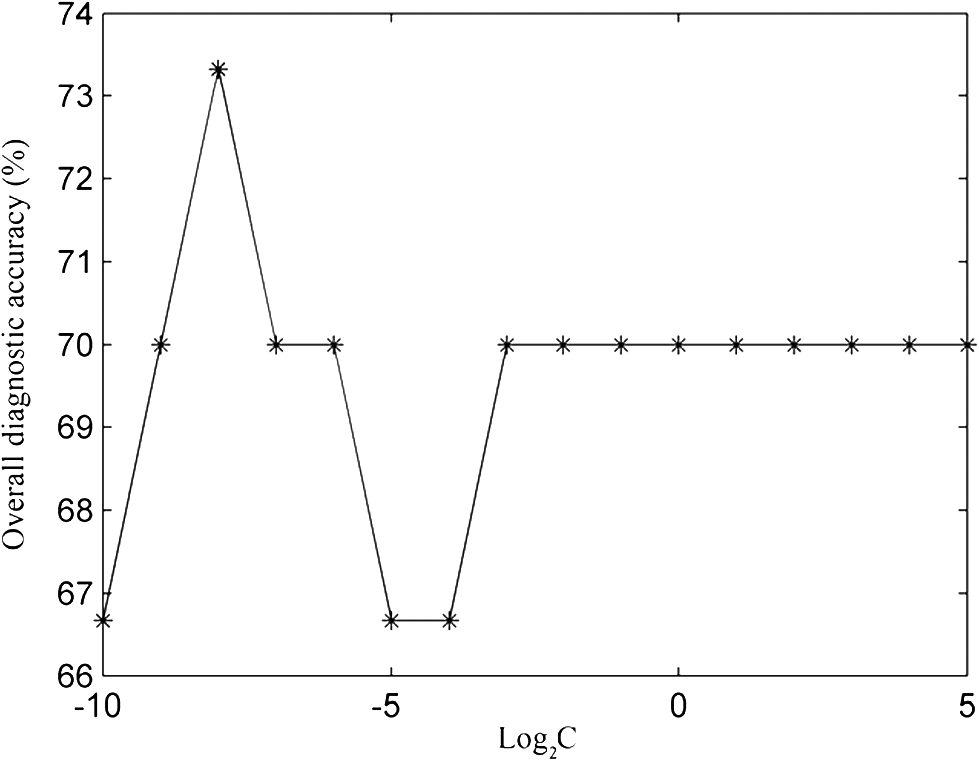
1.IntroductionEsophageal cancer is one of the common malignant tumors worldwide with an annual incidence of about 300 thousand cases and a five-year survival rate of 10% to 25%. Early diagnosis and treatment is important to improve the survival rate.1 However, there are many disadvantages in conventional esophageal cancer screening methods such as white-light endoscopy and biopsy. For example, endoscopy check depends on visual identification of gross morphological tissue changes. It is difficult to detect subtle early neoplastic changes, and the examination results are relevant to the skill of physician. Excision biopsy is invasive and impractical for a high-risk patient with multiple suspicious lesions. Therefore, it is urgently desirable to develop a noninvasive means to early diagnose esophageal cancer. In recent years, the Raman spectroscopy technique has received a great deal of interest in the biomedical field.2–4 It has been applied to differentiate normal and malignant tissues of various body sites, include breast, bladder, lung, prostate, cervix, skin, etc.5–8 Raman spectroscopy is a molecular vibration spectral method discovered by the Indian scientist Raman C.V. in 1928. It can provide fingerprinting type information about the structure and conformation of macromolecules such as proteins, lipids and nucleic acids. Compared with the fluorescence spectroscopy and infrared absorption spectroscopy, Raman spectroscopy has many advantages.4 For instance, there is no photobleaching in Raman scattering, and Raman spectral peaks are narrow. However, two disadvantages of Raman spectroscopy make it difficult to practical application in clinic diagnosis. One of drawbacks is that the efficiency of Raman scattering is very low due to its extremely small cross-section ( to ); the other is that a strong fluorescence background of biological samples make it difficult to extract from the original signal. With the discovery of surface-enhanced Raman spectroscopy (SERS) in 1974 by Fleischman et al., Raman spectroscopy technique acquired a rapid development.9 Single molecule absorbing onto a single silver nanoparticle has been successful probed by SERS. This facilitates the application of SERS technology in the detection of biological materials such as DNA, RNA, and proteins. The most recent reports show that SERS has been used for target detection of tumor markers in the blood or on the cell surface by the immunoassay approaches.10–12 Blood samples are ideal disease screening materials for noninvasive diagnosis. They are rich in proteins, fates, cholesterol, etc. At the early stage of cancer, these components will undergo subtle changes which can be revealed by SERS. Chen R. group has researched several types of patients include gastric cancer, nasopharyngeal carcinoma, colon tumor with blood SERS. They successfully distinguish cancer patients from normal volunteers with sensitivity and specificity of 90% or more.13–15 However, the differences of Raman spectroscopy between normal and pathologic tissues are usually tiny that it is difficult to differentiate them with direct means. The powerful and robust spectral data processing algorithms are much needed to extract effective diagnostic information. Multivariate statistical techniques such as principal component analysis (PCA), linear discriminant analysis (LDA) and artificial neural networks (ANNs) have been successfully used to develop diagnostic algorithms.5,15,16 For example, Feng et al., use PCA-LDA technique to distinguish serum SERS of nasopharyngeal cancer, they acquire sensitivity 90.7% and specificity 100%.13 Another powerful multivariate technique, support vector machine (SVM), which was introduced by Vapnik and Burges, has attracted great attention due to its capability of representing nonlinear features.17,18 The SVM technique has now been applied to classify spectral data for tissue diagnose. For instance, Huang et al., used PCA-SVM techniques to classify multiclass Raman spectra from different types of pathological colonic tissues.19 Lin et al., implemented linear and nonlinear SVM methods for the classification of autofluorescence spectroscopy from nasopharyngeal carcinomas and normal tissues with diagnostic accuracy higher than that of PCA-LDA.20 To date, the application of SVM to distinguish serum SERS for noninvasive cancer detection has not yet been reported. This study aims to explore the potential of SVM technique combining with serum surface-enhanced Raman spectroscopy (SERS) to detect esophageal cancer. Three multivariate statistic analysis methods including principal components analysis (PCA), conventional SVM (C-SVM) and conventional SVM combination with PCA (PCA-SVM) methods were implemented to classify the same spectra dataset. The diagnostic performance of all SVM models were exhaustively optimized and evaluated by leaving one out cross validation method. 2.Materials and Methods2.1.Synthesis of AgNPsAgNPs was synthesized following the reported method.21 First, 18 mg of were added to 100 ml water under strong stirring. When the solution was boiling, 2 ml of citrate sodium (1 wt.%) was slowly added into the solution. Then the solution was boiled for 40 min and cooled in ambient conditions. The AgNPs was characterized by an absorption maximum at 424 nm in Fig. 1. A transmission electron microscopy (TEM) photograph of the prepared silver colloid was showed in the inserted picture. 2.2.Preparation of Human Serum SamplesSerum samples were collected from 61 individuals consisting of 31 healthy volunteers and 30 esophageal cancer patients who were confirmed clinically with histopathology. In these 30 cancerous patients, 24 cases were mid-cancers (II, III stage), 3 cases early cancers (I stage) and 3 cases advanced cancers (IV stage). All patients were from Sun Yat-sen University Cancer Center and signed an informed consent to permit collection of blood prior to research. After 12 h of overnight fasting, a single 3 ml peripheral blood samples were obtained from the study subjects between 7:00 and 8:00 A.M. Serum was obtained by extracting supernatant from blood samples centrifuged at 3500 rpm for 5 min. Before SERS measurement, 20 μL silver colloidal nanoparticles were mixed with 20 μL serum. The mixture was stirred with the pipette tip and then incubated 1 h at room temperature. Next, a drop of this mixture was transferred onto an aluminum plate and dry naturally 1 h for SERS measurement. 2.3.SERS Measurements and Data PreprocessingThe Raman spectroscopy was recorded with a confocal Raman microscopy (Renishaw, inVia, United Kingdom) in the range of 600 to with a spectral resolution about under a 785 nm diode laser excitation. The power of laser exposed on sample is about 0.5 mw with a spot diameter about 5 μm. The spectra were collected in back-scattered geometry using a Leica DM2500 microscope equipped with objective ; The software package WIRE 3.2(Renishaw) was employed for spectral acquisition and analysis. Each Raman spectra was accumulated two times with an integration time of 10 s. Each sample was collected three spectra and then these three spectra were averaged. All data were collected under the same conditions. A fifth-order polynomial was employed to fit the autofluorescence background, and then this polynomial was subtracted from original spectra. In order to compare the changes of spectral shapes and relative peak intensities among different serum samples, the area normalized of spectra under the curve was employed. Vancouver Raman algorithm was used to spectra smoothed and baseline correct.22 It is an automated autofluorescence background subtraction algorithm based on modified multipolynomial fitting. 2.4.Support Vector MachineSupport vector machine (SVM) is a relatively young multivariate data classification method and was first proposed by Vapnik. It is based on the principal of minimization of structural risk by the appropriate choice of function subset and discriminant function, ensuring the actual risk of learning machines to a minimum. Thus, it is an excellent learning machine with optimal classified ability and generalization ability. SVM has been applied successfully in many fields, such as face recognition, text categorization, gene selection, and so on.20,23–25 Compared with other multivariate statistical methods, SVM has many advantages: first, it is a powerful way to classify a small size of datasets; second, it can give reproducible solutions; third, it has the ability to deal with class boundaries with complex conditions by replacing the kernel functions. For linearly separable binary classification sample sets, SVM finds an optimal hyperplane to maximize the margin between them. When the sample sets are nonlinear nonseparable, SVM maps the sample data to a higher dimensional feature space to linearize the boundary of sample sets by specific kernel functions. The three most frequently used kernel functions are: where and are the two generic sample data vectors.To get a support vector machine classifier with good generalization ability, choice of an appropriate kernel function which projects data to the feature space is critical. For a given kernel function, optimization of the corresponding parameter is also important, such as the polynomial order d in the polynomial kernel and Gaussian width in the Gaussian RBF kernel. Once the data are mapped into the feature space an infinite number of separating hyperplanes may exist, creating the risk of overfitting the hyperplanes to the given data points. The overfit hyperplane can perfectly separate training data, but it poorly predicts unseen data. To overcome this problem, a penalty factor C is introduced to allow some training data to be misclassified, the higher C the lower misclassification rate. In this work, conventional SVM technique (C-SVM) and conventional SVM combining with PCA method (PCA-SVM) are to be assessed. For every type of SVM technique, linear and RBF kernel functions are employed to build two classes of diagnostic algorithms. All diagnostic algorithms are optimized with grid search and evaluated by leave one sample out cross validation method, which involves using one sample held out from dataset as the validation data, and the remain samples as the training data, this process is repeated such that each sample is used once as the validation data. The optimization criterion is to maximize overall diagnostic accuracy obtained from leave one out cross validation methods. The optimized algorithms developed from the training set are used to classify the withheld spectra measured from one subject. This procedure is repeated until all 61 mean spectra measured from 61 subjects are classified. The overall diagnostic accuracy of a particular algorithm is calculated based on the classifications of the withheld spectra over 61 rounds of cross validation. In order to compare the performance of SVM models, the same dataset is used for the investigation of PCA. The leave one sample out cross validation is executed to test the performance of PCA. The LIBSVM toolbox 3.1 created by Chang and Lin is used for SVM classifications. All the procedure is implemented with MATLAB language. 3.ResultsWe have measured the regular Raman spectra and surface-enhanced Raman spectra of serum sample come from the same esophageal cancer patient in order to assess the silver colloid enhancement effects on the serum Raman scattering. Figure 2(a) displays SERS spectra of the serum sample from an esophageal cancer patient by mixing the serum with silver colloid at a proportion, Fig. 2(b) the regular Raman spectra of serum sample from the same patient without the Ag colloid. It is clearly shows that there is almost no Raman peak observed for the regular Raman spectra of serum sample without silver colloid, while there is a huge enhanced for the SERS spectra with Ag colloid. The dramatic increase in many dominant vibration bands indicates there is a strong interaction between AgNPs and serum. Because of this interaction, biochemical substances of serum sample absorb closely on the surface of silver particles, resulting in a tremendous enhanced of Raman scattering. Fig. 2(a) SERS spectra of the serum sample from a patient with esophageal cancer obtained by mixing the serum with Ag colloid at a proportion. (b) The regular Raman spectra of serum sample from the same patient without the Ag colloid.  A total of 61 serum SERS spectra were obtained, in which 30 Raman spectra were from cancerous patients and 31 from normal subjects. Figure 3 shows normalized average SERS spectra standard deviations of esophageal cancer and normal serum in the range from 600 to . The shade area represents the standard deviations. Primary Raman peaks are observed in normal and cancerous esophageal serum at (C-S twist), (C-H bending adenine, coenzyme), (C-C stretch of proline ring, ring breathing of tyrosine), (C-C stretch of proline ring, glucose), (C-H stretch of phenylalanine), (C-N stretch, D-mannos), ( phenylalanine, tryptophan), ( twisting collagen/lipids), ( wagging, tryptophan adenine, guanine), ( bending, collagen/lipids), ( bending, phenylalanine, acetoacetate, riboflavin). The strongest peaks are at 1219, 1346, 1445, and .13,14,26,27 The spectral differences between esophageal cancer and normal serum are clearly displayed in Fig. 3(c). The distinct differences imply that there is an enormous potential to diagnosis esophageal cancer with serum SERS technique. Fig. 3Normalized mean SERS spectra of 30 esophageal cancer and 31 normal serum sample. (a) Cancer, (b) normal, (c) difference spectra (cancer-normal, the difference spectra intensity is enlarged five times for clear display), shade area represents the standard deviations. 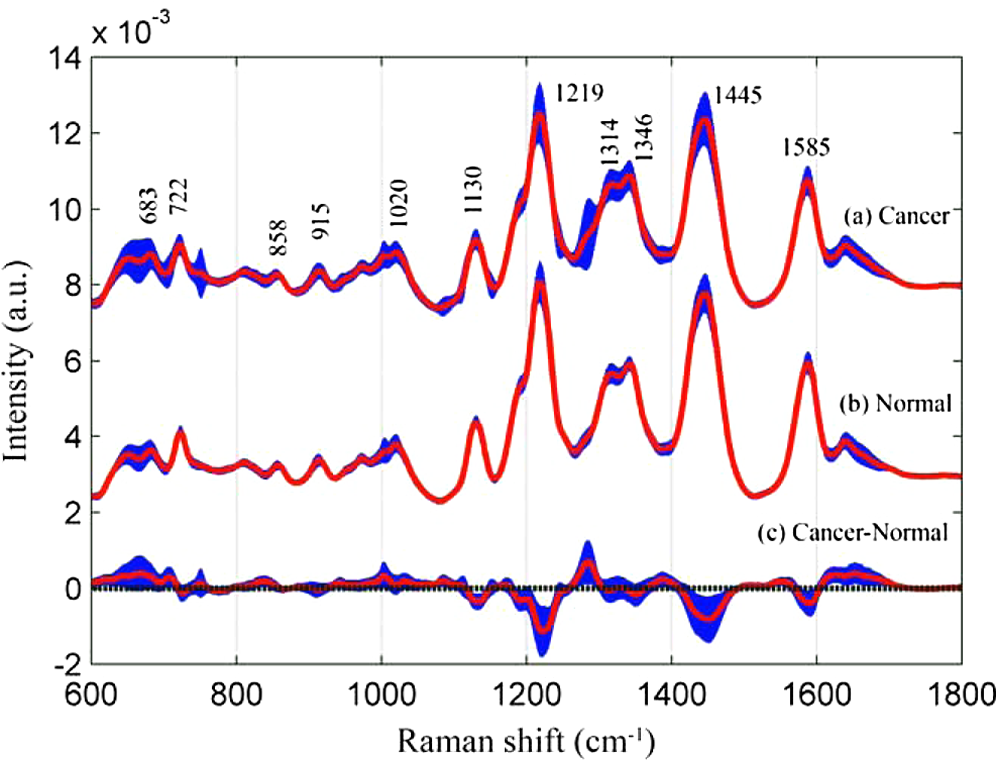 We employed linear and RBF kernel functions to develop C-SVM diagnostic algorithms for classification serum SERS spectra of esophageal cancer patients from normal volunteers. The linear C-SVM algorithm needs to be optimized to search the optimal parameter C, which gives the best trade-off between the training error and generalization ability. The search range for parameter C is performed from to with step of power of two. The overall diagnostic accuracy as a function of parameter is shown in Fig. 4. It is displayed that the largest diagnostic accuracy of 73.3% is acquired with the parameter C value at . Table 1 shows the classification results of the serum SERS spectra using the leave one out cross validation with the linear C-SVM algorithm at parameter . A diagnostic sensitivity of 73.3% and specificity of 71.0% can be obtained. Table 1Results of classification of serum SERS with different algorithms.
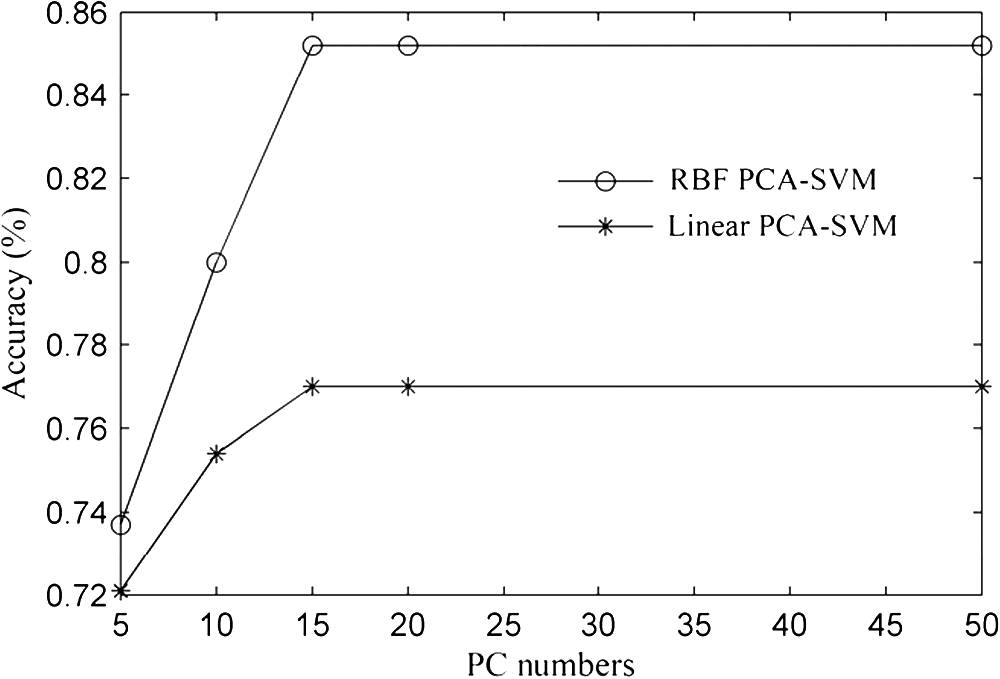
In the development of RBF kernel C-SVM algorithm, the parameter C and Gaussian width are to be optimized to build the efficient classifier. In this study the grid search is implemented to exhaustively search optimal parameters by trying various pairs of parameters. The range of C is from to and Gaussian width from 0 to . Figure 5 shows the three-dimensional (3-D) map of overall diagnostic accuracy as a function of parameter C and Gaussian radial width . It is clearly exhibits that a smaller C or gives lower diagnostic accuracy. The largest diagnostic accuracy of 80.0% locates at and . Table 1 lists the cross validation results of serum SERS spectra at the highest overall diagnostic accuracy in the RBF C-SVM. The diagnostic sensitivity of 83.3% and specificity of 83.9% are achieved for differentiation serum SERS spectra between esophageal cancers and normal subjects in the using the RBF C-SVM algorithm. Fig. 53-D map of overall diagnostic accuracy as a function of parameter C and Gaussian radial width using the RBF C-SVM algorithm.  In this study, the range of Raman spectra is from 600 to with 1108 variables, such a high-dimensional spectra would lead to a very complex calculation and time-consuming in the application of C-SVM. In addition, the spectra also contain many redundant data and noise. All these limit the efficiency of SVM technique. It is significant to reduce the dimensions of the spectral data by PCA technique to simplify the implementation of the SVM algorithm and to improve the performance. PCA is a mathematical tool that reduces the dimensions of dataset using an orthogonal transformation to convert the observations of possibly correlated variables into a set of values of linearly uncorrelated variables called principal components (PCs). The transformation is such that the first principal component has the largest possible variance, and each succeeding component has the highest variance possible under the constraint that it be orthogonal to the preceding components. Therefore the principal components are normally arranged in the order of their contributions to the variance of entire dataset. Most of the information carried in the dataset is distributed in first few principal components, and the contributions of the rest of principal components are negligible. By this orthogonal transformation, the dimensions of dataset can be significantly reduced without losing important information. When PCA is employed to process Raman spectra, it transforms Raman shift into a set of PC spectra. Each PC loading spectra is a combination of original Raman spectra. Figure 6 shows the contributions of eigenvalues of each principal component to the total variance of all serum SERS spectra. As shown in the figure, the eigenvalues drop off rapidly with increasing PC numbers, and the first few PCs retain the maximum variance of the data. For instance, the first two PCs account for 50.1% of the total variance; the first five PCs account for 74.6%; the first 10 PCs account for 89.8%; and the first 20 PCs account for 97.4%. In order to comparison the classification performance of SVM algorithm and PCA technique, PCA combination with linear discriminant analysis (PCA-LDA) is used to classify the same Raman dataset. The classification accuracy of 77.0% is obtained with the first 20 PCs scores. This result is lower than that of RBF kernel C-SVM algorithm. Fig. 6Eigenvalues of principal components contributed to the total variance of all serum SERS spectra.  Linear and RBF kernel functions are employed to develop PCA-SVM algorithm. The first 20 projection scores of serum SERS on PC loadings are used to build dataset for developing PCA-SVM models. All the parameters of PCA-SVM models need to be optimized to build efficient classifier. For linear PCA-SVM algorithm, the range of parameter C is set from to . Figure 7 exhibits dependence of classification accuracy on parameter C. It is found that largest overall diagnostic accuracy of 76.7% is obtained with the parameter C of 0.25. The cross validation results of serum SERS spectra at the parameter in the linear PCA-SVM are listed in Table 1. The diagnostic sensitivity of 76.7% and specificity of 77.4% are obtained. In the RBF kernel PCA-SVM classification, grid search approach was implemented to find the optimum values of the parameter C and Gaussian width . The range of parameter C and is set from to and from 0 to . Figure 8 shows the 3-D map of overall diagnostic accuracy as a function of parameter C and Gaussian radial width . It is clearly exhibit that a smaller C gives lower classification accuracy. The largest overall diagnostic accuracy of 83.3% locates at and . Based on the optimal values of C and , the diagnostic sensitivity of 83.3% and specificity of 86.7% are achieved in Table 1 for differentiation serum SERS spectra between normal volunteers and esophageal caner patients. Fig. 83-D map of overall diagnostic accuracy as a function of the parameter C and Gaussian radial width using the RBF PCA-SVM algorithm. 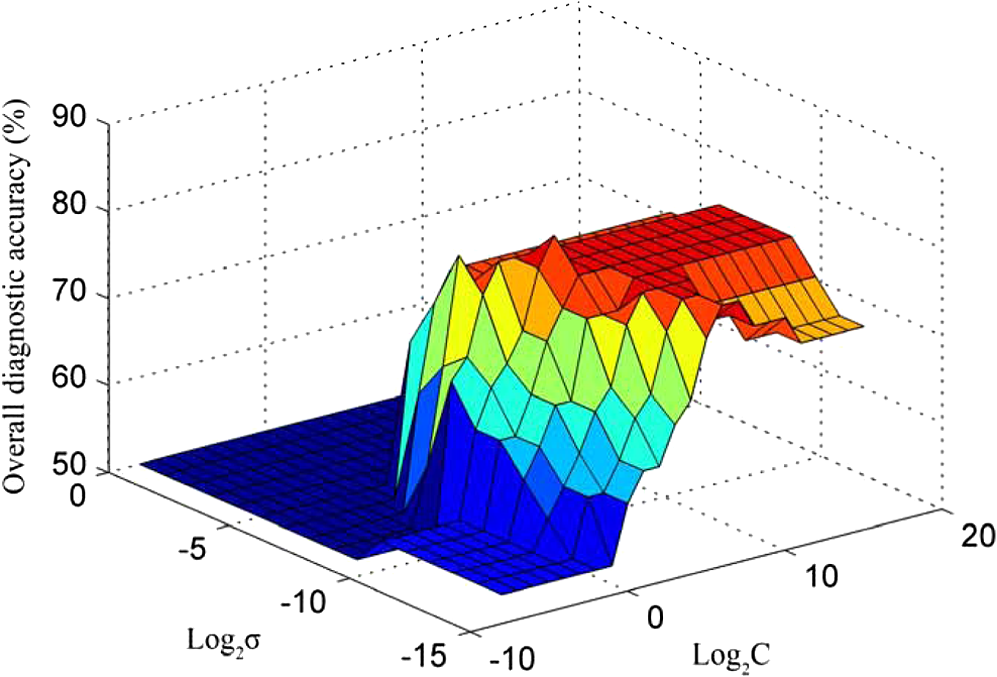 The performance of the RBF kernel PCA-SVM algorithm using different numbers of principal components scores was investigated. The results are displayed in Fig. 9. When the first five PCs are used, the classification accuracy is 73.7%. This result is higher than that of linear SVM algorithm with full spectra (72.1%). With the PCs adding up to 15, the classification accuracy increases to maximum 85.2%. When PCs continue to add, the classification accuracy of RBF PCA-SVM algorithm does not further increase. This illustrates that the first five 5 PCs capture the information of linearly separable samples, and the PCs from 5 to 15 seize the information of nonlinearly separable samples. With the PCA combination with nonlinear SVM methods, the number of variables is reduced from 1108 to 20. This shows that the PCA-SVM method considerably simplifies calculations without sacrificing diagnostic accuracy. 4.DiscussionRaman spectroscopy is a unique noninvasive detection technique that can acquire abundant structural feature and composition information of biomacromolecule. It may become a promising clinical diagnostic tool by probing subtle changes of biomolecule relevant to tissue pathology. Raman scattering signal is very weak, but with the appearance of SERS techniques, the applications of Raman spectroscopy in biomedical field are greatly advanced.9,10,28,29 In this study we have measured serum SERS of normal volunteers and esophageal cancerous patients by Ag colloid. The dramatic increase in many dominant bands in Fig. 2 implies there is a great potential to diagnose the cancer by serum SERS technique. The specific differences of SERS spectra between normal subjects and cancerous patients are observed in Fig. 3. It reflects the changes of biochemical constitutes related to malignant transformation. For instance, a considerable decrease of ( bending, collagen/lipids) in cancerous serum illustrates that the proportion of fat content is greatly reduced. The likely reason is that amplified cancerous cells consume a lot of fat, resulting in decrease of lipid molecules. This found is agreement with other reports in many cancer tissues.30 The significant increase of Raman bands from 1620 to ( stretch, amide I, -helix proteins) indicates a higher concentration of proteins in the -pleated sheet conformation for esophageal cancer, which also had been found by Maziak et al., and Bergholt et al.31 The Raman spectral profiles of cancerous and normal tissues are similar except there are subtle differences of some spectral peaks. It is difficult to distinguish cancerous tissue from normal subjects by directly contrast characteristic Raman peak. The multivariate statistical analysis method is desirable to extract a lot of useful information from Raman spectra. PCA is a conventional multivariate statistical analysis method which converts high dimensional Raman spectra into several unrelated variables without loss of valid information by orthogonal transformation. It has been widely applied to the medical diagnosis of Raman spectroscopy. SVM is another multivariate statistical analysis technique presented recently. It can process binary classification problem with nonlinear boundary by mapping to a higher dimensional space. The main advantages are that it can efficiently classify the small samples, regardless of the distribution nature of samples. In this work, we introduce C-SVM and PCA-SVM with linear and RBF kernel to differentiate serum SERS spectra of esophageal cancer patients from that of normal subjects. The performances of these diagnostic algorithms based on SVM techniques are comprehensively evaluated by leave one sample out cross validation method. To compare with conventional multivariate statistic methods, PCA-LDA was employed to classify the same dataset. The results listed in Table 1 show that the classification accuracy of RBF kernel SVM techniques (83.6%) is better than that of PCA-LDA methods (77.0%). Similar results are also proven by many other groups.17,27,32 Possible reason maybe attribute to the fact that SVM utilizes nonlinear correlations for spectra classification.17 In the course of implementing SVM algorithm, it is important to select a proper parameter to acquire maximum diagnostic accuracy. In this study, grid search and leave one out cross validation method are employed to optimize the parameter C and Gaussian width for the RBF kernel SVM algorithm. The range of C is from to and Gaussian width from 0 to with step of power of two. We obtain the maximum overall diagnostic accuracy of 80.0% for the RBF C-SVM algorithm at C of and of , and 83.3% for the RBF PCA-SVM algorithm at C of and of . In order to confirm the optimization results, the local optimization around the optimal point is implemented further. For RBF C-SVM algorithm, the range of C is from to and from to with step of ; for RBF PCA-SVM algorithm, the rang of C is from to and from to with step of . The results reveal that there is no further increase for RBF C-SVM algorithm. This demonstrates that the optimal methods are effective for the study. The present study shows that the maximum diagnostic accuracy of linear C-SVM algorithm is 72.1%, which is lower than that of linear PCA-SVM algorithm, 77.0%. The results indicate that the linear PCA-SVM algorithm is superior to the linear C-SVM algorithm in classification serum SERS spectra. The main reason may be that the linear C-SVM algorithm uses the entire spectra of 1108 variables, wherein there is some redundant information which affects the classification results. On the other hand, the linear PCA-SVM algorithm only employs 20 variables extracted from Raman spectra by PCA technique, which can refine important information contained in spectra and reduce redundant information. Similar results appear also in RBF kernel SVM algorithm. The largest overall diagnostic accuracy of RBF kernel C-SVM algorithm and RBF kernel PCA-SVM algorithm is 83.6% and 85.2%, respectively, indicating more redundant information contained in RBF C -SVM models than in RBF PCA -SVM. The performance of PCA-SVM algorithm using different numbers of PCs is investigated in Fig. 9. The overall diagnostic accuracy of RBF kernel PCA-SVM models is higher than that of linear PCA-SVM models in the same number of PCs, indicating the existence of nonlinear boundary between cancerous and normal serum SERS spectra. The overall diagnostic accuracy of 72.1% for linear kernel PCA-SVM models in the first five PCs is equal to that of linear C-SVM. This manifests that the first five PCs contain all of linear classification information for classifying linearly separable samples. The data space of C-SVM models contains entire spectra with 1108 variables. Such a high-dimensional data space will inevitable lead to computational complexity and time-consuming in optimizing and implementing SVM algorithm. For the purpose of simplifying implementation of SVM algorithm, the PCA method is introduced to reduce dimension of data space. With the combination of PCA and SVM techniques, the dimensions of serum Raman spectra are dramatically reduced from 1108 variables down to 20 variables, thus the computation is drastically decreased. This simplification is particularly important for applications that require rapid processing of a large amount of multivariate data, such as in real-time multispectral imaging and optical processing systems. As can be found from Table 1, the nonlinear SVM produces a diagnostic accuracy higher than the linear SVM, especially using RBF kernel which yielded an overall diagnostic accuracy higher than the linear SVM in C-SVM and PCA-SVM models. This reveals a fact that the optimal separating hyperplane of serum SERS is nonlinear. Hu and Lin find that RBF kernel is the most reasonable choice in SVM due to its simplicity and ability to models data of arbitrary complexity.33 In fact, the linear kernel is a special case of nonlinear kernel. Our study and other reports confirm this conclusion.20 It is reported that the accuracy of endoscopic ultrasonography in the determination of the T stage of esophageal cancer is approximately 65% to 90%, with an average sensitivity of 75% and specificity of 70%.1 In this study, we obtain a sensitivity of 83.3% and specificity of 86.7% by classifying serum SERS spectra from normal volunteers and esophageal cancer patients with RBF PCA-SVM technique. However, there are some deficiencies for this preliminary study. For example, the data set are too small, needing to expand the sample numbers. The research of the variability of sample is absent. Maybe the SERS spectra of a patient’s serum have been altered at different times. These factors need to be further studied in our future work. 5.ConclusionIn conclusion, the C-SVM methods and PCA-SVM methods are successfully implemented for the classification of serum SERS spectra from normal volunteers and esophageal cancer patients. A number of effective diagnostic models based on C-SVM and PCA-SVM techniques with different kernel functions are developed and the diagnostic performances are comprehensively evaluated and compared. The PCA-SVM methods can considerably simplify the complexity of calculation without sacrificing the performance of the algorithm. The RBF PCA-SVM algorithm is superior to PCA-LDA algorithm in classification serum SERS spectra. Serum SERS combining with SVM has great potential to provide an effective and accurate diagnostic means for noninvasive esophageal cancer detection. AcknowledgmentsThe authors would like to acknowledge the financial support of the Dongguan Science and Technology Project (201010815207), the National Natural Science Foundation of China (61275187, 60778047), Specialized Research Fund for the Doctoral Program of Higher Education of China (20114407110001), the Natural Science Foundation of Guangdong Province (9251063101000009) and the Cooperation Project in Industry, Education and Research of Guangdong province and Ministry of Education of China (2011A090200011). ReferencesM. R. Wong,
“Esophageal cancer: a systematic review,”
Curr. Probl. Cancer, 24
(6), 298
–373
(2000). http://dx.doi.org/10.1016/S0147-0272(00)80002-1 CPRCDJ 0147-0272 Google Scholar
M. S. Bergholtet al.,
“In vivo diagnosis of esophagus cancer using image-guided raman endoscopy and biomolecular modeling,”
Technol. Cancer Res. Treat., 10
(2), 103
–112
(2011). TCRTBS 1533-0346 Google Scholar
E. B. Hanlonet al.,
“Prospects for in vivo Raman spectroscopy,”
Phys. Med. Biol., 45
(2), 1
–59
(2000). http://dx.doi.org/10.1088/0031-9155/45/2/201 PHMBA7 0031-9155 Google Scholar
M. I. C. Kendallet al.,
“Vibrational spectroscopy: a clinical tool for cancer diagnostics,”
Analyst, 134
(6), 1029
–1045
(2009). http://dx.doi.org/10.1039/b822130h ANLYAG 0365-4885 Google Scholar
Y. Huet al.,
“Classification of normal and malignant human gastric mucosa tissue with confocal Raman microspectroscopy and wavelet analysis,”
Spectrochim. Acta A Mol. Biomol. Spectrosc., 69
(2), 378
–382
(2008). http://dx.doi.org/10.1016/j.saa.2007.04.009 Google Scholar
S. Duraipandianet al.,
“In vivo diagnosis of cervical precancer using Raman spectroscopy and genetic algorithm techniques,”
Analyst, 136
(20), 4328
–4336
(2011). http://dx.doi.org/10.1039/c1an15296c ANLYAG 0365-4885 Google Scholar
Z. Huanget al.,
“Near-infrared Raman spectroscopy for optical diagnosis of lung cancer,”
Int. J. Cancer, 107
(6), 1047
–1052
(2003). http://dx.doi.org/10.1002/(ISSN)1097-0215 IJCNAW 0020-7136 Google Scholar
A. Beljebbaret al.,
“Identification of Raman spectroscopic markers for the characterization of normal and adenocarcinomatous colonic tissues,”
Crit. Rev. Oncol. Hematol., 72
(3), 255
–264
(2009). http://dx.doi.org/10.1016/j.critrevonc.2009.09.004 CCRHEC Google Scholar
D. Ciallaet al.,
“Surface-enhanced Raman spectroscopy (SERS): progress and trends,”
Anal. Bioanal. Chem., 403
(1), 27
–54
(2012). http://dx.doi.org/10.1007/s00216-011-5631-x ABCNBP 1618-2642 Google Scholar
S. Abalde-Celaet al.,
“Surface-enhanced Raman scattering biomedical applications of plasmonic colloidal particles,”
J. R. Soc. Interface, 7
(Suppl. 4), S435
–S450
(2010). http://dx.doi.org/10.1098/rsif.2010.0125.focus 1742-5689 Google Scholar
X. Qianet al.,
“In vivo tumor targeting and spectroscopic detection with surface-enhanced Raman nanoparticle tags,”
Nat. Biotechnol., 26
(1), 83
–90
(2007). http://dx.doi.org/10.1038/nbt1377 NABIF9 1087-0156 Google Scholar
C. T. Nguyenet al.,
“Detection of chronic lymphocytic leukemia cell surface markers using surface enhanced Raman scattering gold nanoparticles,”
Cancer Lett., 292
(1), 91
–97
(2010). http://dx.doi.org/10.1016/j.canlet.2009.11.011 CALEDQ 0304-3835 Google Scholar
S. Fenget al.,
“Nasopharyngeal cancer detection based on blood plasma surface-enhanced Raman spectroscopy and multivariate analysis,”
Biosens. Bioelectron., 25
(11), 2414
–2419
(2010). http://dx.doi.org/10.1016/j.bios.2010.03.033 BBIOE4 0956-5663 Google Scholar
J. Linet al.,
“A novel blood plasma analysis technique combining membrane electrophoresis with silver nanoparticle-based SERS spectroscopy for potential applications in noninvasive cancer detection,”
Nanomed. Nanotechnol. Biol. Med., 7
(5), 655
–663
(2011). http://dx.doi.org/10.1016/j.nano.2011.01.012 1549-9634 Google Scholar
S. Fenget al.,
“Gastric cancer detection based on blood plasma surface-enhanced Raman spectroscopy excited by polarized laser light,”
Biosens. Bioelectron., 26
(7), 3167
–3174
(2011). http://dx.doi.org/10.1016/j.bios.2010.12.020 BBIOE4 0956-5663 Google Scholar
M. Gniadeckaet al.,
“Diagnosis of basal cell carcinoma by Raman spectroscopy,”
J. Raman Spectrosc., 28
(2–3), 125
–129
(1997). http://dx.doi.org/10.1002/(ISSN)1097-4555 JRSPAF 0377-0486 Google Scholar
S. K. MajumderN. GhoshP. K. Gupta,
“Support vector machine for optical diagnosis of cancer,”
J. Biomed. Opt., 10
(2), 024034
(2005). http://dx.doi.org/10.1117/1.1897396 JBOPFO 1083-3668 Google Scholar
C. J. C. Burges,
“A tutorial on support vector machines for pattern recognition,”
Data Min. Knowl. Discov., 2
(2), 121
–167
(1998). http://dx.doi.org/10.1023/A:1009715923555 1384-5810 Google Scholar
E. WidjajaW. ZhengZ. Huang,
“Classification of colonic tissues using near-infrared Raman spectroscopy and support vector machines,”
Int. J. Oncol., 32
(3), 653
–662
(2008). IJONES 1019-6439 Google Scholar
W. Linet al.,
“Classification of in vivo autofluorescence spectra using support vector machines,”
J. Biomed. Opt., 9
(1), 180
–186
(2004). http://dx.doi.org/10.1117/1.1628244 JBOPFO 1083-3668 Google Scholar
Y. F. W. RenE. Wang,
“A binary functional substrate for enrichment and ultrasensitive SERS spectroscopic detection of folic acid using graphene oxide/Ag nanoparticle hybrids,”
ACS Nano, 5
(8), 6425
–6433
(2011). http://dx.doi.org/10.1021/nn201606r 1936-0851 Google Scholar
H. L. J. ZhaoD. I. McleanH. Zeng,
“Automated autofluorescence background subtraction algorithm for biomedical Raman spectroscopy,”
Appl. Spectros., 61
(11), 1225
–1232
(2007). http://dx.doi.org/10.1366/000370207782597003 APSPA4 0003-7028 Google Scholar
L. V. Ganyunet al.,
“Fault diagnosis of power transformer based on multi-layer SVM classifier,”
Electric Power Syst. Res., 74
(1), 1
–7
(2005). http://dx.doi.org/10.1016/j.epsr.2004.07.008 EPSRDN 0378-7796 Google Scholar
M. A. F. AbdatY. GuermeurW. Blondel,
“Hybrid feature selection and SVM-based classification for mouse skin precancerous stages diagnosis from bimodal spectroscopy,”
Opt. Express, 20
(1), 228
–244
(2012). http://dx.doi.org/10.1364/OE.20.000228 OPEXFF 1094-4087 Google Scholar
R. F. E. OsunaF. Girosi,
“Training support vector machines: an application to face detection,”
in Proc. CVPR’97,
(1997). Google Scholar
J. W. Chanet al.,
“Micro-Raman spectroscopy detects individual neoplastic and normal hematopoietic cells,”
Biophys. J., 90
(2), 648
–656
(2006). http://dx.doi.org/10.1529/biophysj.105.066761 BIOJAU 0006-3495 Google Scholar
N. Stoneet al.,
“Near-infrared Raman spectroscopy for the classification of epithelial pre-cancers and cancers,”
J. Raman Spectrosc., 33
(7), 564
–573
(2002). http://dx.doi.org/10.1002/(ISSN)1097-4555 JRSPAF 0377-0486 Google Scholar
K. K. Maitiet al.,
“Development of biocompatible SERS nanotag with increased stability by chemisorption of reporter molecule for in vivo cancer detection,,”
Biosens. Bioelectron., 26
(2), 398
–403
(2010). http://dx.doi.org/10.1016/j.bios.2010.07.123 BBIOE4 0956-5663 Google Scholar
L. Jianget al.,
“Raman reporter-coated gold nanorods and their applications in multimodal optical imaging of cancer cells,”
Anal. Bioanal. Chem., 400
(9), 2793
–2800
(2011). http://dx.doi.org/10.1007/s00216-011-4894-6 ABCNBP 1618-2642 Google Scholar
M. S. Bergholtet al.,
“In vivo diagnosis of gastric cancer using Raman endoscopy and ant colony optimization techniques,”
Int. J. Cancer, 128
(11), 2673
–2680
(2011). http://dx.doi.org/10.1002/ijc.25618 Google Scholar
D. E. Maziaket al.,
“Fourier-transform infrared spectroscopic study of characteristic molecular structure in cancer cells of esophagus: an exploratory stud,”
Cancer Detect. Prevent., 31
(3), 244
–253
(2007). http://dx.doi.org/10.1016/j.cdp.2007.03.003 CDPRD4 0361-090X Google Scholar
M. Sattleckeret al.,
“Investigation of support vector machines and Raman spectroscopy for lymph node diagnostics,”
Analyst, 135
(5), 895
–901
(2010). http://dx.doi.org/10.1039/b920229c ANLYAG 0365-4885 Google Scholar
C.-W. HsuC.-J. Lin,
“A comparison of methods for multiclass support vector machines,”
IEEE Trans. Neural Netw., 13
(2), 415
–425
(2002). http://dx.doi.org/10.1109/72.991427 ITNNEP 1045-9227 Google Scholar
|
||||||||||||||||||||||||||||