

|
|
1.IntroductionStrong scattering of many biological tissues, including blood, decreases transmittance and therefore can reduce the spatial resolution, lower the contrast, and limit the penetration depth of light for optical imaging techniques, such as optical coherence tomography (OCT). Reduction of scattering will improve the quality of imaging that can be achieved by optical clearing of tissues and blood using various biocompatible agents as glucose, fructose, glycerol, dextrans, and others. OCT is based on low-coherence interferometry to produce cross-sectional tomographic imaging of the microstructure in biological tissues by measuring the magnitude of backscattered light.1 One main advantage of this technique is the ability to investigate turbid and highly scattering media, such as biological tissues and whole blood. Previous investigations demonstrated that OCT can be applied to imaging of various of biological tissues and objects, and can be used for study of microstructure of skin, retina, vascular plaques, etc.2–4 Whole blood is a highly scattering and absorbing medium in the visible and near infrared region. Erythrocytes [red blood cells (RBCs)] are the main scattering elements in blood. The scattering properties of erythrocytes are determined by shape, size, volume, and mass. The optical properties also depend on the concentration of hemoglobin (Hb) in the erythrocyte. Scattering properties of blood mainly depend on hematocrit, which is the volume fraction of RBCs. Normal hematocrit is about 37% to 50% for adults.5 Other effects which influence scattering properties of blood are sedimentation and aggregation of RBCs, as well as coagulation and deformation of cells. Investigation of tissues and blood by optical imaging techniques is complicated due to high scattering and absorption of blood. The refractive index of erythrocytes is much higher than that of plasma, and refractive index mismatch between erythrocytes and blood plasma is the main source of light scattering in blood. The immersion method has been successfully demonstrated for optical clearing of many biological tissues, such as skin, duramater, gastrointestinal tissues, etc.6–18 This method also represents a promising approach to enhancement of transmittance of blood.19–21 A frequency-domain OCT system was used by Ozaki et al. for intracoronary imaging in clinics.22 The application of the contrast media and dextran with low molecular weight demonstrated that these substances have comparable capability to improve the image quality, but application of dextran has more potential for use in clinical practice as it could avoid the impairment of renal function.22 Determination of optimal type and concentration of clearing agents for blood optical clearing is required for effective and nondestructive usage of optical clearing methods, including in vivo applications. In this study we investigate the influence and clearing effect after addition of biocompatible clearing agents to blood, such as polyethylene glycol (PEG), polypropylene glycol (PPG), propylene glycol (PG), and Hb with high concentrations. Changes in the transmittance of light depending on particular agent and its concentration were studied. Alterations of the form of erythrocytes and their aggregation properties after application of these agents were observed using smear microscopy. Experiments were performed on the mouse tail vein in order to investigate the effect of clearing of blood and tissues. 2.Materials and MethodsThe OCT system is based on fiber-optic Michelson interferometer, which is illuminated by low-coherence light, for example a super luminescent diode. The sample is placed in one interferometer arm and sample reflections are combined with the reflection from the reference mirror. The backscattered intensity from samples is measured by scanning the reference mirror position and simultaneously recording the amplitude of the interferometric signal. Two OCT systems (Thorlabs, New Jersey) working at 930 and 1300 nm were used in the experiments. The 930-nm OCT system was used for the in vitro studies because of its better resolution (4.7 μm in water, while the 1300-nm OCT system has the axial resolution of 9 μm in water), and the 1300-nm system was used to obtain a deeper penetration for the mouse tail vein experiments. A rectangular glass vessel (Nanostructured Glass Technology, Saratov, Russia) with internal thickness of 200 μm was used as a cuvette. In our experiments PEG, PG, and PPG (Sigma-Aldrich, USA) were used nondissolved and dissolved in saline in the different proportions. Molecular weights of PG, PEG, and PPG are 76.10, 300, and 425, respectively. For the measurements with Hb, solutions of human Hb in saline (with the addition of ethylene glycol) with a concentration of (Agat-Med, Russia) were used. In order to obtain the concentration of Hb at , these Hb solutions were dissolved in saline. Human blood was mixed in a ratio 1:1 with all these substances. The total attenuation coefficient and enhancement of transmission of blood after addition of clearing agents were calculated using OCT profiles of samples. The effect of clearing agents on RBCs was studied by a smear microscopy. Refractive indices of the clearing agents were measured using Abbe refractometer. All OCT and refractive index measurements were carried out at room temperature (approximately 20°C). 3.Theoretical BackgroundThe scattering properties of blood depend on the refractive index mismatch between erythrocyte and ground matter (blood plasma). The scattering coefficient of blood depends on the ratio: where is the refractive index of a RBC; is the refractive index of ground matter.The refractive index of RBCs mainly depends on the concentration of Hb inside the cell. In the visible range, the refractive index of blood plasma is 1.34, while the refractive index of erythrocytes is 1.4.20 This difference causes the high scattering coefficient of blood. When a solution with a higher refractive index than the refractive index of blood plasma is added to blood, the difference between erythrocyte and ground matter decreases because of increase of refractive index of ground matter. The decrease of the refractive index mismatch leads to a decrease of the scattering coefficient of blood, and therefore, enhancement of transmission should be observed. The mean square of the photodetector heterodyne signal current received by an OCT system from the probing depth is a product of two factors: the mean square heterodyne signal in the absence of scattering , and the heterodyne efficiency factor , describing the signal degradation due to scattering,23–26 i.e., The is proportional to the factor of light power to current conversion, the power of the reference and input sample arm beams, the effective backscattering cross-section, and irradiance radius at the probing depth in the absence of scattering. The heterodyne efficiency factor contains the scattering effects. It has been shown that for only the single scattering contribution, The factor 2 in the exponent of Eq. (3) accounts for the round-trip attenuation to and from depth of in the sample arm.The OCT measures backscattering or reflectance from the RBCs versus axial ranging distance, or depth, . OCT images and corresponding reflectance profile for diluted blood are presented in Fig. 1. The reflectance depends on the optical properties of blood, i.e., the total attenuation coefficient . In the absence of absorption, the scattering coefficient can be determined from the slope of the OCT signal. For media with absorption and described by the single scattering approximation, the light travels in a ballistic way, and Beer’s law can be applied to calculate the total OCT attenuation coefficient: . Thus, can be obtained by subtracting the absorption coefficient from the total attenuation coefficient obtained from the slope of the OCT signal. For optical depths less than 4, the reflected power can be approximately proportional to in exponential scale according to the single scattering model,20,21 i.e., by using Eqs. (2) and (3), the OCT signal can be found as27 Here, is the optical power launched into the blood sample, and is the reflectivity of the blood sample at depth .Fig. 1Optical coherence tomography (OCT) image (a) and corresponding OCT A-scan profile (b) of blood in the cuvette; “A” corresponds to air/glass border, “B” corresponds to blood/glass border. 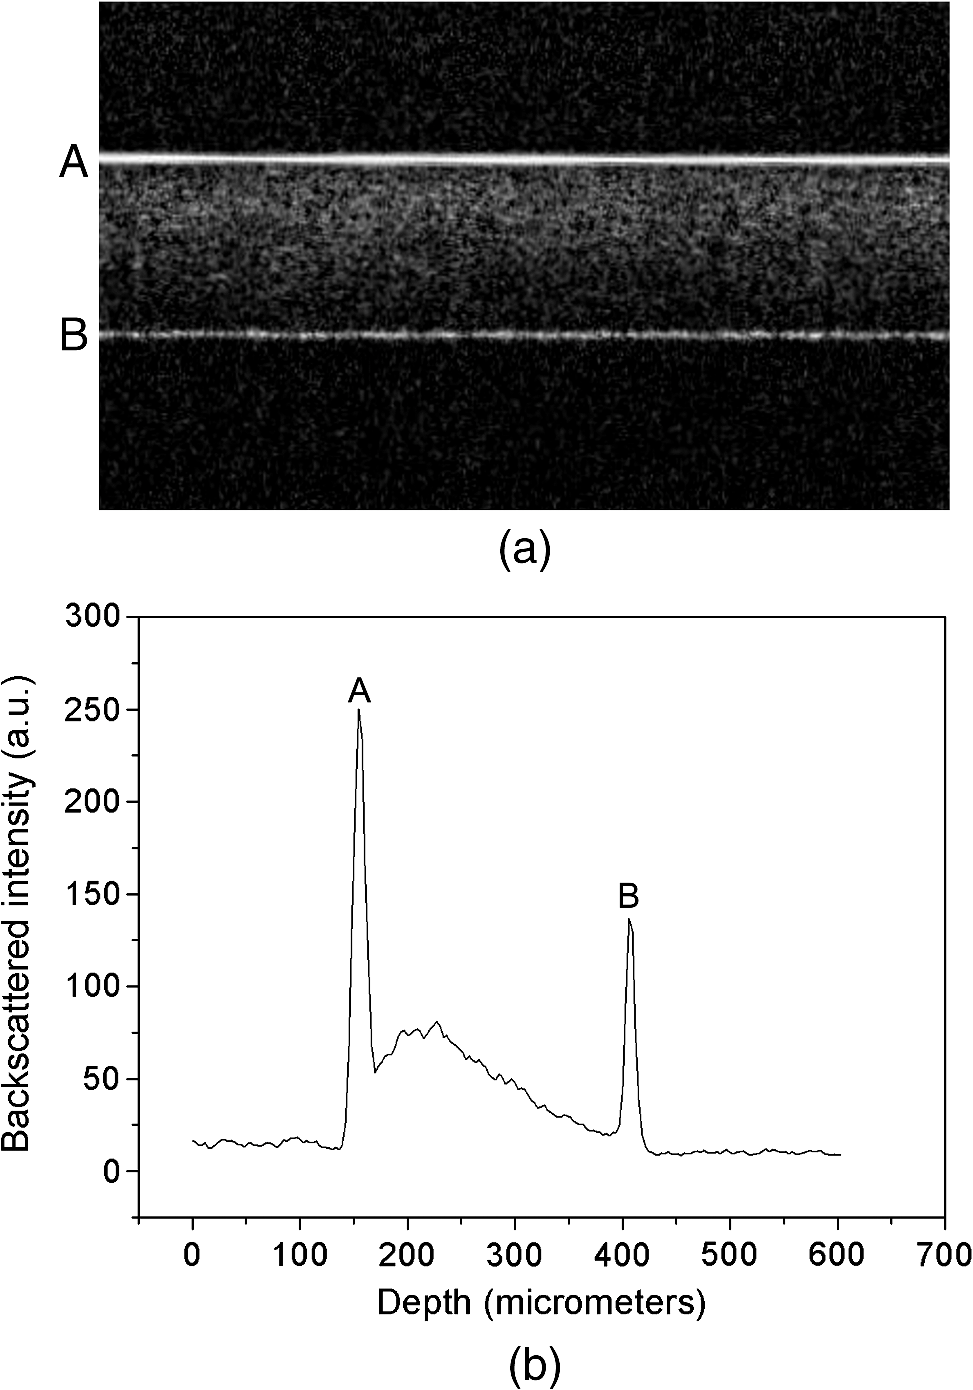 Measurement of OCT reflectance for two depths, and , allows one to evaluate the approximate attenuation coefficient and its temporal behavior due to reduction of blood scattering coefficient at the agent immersion if reflectivity is considered as weakly dependent on depth for a homogeneous blood layer: where and are two different depths for -scan (-axis); ; and and are magnitudes of reflectance for these scanning depths.It should be noted that optical properties of tissues and blood can be estimated using the OCT method. Data for the scattering coefficient measured for many tissues can be found in the literature.25 Determination of scattering anisotropy is also possible using OCT.26 Enhancement of transmission (optical clearing) was calculated for every sample using the following equation:20,21 where is reflectance of the samples with clearing agents; is reflectance of the control sample (without clearing agent).4.Results and DiscussionThe mechanism of blood optical clearing depends on the type and concentration of applied agents. Recently, Tuchin et al.20,21 presented the results of investigations by OCT of optical clearing of blood by several chemical agents. It was shown that for twice diluted whole blood, the addition of 6.5% of glycerol leads to an increase of transmittance (i.e., optical clearing) up to 17%, while the total attenuation coefficient decreased by a factor of two. It was also found that application of dextrans can lead to an enhancement of transmittance of 150.5%. Dextrans with high molecular weight demonstrated better clearing properties than dextrans with low molecular weight. This effect was explained by the assumption that dextrans with high molecular weight have more ability to increase aggregation of erythrocytes, which results in increased transmittance, and therefore, optical clearing is achieved. Furthermore, the higher refractive index of dextran with high molecular weight provides better refractive index matching between blood plasma and erythrocytes. Dextran and the intravenous contrast agent and its influence on transmittance of blood were investigated by Brezinski et al.19 Application of dextran and the intravenous contrast agent significantly increased penetration of light in blood; addition of dextran led to increase in signal intensity of 69%, while the intravenous contrast agent added to blood increased reflectance to 45%. The effect of the intravenous contrast agent on the increase of light penetration was attributed to a decrease of RBC volume caused by addition of the agent. In this study, clearing agents were added to blood, and then OCT measurements of blood in a cuvette were performed. The total attenuation coefficient of blood samples is presented in Fig. 2 for PEG, PPG, and PG. The refractive indices, measured at 589 nm, of the mixtures are provided in Table 1. Blood was mixed with saline and the agents in a 1:1 proportion (one part blood and one part saline, or dissolved agent in saline, or nondissolved agent). The agents were used nondissolved (corresponds to “1:0” in Fig. 2 and Table 1) and dissolved in saline in 1:1 and 1:3 ratios (1 part agent and 3 parts saline), which correspond to “1:1” and “1:3,” respectively, in Fig. 2 and Table 1. The agents were added to blood in a 1:1 ratio; “0” corresponds to blood mixed with saline in a 1:1 ratio. Fig. 2Total attenuation coefficient of blood mixed with saline, polyethylene glycol (PEG), polypropylene glycol (PPG), and propylene glycol (PG) in a 1:1 proportion. The data obtained using the optical coherence tomography (OCT) system at 930 nm. 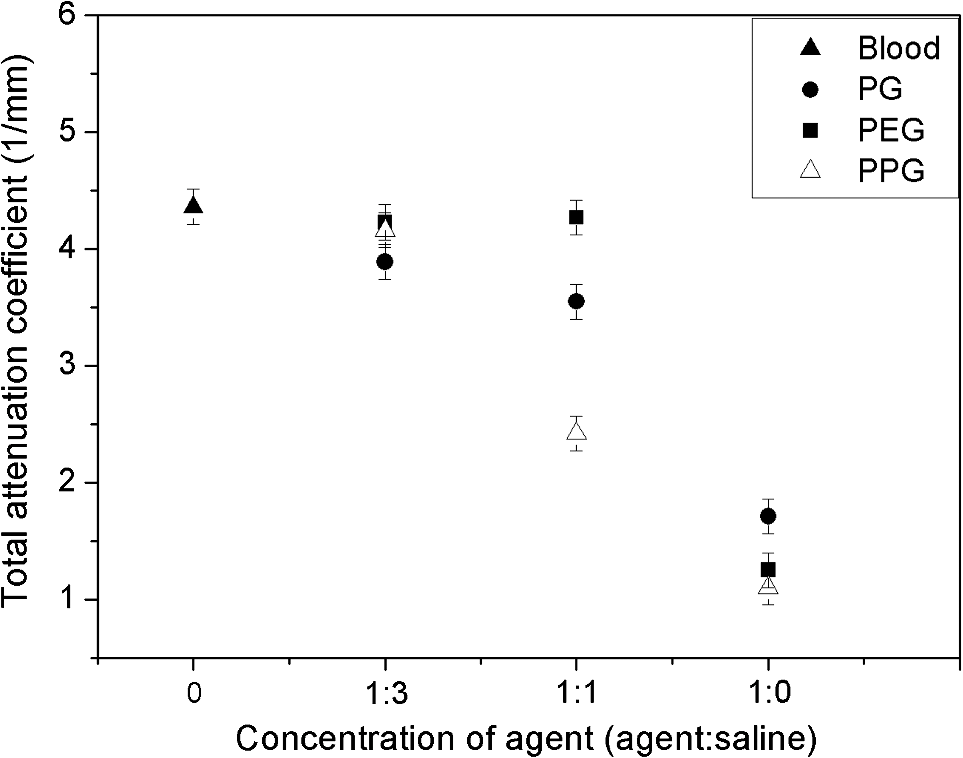 Table 1Refractive index of PG, PPG, and PEG at 589 nm.
The measurements of refractive indices of clearing agents used in this study were carried out to compare the refractive indices of the agents and erythrocytes. Although the measurements were made at the wavelength of 589 nm, the difference between refractive indices of erythrocytes and clearing agents at the wavelength of 930 nm is assumed not to be considerably changed compared to the difference at 589 nm, because PEG, PPG, and PG do not have absorption bands in the region around 930 nm. As can be seen from Fig. 2, nondissolved PEG, PPG, and PG have the most clearing ability. Application of these agents leads to a decrease of the total attenuation coefficient by a factor of four. Transmittance was enhanced by 94%, 148%, and 162% for PEG, PG, and PPG, respectively (Fig. 3). According to microscopic investigations, after addition of PEG, strong changes of size and shape of erythrocytes were observed [see Fig. 4(c)]; the erythrocytes are shrunken and elongated. PG possibly induces partial hemolysis of erythrocytes; it is possible that after addition of PG erythrocytes became much thinner [Fig. 4(g)]. Application of PPG causes strong changes in the shape of erythrocytes [Fig. 4(e)]. Fig. 3Enhancement of transmittance for various clearing agents mixed with blood. Data were obtained using the optical coherence tomography (OCT) system at 930 nm. The agents polyethylene glycol (PEG), polypropylene glycol (PPG), and propylene glycol (PG) were used nondissolved.  Fig. 4Microscopic images of blood: (a) after addition of saline; (b) after addition of hemoglobin; (c) after addition of polyethylene glycol (PEG); (d) after addition of PEG and subsequent addition of saline; (e) after addition of polypropylene glycol (PPG); (f) after addition of PPG and subsequent addition of saline; (g) after addition of propylene glycol (PG); (h) after addition of PG and subsequent addition of saline.  There is a large difference between total attenuation coefficients of the samples when the clearing agents mixed with saline in a proportion of 1:1 and then added to blood (Fig. 2). In this case the difference between aggregation properties of blood was observed, which can be explained by the assumption that PEG, PPG, and PG have different osmotic properties after dissolving in saline. Addition of PG and PEG dissolved in a 1:1 proportion do not strongly influence the scattering properties of blood, while addition of PPG leads to the formation of big aggregates, which results in decreasing the total attenuation coefficient of blood. PEG and PPG induce aggregation of blood and formation of big aggregates. Therefore, the effect of blood clearing using these agents can be mostly caused by aggregation of blood, and, to a lesser degree, by refractive index matching between blood plasma and erythrocytes because PEG and PPG have high refractive indices (Table 1). In case of PG, hemolysis possibly provides a decrease of transmittance, along with refractive index matching. Microscopic photographs show that after addition of saline to the blood sample with PEG or PPG, recovery of the erythrocyte shape was observed for some erythrocytes [Fig. 4(d) and 4(f)]; therefore, the aggregation of erythrocytes upon influence of these agents may be reversible. Mie-based theoretical analysis performed by Tuchin et al.28 demonstrated that local hemolysis and release of Hb in plasma can possibly be applied for the purpose of optical clearing because, in this case, Hb increases the refractive index of blood plasma. It was shown that the scattering coefficient of blood in the spectral region from 400 to 1000 nm decreased by up to 30% to 40% when the volume of hemolyzed blood increased by up to 20% of the blood volume. Popescu et al.29 investigated the dynamics and morphology of erythrocytes by Hilbert phase microscopy, and has proven this concept experimentally. The optical clearing method was suggested for the study of live erythrocytes; in particular, for study of the temporal dependence of the decrease of volume of erythrocytes during the process of hemolysis. In this study, Hb solutions with concentrations of 80 and were added to whole blood in a 1:1 proportion, and the total attenuation coefficient decreased by factors of 1.3 and almost 1.5, respectively (Fig. 5). Enhancement of transmittance for blood mixed with Hb is 30% for the and 51% for concentrations, respectively (Fig. 3). The refractive indices of added Hb solutions were 1.362 and 1.390, respectively (Table 2), and the last value is close to the refractive index of erythrocytes, which is about 1.4. Microscopic photographs [Fig. 4(b)] demonstrate that after addition of Hb, no significant changes of the form of erythrocytes were observed. After addition of Hb, the refractive index of ground matter became higher. Therefore, it can be assumed that the main cause of the enhancement of light transmission is refractive index matching between plasma and erythrocyte. Fig. 5Total attenuation coefficient calculated for blood with added saline and Hb solutions in a 1:1 proportion. The data were obtained with the optical coherence tomography (OCT) system at 930 nm. 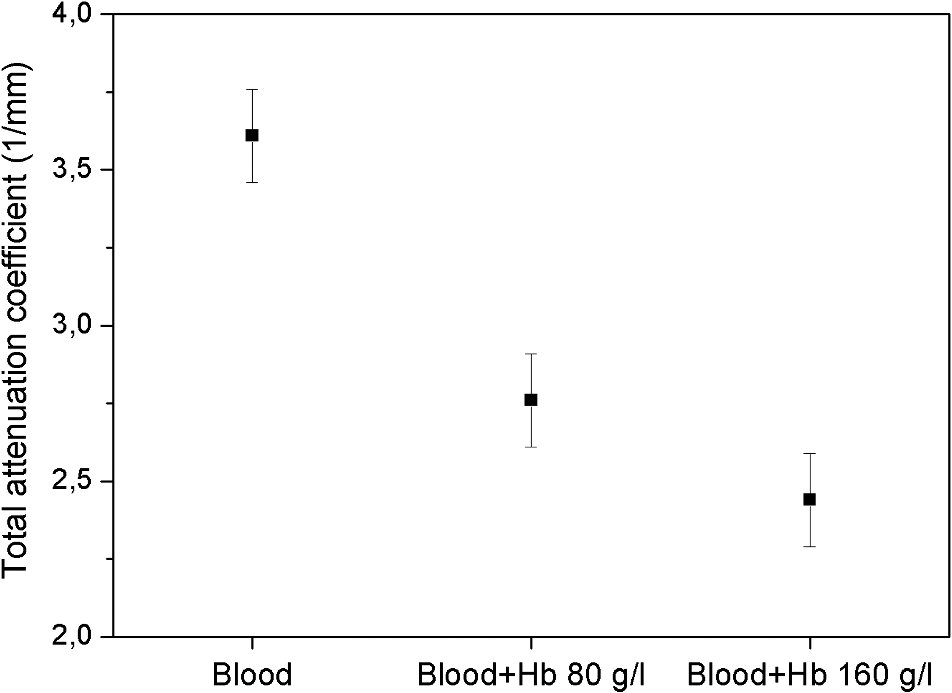 Table 2Refractive index of Hb at 589 nm.
The hematocrit of all blood samples used in our experiments was supposed to be in a range of 18% to 25%. A study of optical properties of flowing blood made by Roggan et al.30 using a double-integrating sphere technique and inverse Monte Carlo simulation showed that the scattering coefficient was at 900 nm, and the absorption coefficient was at 5% hematocrit. The experimentally obtained values by Meinke et al.31 for erythrocytes in saline solution with the 25.6% hematocrit were found to be approximately for and 0.5 mm-1 for . In our study, the total attenuation coefficient of the blood samples without clearing agents calculated from OCT measurements was 4.4 and (Figs. 2 and 5, respectively). Therefore, our data are lower than the results presented by other authors. This disagreement can possibly be due to different methods of measurements and calculations. Recently, several studies on skin optical clearing were performed.11,17,18 In particular, it was shown that the intradermal injection of glycerol and glucose solution leads to a decrease of the reflectance of skin immediately after injection of the agent, while the decrease of reflectance was stronger after injection of glucose compared to glycerol.11 We applied PPG and Hb with the concentration of for OCT imaging of the mouse tail vein. The animal was euthanized by carbon dioxide before the measurements. Intravenous injections of Hb with the concentration of or PPG were made in combination with intradermal injection of fructose to reduce scattering of tissues. Fructose dissolved in saline with a concentration was injected intradermally, and after 1 min, the agent was intravenously injected. Figure 6 represents the OCT images of tail veins of mice with and without application of clearing agents and respective OCT profiles of backscattered intensity. The tail vein can be seen in the center of the Fig. 6(d) and 6(e). Fig. 6(1) Optical coherence tomography (OCT) images (about ) of the tail veins of five mice: (a) mouse tail vein without any agents; (b) mouse tail vein after intradermal injection of fructose solution with the concentration of ; (c) mouse tail vein after intradermal injection of fructose and intravenous injection of saline; (d) mouse tail vein after intradermal injection of fructose and intravenous injection of polypropylene glycol (PPG); (e) mouse tail vein after intradermal injection of fructose and intravenous injection of Hb with the concentration of ; (2) A-scans of the OCT images. All images produced with OCT at 1300 nm.  Several different measurements on the mouse tail were performed. At first, fructose was injected intradermally, and measurements were carried out about 1 min after that. As it can be seen from Fig. 6(b), injection of fructose does not lead to increase of light penetration depth in the mouse tail vein. Intradermal injection of fructose and consequent injection of saline in the mouse tail vein also did not lead to an increase of transmittance [Fig. 6(c)]. Intravenous injection of Hb with the concentration of or PPG was done 1 min after injection of fructose, and the measurements were recorded immediately after injection of Hb or PPG in the tail vein. As the mouse was dead, and therefore the blood flow stopped, the clearing agent does not leave the vein after the injection. The volume of fructose, Hb, and PPG was about 0.03 to 0.05 mL, which is about 2% of total blood volume in a mouse. Injection of the agents in the mouse tail vein after intradermal injection of fructose leads to a significant increase of transmittance [Fig. 6(d) and 6(e)] several minutes after application of the agents, and allows imaging of tissue structures lying beyond the blood vein. Experiments with mice demonstrated that injection of saline and consequent partial dilution of blood does not produce any noticeable effect on enhancement of transmittance. A significant clearing effect can be achieved shortly after a clearing agent (PPG or Hb) are injected in the vein after intradermal injection of fructose. Injection of the clearing agent in the vein results in penetration of these agents into the vein wall and consequent increase of transmittance. Thus, the combination of intradermal injection of fructose and injection of Hb or PPG into the vein allows imaging of blood vein and surrounding tissues. To summarize, our studies show that application of PEG, PPG, PG, and highly concentrated Hb solutions alter optical parameters of blood. Refractive index matching between blood plasma and RBCs is one of the causes of reducing of light attenuation in blood; however, when clearing agents are added to blood, some other effects can appear and concur with the effect on refractive index matching. Some clearing agents cause alterations of aggregation properties of blood, which result in an increase of transmittance. Variations of the form of erythrocytes may lead to changes of transmittance. The effect of aggregation of erythrocytes after addition of PEG and PPG are considered to be the main cause of the clearing effect. Hb solutions added to blood do not cause any aggregation or significant deformation of erythrocytes. Application of highly concentrated Hb leads to matching of the refractive indices of scatterers and ground media and also resulting in increase of transmittance. The partial lysis of erythrocytes can be a potential cause of an increase in transmittance due to reduction of scattering between blood plasma and erythrocytes, followed by destroying of RBCs, along with increasing the refractive index of ground matter resulting from the release of Hb from erythrocytes. Experiments carried out with mice demonstrated that enhancement of light transport through skin and blood vessels can be achieved shortly after application of clearing agents to skin in combination with intravenous injection of the clearing agent into the blood vessel. Indeed, optical clearing agents (OCAs) should be applied for in vivo studies with caution because of their impact on blood cells (Fig. 4); however, all of them could be used in vivo with the appropriate motivation. For example, dextrans, which may have aggregation-disaggregation ability with a dependence on molecular weight and concentration,20,21 were successfully used in clinics for intravascular OCT imaging.22 If an OCA is applied locally in the vicinity of the internal or external optical probe, then the range of applicable agents can be broader. For example, in Ref. 28, it was suggested to provide hemolysis of blood locally to provide temporary optical clearing in the working area of an endoscopic OCT probe. In that case, PG, also studied in this paper, in addition to its own optical clearing efficiency has additional benefits because of blood hemolysis [see Fig. 4(g)] and producing free Hb, which has optical clearing properties as well. Adding PEG and PPG to blood caused RBC deformation and aggregation [Fig. 4(c) and 4(e)], while consequent addition of saline to the sample of blood with PEG or PPG leads to recovery and partial disaggregation of RBCs [Fig. 4(d) and 4(f)]. In flowing blood, the aggregates are supposed to revert to the normal state. Therefore, all OCAs described in this paper, and many others,12,13,15,16 can be used for in vivo applications of the optical clearing method. 5.ConclusionsLight scattering in blood and tissues can be effectively reduced by the application of biocompatible substances. Dilution of blood by various clearing agents is a possible method for increasing the imaging depth for in vivo optical imaging. Our studies demonstrated that the application of PEG, PPG, PG, and highly concentrated Hb solutions enhance light transport in tissues and blood due to different causes such as aggregation of erythrocytes, alterations of their shape and size, hemolysis, and refractive index matching between erythrocytes and blood plasma. The presented results may have promise for immediate clinical applications. AcknowledgmentsThis study was supported by NBIP Ireland funded under the Higher Education Authority PRTLI Cycle 4, co-funded by the Irish Government and the EU—Investing in your future and by Grant Nos. RFBR 11-02-00560-a, 224014 PHOTONICS4LIFE of FP7-ICT-2007-2, and 1.4.09 of RF Ministry of Education and Science; RF Governmental Contract Nos. 11.519.11.2035, 14.B37.21.0728, and 14.В37.21.0563; FiDiPro, TEKES Program (40111/11), Finland; SCOPES EC, Uzb/Switz/RF, Swiss NSF, IZ74ZO 137423/1; and RF President’s Grant, “Scientific Schools,” No. 1177.2012.2. The authors are grateful to Charles McHale (REMEDI, NUI Galway, Ireland) for the technical assistance in the experiments with mice. ReferencesD. Huanget al.,
“Optical coherence tomography,”
Science, 254
(5035), 1178
–1181
(1991). http://dx.doi.org/10.1126/science.1957169 SCIEAS 0036-8075 Google Scholar
P. Patwariet al.,
“Assessment of coronary plaque with optical coherence tomography and high-frequency ultrasound,”
Am. J. Cardiol., 85
(5), 641
–644
(2000). http://dx.doi.org/10.1016/S0002-9149(99)00825-5 AJNCE4 0258-4425 Google Scholar
A. Podoleanuet al.,
“Three dimensional OCT images from retina and skin,”
Opt. Express, 7
(9), 292
–298
(2000). http://dx.doi.org/10.1364/OE.7.000292 OPEXFF 1094-4087 Google Scholar
Y. Yasunoet al.,
“Birefringence imaging of human skin by polarization-sensitive spectral interferometric optical coherence tomography,”
Opt. Lett., 27
(20), 1803
–1805
(2002). http://dx.doi.org/10.1364/OL.27.001803 OPLEDP 0146-9592 Google Scholar
R. Hoffmanet al., Hematology: Basic Principles and Practice, 3rd ed.Churchill Livingstone, Inc., New York
(2000). Google Scholar
V. V. Tuchinet al.,
“Light propagation in tissues with controlled optical properties,”
J. Biomed. Opt., 2
(4), 401
–417
(1997). http://dx.doi.org/10.1117/12.281502 JBOPFO 1083-3668 Google Scholar
G. Vargaset al.,
“Use of an agent to reduce scattering in skin,”
Laser. Surg. Med., 24
(2), 133
–141
(1999). http://dx.doi.org/10.1002/(ISSN)1096-9101 LSMEDI 0196-8092 Google Scholar
H. RashedJ. IzattC. Toth,
“Optical coherence tomography of the retina,”
Opt. Photon. News, 13
(4), 48
–51
(2002). http://dx.doi.org/10.1364/OPN.13.4.000048 OPPHEL 1047-6938 Google Scholar
R. K. WangJ. B. Elder,
“Propylene glycol as a contrasting agent for optical coherence tomography to image gastrointestinal tissues,”
Laser. Surg. Med., 30
(3), 201
–208
(2002). http://dx.doi.org/10.1002/(ISSN)1096-9101 LSMEDI 0196-8092 Google Scholar
A. N. Bashkatovet al.,
“Glucose and mannitol diffusion in human dura mater,”
Biophys. J., 85
(5), 3310
–3318
(2003). http://dx.doi.org/10.1016/S0006-3495(03)74750-X BIOJAU 0006-3495 Google Scholar
E. I. Galanzhaet al.,
“Skin backreflectance and microvascular system functioning at the action of osmotic agents,”
J. Phys. D Appl. Phys., 36
(14), 1739
(2003). http://dx.doi.org/10.1088/0022-3727/36/14/313 JPAPBE 0022-3727 Google Scholar
V. V. Tuchin, Optical Clearing of Tissues and Blood, PM154 SPIE Press, Bellingham, WA
(2006). Google Scholar
V. V. TuchinR. K. WangA. T. Yeh,
“Special section on optical clearing of tissues and cells,”
J. Biomed. Opt., 13
(2), 021101
(2008). http://dx.doi.org/10.1117/1.2903745 JBOPFO 1083-3668 Google Scholar
X. Wenet al.,
“Controling the scattering of Intralipid by using optical clearing agents,”
Phys. Med. Biol., 54
(22), 6917
(2009). http://dx.doi.org/10.1088/0031-9155/54/22/011 PHMBA7 0031-9155 Google Scholar
E. A. GeninaA. N. BashkatovV. V. Tuchin,
“Tissue optical immersion clearing,”
Exp. Rev. Med. Dev., 7
(6), 825
–842
(2010). http://dx.doi.org/10.1586/erd.10.50 1743-4440 Google Scholar
V. V. TuchinM. LeahyD. Zhu,
“Special Issue on optical clearing for biomedical imaging in the study of tissues and biological fluids,”
J. Innov. Opt. Health Sci., 3
(3), 147
–219
(2010). http://dx.doi.org/10.1142/S1793545810001076 Google Scholar
X. Wenet al.,
“In vivo skin optical clearing by glycerol solutions: mechanism,”
J. Biophoton., 3
(1–2), 44
–52
(2010). http://dx.doi.org/10.1002/jbio.200910080 JBOIBX 1864-063X Google Scholar
D. Zhuet al.,
“Imaging dermal blood flow through the intact rat skin with an optical clearing method,”
J. Biomed. Opt., 15
(2), 026008
(2010). http://dx.doi.org/10.1117/1.3369739 JBOPFO 1083-3668 Google Scholar
M. Brezinskiet al.,
“Index matching to improve optical coherence tomography imaging through blood,”
Circulation, 103
(15), 1999
–2003
(2001). http://dx.doi.org/10.1161/01.CIR.103.15.1999 CIRCAZ 0009-7322 Google Scholar
V. V. TuchinX. XuR. K. Wang,
“Dynamic optical coherence tomography in studies of optical clearing, sedimentation, and aggregation of immersed blood,”
Appl. Opt., 41
(1), 258
–271
(2002). http://dx.doi.org/10.1364/AO.41.000258 APOPAI 0003-6935 Google Scholar
X. Xuet al.,
“Effect of dextran-induced changes in refractive index and aggregation on optical properties of whole blood,”
Phys. Med. Biol., 48
(9), 1205
(2003). http://dx.doi.org/10.1088/0031-9155/48/9/309 PHMBA7 0031-9155 Google Scholar
Y. Ozakiet al.,
“Comparison of contrast media and low-molecular-weight dextran for frequency-domain optical coherence tomography,”
Circ. J., 76
(4), 922
–927
(2012). http://dx.doi.org/10.1253/circj.CJ-11-1122 JCIRA2 0047-1828 Google Scholar
L. ThraneH. T. YuraP. E. Andersen,
“Analysis of optical coherence tomography systems based on the extended Huygens-Fresnel principle,”
J. Opt. Soc. Am. A, 17
(3), 484
–490
(2000). http://dx.doi.org/10.1364/JOSAA.17.000484 JOAOD6 0740-3232 Google Scholar
D. Levitzet al.,
“Determination of optical scattering properties of highly-scattering media in optical coherence tomography images,”
Opt. Express, 12
(2), 249
–259
(2004). http://dx.doi.org/10.1364/OPEX.12.000249 OPEXFF 1094-4087 Google Scholar
Y. Yanget al.,
“Optical scattering coefficient estimated by optical coherence tomography correlates with collagen content in ovarian tissue,”
J. Biomed. Opt., 16
(9), 090504
(2011). http://dx.doi.org/10.1117/1.3625247 JBOPFO 1083-3668 Google Scholar
V. M. Kodachet al.,
“Determination of the scattering anisotropy with optical coherence tomography,”
Opt. Express, 19
(7), 6131
–6140
(2011). http://dx.doi.org/10.1364/OE.19.006131 OPEXFF 1094-4087 Google Scholar
R. K. WangV. V. Tuchin,
“Optical coherence tomography: light scattering and imaging enhancement,”
Coherent-Domain Optical Methods: Biomedical Diagnostics, Environmental Monitoring and Material Science, 665
–742 Springer-Verlag, Berlin, Heidelberg, New York
(2012). Google Scholar
V. Tuchinet al.,
“Theoretical study of immersion optical clearing of blood in vessels at local hemolysis,”
Opt. Express, 12
(13), 2966
–2971
(2004). http://dx.doi.org/10.1364/OPEX.12.002966 OPEXFF 1094-4087 Google Scholar
G. Popescuet al.,
“Erythrocyte structure and dynamics quantified by Hilbert phase microscopy,”
J. Biomed. Opt., 10
(6), 060503
(2005). http://dx.doi.org/10.1117/1.2149847 JBOPFO 1083-3668 Google Scholar
A. Rogganet al.,
“Optical properties of circulating human blood in the wavelength range 400–2500 nm,”
J. Biomed. Opt., 4
(1), 36
–46
(1999). http://dx.doi.org/10.1117/1.429919 JBOPFO 1083-3668 Google Scholar
M. Meinkeet al.,
“Empirical model functions to calculate hematocrit-dependent optical properties of human blood,”
Appl. Opt., 46
(10), 1742
–1753
(2007). http://dx.doi.org/10.1364/AO.46.001742 APOPAI 0003-6935 Google Scholar
|
||||||||||||||||||||||||


