|
|
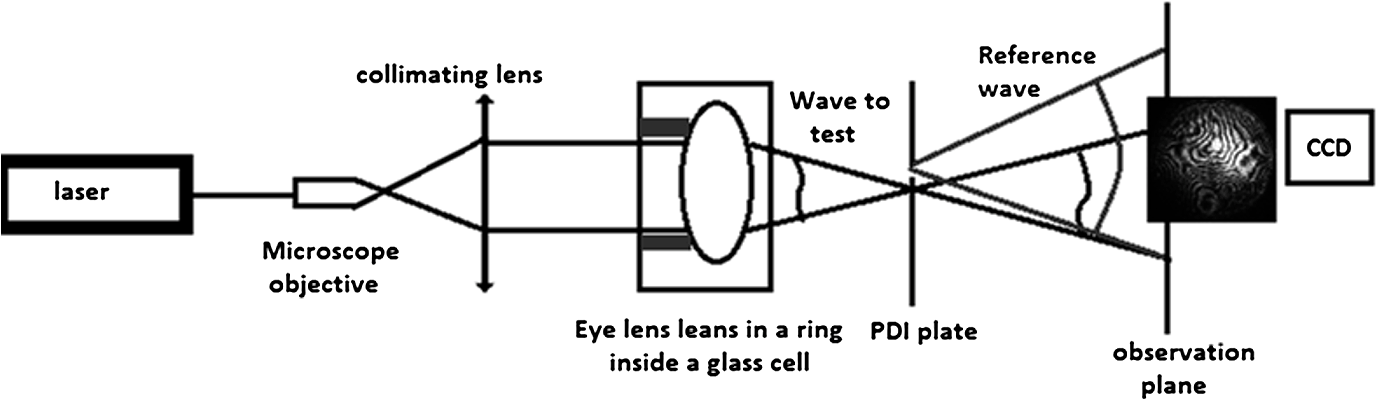
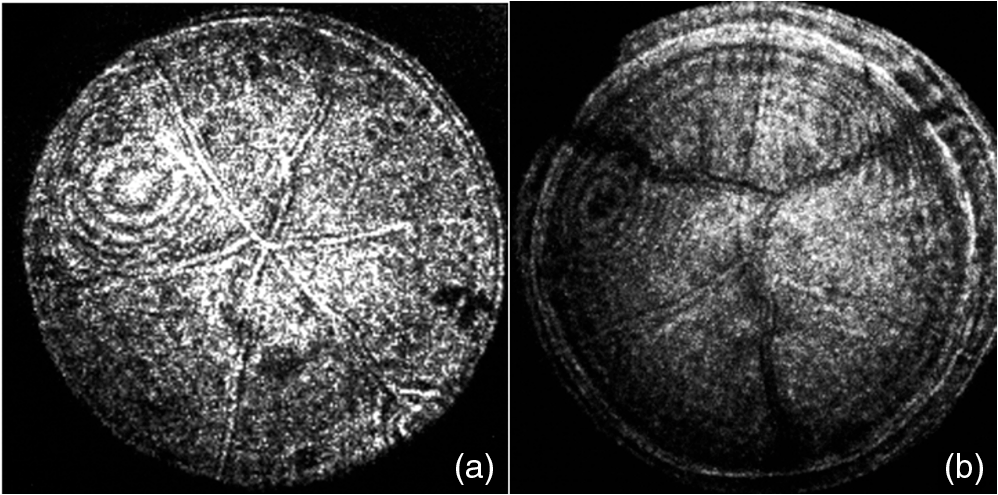
1.IntroductionIn the case of humans, the crystalline lens accounts for about one-third of the optical power, and, thanks to its elasticity, the eye is able to focus on objects at different distances by means of accommodation.1,2 These characteristics make it one of the most important refractive elements of the eye, and therefore we need to gain a deep understanding of its optical properties.3,4 All analyses of vertebrates show that lenses are composed of long fiber-like cells of uniform cross-sectional hexagonal shape and size.4–6 As these fibers grow, suture patterns are not identical in all species. Also within the same species there are slight variations in the development of the lens. In the case of fishes, birds, and reptiles, they converge at one point giving rise to what are known as umbilical sutures, one extending from the anterior pole and the other from the posterior one. In amphibians and rabbits, they are linear; and in mammals such as cats, rodents, dogs, pigs, sheep, and cows, they form a Y on the front and an inverted Y on the posterior face. In primates and humans the structure is more complex, forming so-called star-shaped sutures.2–7 Given that for primates and humans, the lens exhibits a Y-shaped suture pattern throughout the fetal period of development, different studies employing different techniques have been performed to analyze the optical properties for different species with this kind of suture pattern as a starting point to gain a better understanding of the role of lens aberrations. Results from the initial studies conducted by Roorda and Glasser2 show the presence of significant amounts of astigmatism, coma, and trefoil in one porcine lens and one macaque lens. Their work only describes a relationship between trefoil and suture pattern. Recently, Acosta et al.3,8 and Gargallo et al9 conducted a statistical study of porcine and bovine lenses in search of dominant aberrations. These studies point to sutures as being mainly responsible for trefoil and primary astigmatism, but none were analyzed in depth (to locate the suture responsible for the aberration) nor were other nonsymmetric aberrations identified. Two main techniques are commonly used to measure the optical aberrations of eye lenses: laser ray-trace scanning2 and point diffraction interferometry (PDI).8 The first measures the local slopes of the wavefront of the lens at different sampling points and then uses this information to estimate its optical aberrations; however, accuracy is not enough to provide high-quality phase maps. On the other hand, point diffraction interferometry provides a continuous map of the optical path difference introduced by the lens with a retrieval accuracy characterized by a RMS error value of approximately .10 Moreover, direct visualization of the iso-phase fringes also provides direct information on the optical behavior of the lens as well as small phase fluctuations that cannot be observed with traditional laser scanning techniques. In this paper, we will analyze the Zernike aberrations of the lens using a point diffraction interferometer for several species with Y-suture branches (pigs, sheep, and cows) and their relationship to the position of the sutures. 2.MethodologyThe study was performed on 30 crystalline lenses, 10 of each species (pigs, sheep, and cows) including both right and left eyes. Eye globes were supplied by the local slaughterhouse. Lenses were analyzed within 6 h postmortem and kept inside the globe at room temperature until measurement. During the excision process, a small portion of the cilliary body was left at the top of the lens as a reference in order to control the lens position throughout the measuring process. 2.1.Point Diffraction InterferometerWe used a modified point-diffraction interferometer (PDI) to measure lens wavefront aberration.3,8,11 The PDI is a common-path interferometer that provides isophase fringes resulting from variations in the phase difference between the wave under examination and a spherical reference wave. This reference wave is generated by diffraction at a clear pinhole located in a semitransparent plate placed in the path of the wave being tested. The modified PDI uses much larger pinhole diameters than those used for the PDI, which implies a higher dynamic range and therefore a higher amount of aberration (up to 20 to 30 waves peak to valley) can be measured without losing fringe visibility, at expenses of losing accuracy (from in some applications12 to in the modified version) as well as some contrast at the peripheral fringes.11 Moreover, the larger pinholes facilitate alignment and contribute to a more robust setup. These features, plus sensitivity, stability, and robustness, make the modified PDI an ideal tool for the study of highly aberrated optical elements such as crystalline lenses. The experimental setup shown in Fig. 1 (mounted vertically) was used to study the optical characteristics of lenses. As schematically shown in Fig. 1, a laser beam () is focused with a microscope objective, and the emerging light is collimated with a standard doublet lens. Lenses were placed in a ring inside a glass cell with plane-parallel faces filled with supplemented Medium 199 plus solution to keep the central part of the lens from touching the bottom of the cell, which would cause some deformation of the lens shape as shown in reference.9 The anterior face of the eye lens is illuminated with the plane wave. Silica substrates coated with chromium oxide with an optical density of about 2.3 and pinhole diameter of 7 μm were used for the PDI plates and were placed in the vicinities of the focal region of the eye lens. An image-acquisition system was used to capture the resulting interferograms at the observation plane. The pupil size used for the measurements was about 95% of the full diameter of the lenses, which was 6.5 mm for pig lenses, 9.0 mm for sheep, and 11.0 mm for cows. All lenses were measured under the same alignment conditions with respect to the axis of the interferometer by checking the alignment of the eye lens sutures achieved by tilting the lens until the six suture planes (visualized as six lines) converge at one point as shown in Fig. 2. 2.2.Data AnalysisAs explained above, the resulting interference pattern is equivalent to the interference between the converging wave exiting the eye lens and a spherical reference wave generated by the pinhole that is placed in the vicinity of the focus of the eye lens. Therefore the interference pattern can easily be interpreted as the lens aberration plus some small amount of defocus and tilt when the pinhole is not placed precisely at the lens paraxial focus. Interferograms were processed with the commercial software Atmosfringe 3.3.13 This software allows the semi-automatic tracking of dark fringes. The curves obtained for each fringe represent an isophase region at the observing planes. Two neighboring fringes were separated by one wavelength. This software uses Wyant’s Zernike basis notation14 where Zernike polynomials are normalized in such a way that fit coefficients equal twice the peak-to-valley value of the corresponding aberration making this much more intuitive than other notations. Moreover, polynomials are placed in ascending order by the sum of their radial and azimuthal frequencies (see Table 1 for the first 37 polynomials), which we found provided much more accurate results with a smaller number of terms compared with the classic order based on radial frequency as it can be seen detailed explained in Refs. 3 and 8. Also, the RMS error value of the fit together with a simple visual comparison between the recorded interferogram and the simulated one with the retrieved coefficients (also called chi-by-eye test15) allows us to check whether all the fringes of the interferogram are suitably arranged for an acceptable rms error value. In this way we can choose the minimum number of Zernike polynomials needed to characterize the lens aberrations, thus leading to a more significant value for Zernike coefficients. Another advantage of this visual comparison of the recorded phase maps with the ones obtained from the fit is that it allows for rearrangement of the experimental data to achieve a better fit. For instance, sometimes some features in a small region of the interferogram are not reproduced very well, especially when fringes are short. In this case, more experimental data near these fringes can be added manually until a good replica of the interferograms is achieved. This is done at the expense of some accuracy in terms of RMS error value, but some phase details can be reproduced, which ensures a better extrapolation of the phase value to any point of the pupil. A check can then be made to see whether the fit function can reasonably extrapolate values to regions where data could not be taken (due to lack of visibility of fringes for instance). Biological noise level can also be established using this method by analyzing the RMS error of the fit as well as individual differences at each data point.8 Table 1The first 37 Zernike polynomials used for wavefront analysis.
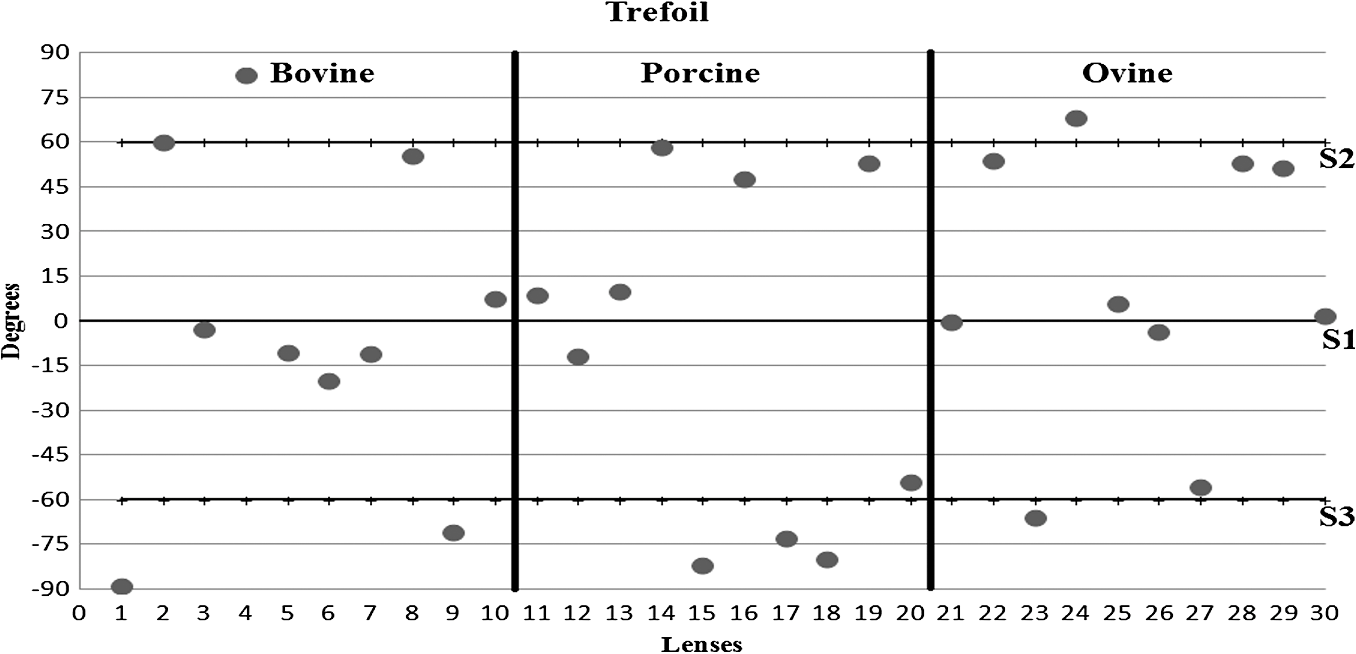
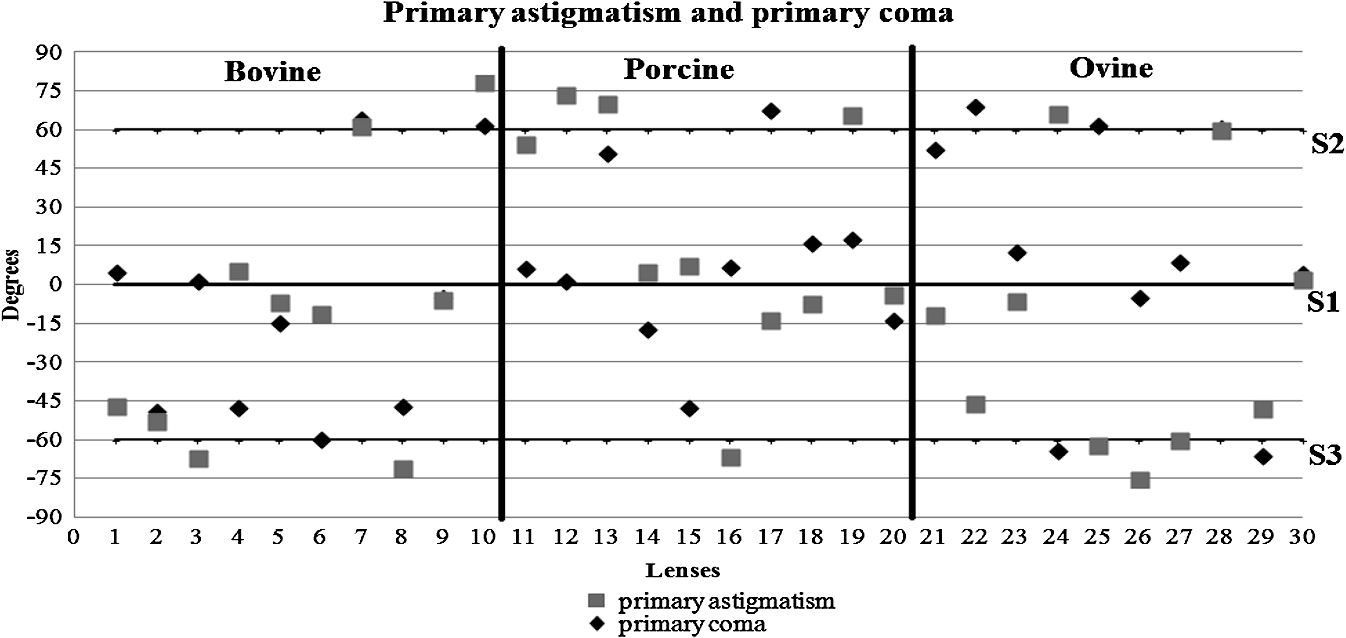
3.ResultsWe first established the reference system for each individual eye by fitting to straight lines 50 points taken over suture planes visualized as lines in the images as shown in Fig. 3. In this way, the fit represents the average orientation of the suture. The vertical suture planes are chosen as 0 deg axis. Figure 4 shows the position of the suture planes with respect to the vertical one, and we can observe that, as expected, they are placed at on average (within a standard deviation of 6 deg) from the vertical suture. Fig. 4Graphic representation of sutures orientation (S2 and S3) with respect to the vertical suture, S1 (0 deg). 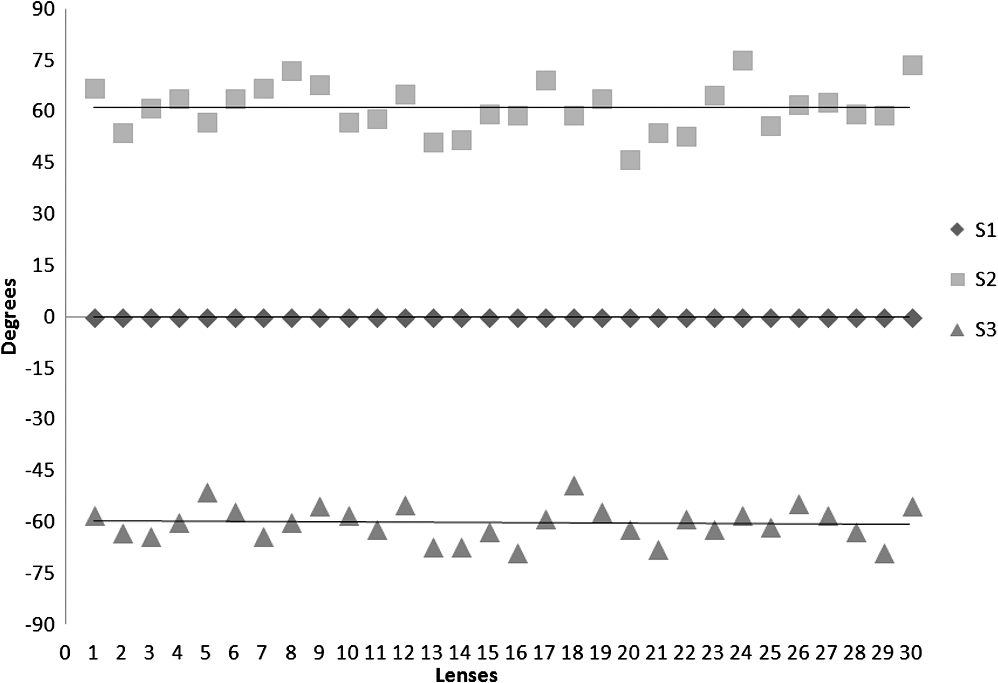 Then, by fitting tracked interference fringes to a sum of Zernike polynomials as explained in the previous section, we first analyzed the number of Zernike terms needed for each species. Figure 5(a) shows the results of the values of the RMS errors of the phase. These results, together with the above mentioned chi-by-eye criterion, led us to consider that 16 Zernike terms for pig eyes, 25 for sheep, and 37 for cows are enough to provide a good fit, insofar as they represent the minimum number of terms leading to none dramatic decrease (greater than 0.1 waves) of the RMS error value when the number of terms is increased. An interferogram and the retrieved synthetic interferograms with the minimum number of polynomials for each species are shown in Fig. 5(b). Fig. 5(a) RMS error of the fitting (in waves) in function of the number of Zernike terms considered for wavefront estimation; (b) interference pattern and synthetic one obtained with the minimum number of polynomials.  Figure 6 shows the mean value of the magnitude of the most significant aberrations obtained for the three species within 95% of the pupil. It can be seen that in all three species, the most significant nonsymmetric aberrations are primary and secondary astigmatism, coma, and trefoil. For pig and cow lenses, the ruling order of the most significant aberrations is practically the same: primary astigmatism, primary coma, trefoil, secondary astigmatism, and secondary coma; for sheep lenses, primary coma and trefoil are inverted. Since the main aim of this work is to establish a relationship between the suture planes and the different aberration axes, we then evaluate the angle of each nonsymmetric aberration axis as where the axis of the aberration, , is measured with respect to the established coordinate system.Figures 7Fig. 8–9 show the results for primary astigmatism, coma, and trefoil, respectively, and Figs. 10 and 11 for secondary astigmatism and coma. In all cases it can be observed that the aberration axis is always close to one of the three sutures but shifts randomly from one suture to another depending on the eye. Different aberrations were plotted in different figures to facilitate interpretation of the results. In order to determine whether a given suture could be responsible for the positioning of all aberrations, we plotted a composition of figures for primary astigmatism and coma in Fig. 12 showing there is not a common axis for all the aberration of a given lens. We checked that this result holds true for all the other aberrations. For trefoil, the formula given in Eq. (1) also shows that the axis shifts from one suture to another. However, due to the azimuthal periodicity of this aberration, it is clear that each lobe of trefoil falls on each suture plane. The shift only indicates whether the peak or the valley of the aberration lies at the edge of the suture plane. In Fig. 13 we show the overlapping of the image of the lens sutures with the synthetic interferogram of a given individual aberration provided by the fit in order to illustrate the high correlation between the axis of the aberrations and one of the sutures. The retrieved axis of the aberration for coma and astigmatism is marked with two lines. 4.DiscussionWe used a point diffraction interferometer to analyze aberrations of 30 eye lenses for three different species (pigs, sheep, and cows) sharing a common histological structure of Y-suture planes. Lenses were marked so as to be able to apply results of all lenses to the same reference system, in our case the vertical suture. We observed significant amounts of primary astigmatism, spherical aberration, coma, trefoil, and secondary astigmatism and coma. For sheep and cow lenses, the main aberrations are astigmatism and trefoil, but for pig lenses, there is a higher incidence of spherical aberration than trefoil. We believe that the correspondence between the positioning of the suture planes and the axis of nonsymmetric aberrations is a direct consequence of the lens fiber arrangement. The fact that there is a clear correlation between a given suture plane and a given aberration lead us to believe that the way the fibers meet at the suture planes accounts for the position of the aberration. We believe that the correspondence between the lens suture and the axis of the aberrations is a consequence of the lens fiber arrangement. The work of Sivak et al.4 contains a figure (Fig. 9) with a scanning electron microscope photographic montage of the anterior concave-convex disk of a young cow lens. The photograph shows the arrangement of the lens fibers and how they converge to form the sutures. That arrangement resembles the appearance of the isophase fringes of the trefoil interferogram, which could explain why the sutures are placed near the centre of the trefoil lobes. On the other hand, given the biological nature of the lens, the suture planes neither are not exactly at 60 deg angles to one another nor the way of joining fibers are necessarily equal in all of them, which may be responsible for those nonsymmetric aberrations with azimuthal order other than 3. The other aberrations appear as a result of the slight lack of symmetry at the suture planes. This leads us to the conclusion that a single suture plane is not responsible for all aberrations. This result clarifies the doubts manifested by Acosta et al.3 regarding the existence of a major suture plane (for astigmatism). 5.ConclusionsWe observed that the complexity of the lens aberration and therefore the number of Zernike terms varies with the size of the lens. All the lenses analyzed presented significant amounts of astigmatism and coma of first and second order, spherical aberration, and trefoil. For sheep and cow lenses, the incidence of trefoil is higher than spherical aberration. Moreover, there is a striking correspondence between the axis of the main nonsymmetric aberrations of the lenses and the position of one of the sutures. This occurs for all the aberrations without any preference for a specific suture meaning that no suture was identified in terms of aberrations. All our findings point to lens sutures as the histological origin of nonsymmetric lens aberrations. AcknowledgmentsThis work was supported by the Spanish Ministerio de Educacion y Ciencia grant FIS2012-38244-C02-01. Dr. J. Arines acknowledges financial support from the Isidro Parga Pondal Programme 2009 (Xunta de Galicia, Spain). A. Gargallo acknowledges financial support from I2C Plan 2011 (Xunta de Galicia, Spain) ReferencesA. GuiraoP. Artal,
“Contributions of the cornea and the lens to the aberrations of the human eye,”
Opt. Lett., 23
(21), 1713
–1715
(1998). http://dx.doi.org/10.1364/OL.23.001713 OPLEDP 0146-9592 Google Scholar
A. RoordaA. Glasser,
“Wave aberrations of the isolated crystalline lens,”
J. Vis., 4
(4), 250
–261
(2004). http://dx.doi.org/10.1167/4.4.1 1534-7362 Google Scholar
E. Acostaet al.,
“Relationship between wave aberrations and histological features in ex vivo porcine crystalline lenses,”
J. Biomed. Opt., 15
(5), 055001
(2010). http://dx.doi.org/10.1117/1.3484259 JBOPFO 1083-3668 Google Scholar
J. G. Sivaket al.,
“The interrelationship of lens anatomy and optical quality I. Non-primate lenses,”
Exp. Eye Res., 59
(5), 505
–520
(1994). http://dx.doi.org/10.1006/exer.1994.1137 EXERA6 0014-4835 Google Scholar
J. R. Kuszaket al.,
“The interrelationship of the lens anatomy and optiacl quality II. Primate lenses,”
Exp. Eye Res., 59
(5), 521
–535
(1994). http://dx.doi.org/10.1006/exer.1994.1138 EXERA6 0014-4835 Google Scholar
J. R. KuszakR. K. ZoltoskiC. T. Tiedemann,
“Development of lens sutures,”
Int. J. Dev. Biol., 48
(8–9), 889
–902
(2004). http://dx.doi.org/10.1387/ijdb.041880jk IJDBE5 0214-6282 Google Scholar
J. R. KuszakJ. G. SivakJ. A. Weerheim,
“Lens optical quality is a direct function of lens sutural architecture,”
Invest. Ophthalmol. Vis. Sci., 32
(7), 2119
–2129
(1991). IOVSDA 0146-0404 Google Scholar
E. AcostaD. VazquezL. Rodriguez Castillo,
“Analysis of the optical properties of crystalline lenses by point-diffraction interferometry,”
Ophtal. Physiol. Opt., 29
(3), 235
–246
(2009). http://dx.doi.org/10.1111/opo.2009.29.issue-3 OPOPD5 0275-5408 Google Scholar
A. GargalloJ. ArinesE. Acosta,
“Effect of the holding setup on the measurement of the crystalline lens aberrations,”
Proc. SPIE, 8001 800138
(2011). http://dx.doi.org/10.1117/12.892159 PSISDG 0277-786X Google Scholar
V. Linikk,
“Simple interferometer for the investigation of optical systems,”
C.R. Acad. Sci. USSR, 1 208
–210
(1933). Google Scholar
E. AcostaS. ChamadoiraR. Blendowske,
“Modified point diffraction interferometer for inspection and evaluation of ophthalmic components,”
J. Opt. Soc. Am. A., 23
(3), 632
–637
(2006). http://dx.doi.org/10.1364/JOSAA.23.000632 JOAOD6 1084-7529 Google Scholar
P. Naulleauet al.,
“At-wavelength, system-level flare characterization of extreme ultraviolet optical systems,”
Appl. Opt., 39
(17), 2941
–2947
(2000). http://dx.doi.org/10.1364/AO.39.002941 APOPAI 0003-6935 Google Scholar
J. C. WyantK. Creath,
“Basic Wavefront Aberration Theory for Optical Metrology,”
Applied Optics and Optical Engineering, 2
–53 Academic, New York
(1992). Google Scholar
W. H. Presset al.,
“Modeling of Data,”
Numerical Recipes in C: The Art of Scientific Computing, 656
–706 2nd ed.Cambridge University Press, Cambridge
(1992). Google Scholar
|