
|
|
1.IntroductionPhotoacoustic (PA) imaging, a high-resolution noninvasive imaging technique, was recently proposed for biomedical applications. PA imaging uses a short, focused laser power pulses to image tissues. Tissue components or agents that absorb the laser energy undergo rapid microheating and generate ultrasonic waves due to transient thermoelastic expansion. These ultrasonic emissions are detected by a transducer and used to reconstruct a three-dimensional (3-D) image of the tissue structure based on optical absorption.1 PA imaging provides better spatial resolution even in deep regions of biological tissues than pure optical imaging, such as optical coherence tomography and diffuse optical tomography, because scattering of ultrasonic energy is lower than optical energy in biological tissue. Signal-to-noise ratios of 26 dB can be achieved as deeply as 40 mm.2,3 Since PA imaging is an optical absorption-based technique, and also near-infrared (NIR) laser can be tuned to the optical absorption characteristics of the structures of interest, PA imaging has superior contrast and specificity compared to ultrasonic imaging. PA imaging is especially well-suited to image and characterize tumor vasculature, invasion, and angiogenesis in vivo,4–6 and PA imaging can measure cytotoxin-induced apoptosis in tumors in vivo.7 In clinical trials, PA has provided excellent contrast and differentiation of breast malignancies compared to x-ray at depths of nearly 5 cm.8 PA imaging contrast in tissues and vasculature can be greatly enhanced with exogenous optical contrast agents, such as NIR dyes, gold nanoparticles and carbon nanoparticles.9–11 Compared to NIR dyes, due to the well-established surface modification with biologically relevant entities for the tumor-targeting studies and the enhanced permeability and retention (EPR) effect that was used to image subcutaneous tumors, nanomaterials stand out as the most significant class of materials being explored for PA imaging applications.6,12 Gold-based nanomaterials, in particular gold nanoshells, nanorods and nanocages, are among the most useful optical contrast agents in PA imaging due to their size- and shape-dependent plasmonic properties.13 The tunability of their peak absorption in the NIR range renders them suitable for image-guided therapy and photothermal ablation of tumors.14–16 Gold is considered relatively inert and generally nontoxic; however, gold nanoparticles ranging from 8 to 37 nm have induced severe sickness and mortality in mice.17 In previous studies, it has been demonstrated that nanodiamonds (NDs) are nontoxic in numerous in vitro and in vivo animal studies and in a variety of different cell types.18,19 In this study, we have developed new radiation-damaged nanodiamonds (DNDs) with high optical absorbance in the NIR as a new contrast agent for PA imaging, and we compared optical absorption and imaging contrast capabilities of DNDs with those of AuNRs and SWNTs. Natural and man-made nanodiamonds are neither fluorescent nor optically absorptive in the NIR, limiting their use for biomedical imaging. Fluorescent nanodiamonds (FNDs) were developed by introducing nitrogen-vacancy (N-V), Si-vacancy (Si-V) and Ni-N complex centers by ion impaction. The vacancy band gap can be tailored to impact high optical absorption capacity, strong fluorescent quantum yields and resistance to photobleaching.20 Due to their biocompatibility and high specific surface area, folate- and transferrin-coupled FNDs have been utilized as receptor-mediated targeting of cancer cells to investigate the uptake mechanism.21,22 Although FNDs show exceptional photostability under high power laser excitation and consistent fluorescence intensity after surface functionalization,23 reductions in size affect the relative stability of the H3 and N-V centers in type IA diamond. For example, the fluorescence intensity was decreased 81% when the particle size of FNDs was decreased from 350 to 50 nm.24 Preferably, nanoparticles intended for long circulation and accumulation in leaky tumors should be less than 200 nm, and particles intended for lymphatic uptake and imaging generally should be between 10 and 80 nm.25 In addition, fluorescence imaging has poor spatial resolution at depths beyond one transport mean free path (), which severely limits fluorescence imaging’s clinical potential. In this study, we report the optical properties of DNDs with high NIR absorption and a diameter of 70 nm for use with PA imaging. Moreover, we show the feasibility of DNDs as contrast agents for PA imaging and capability of deep imaging both ex vivo and in vivo. In addition, we demonstrate that DNDs can serve as an excellent contrast agent in the PA imaging modality based on excellent biological compatibility and higher optical absorption capacity compared with AuNRs and single-wall carbon nanotubes (SWNT). 2.Materials and MethodsAll of the chemicals were purchased from Sigma-Aldrich and used without further purification. AuNRs were freshly prepared by the seed-mediated growth method.26 Atomic Absorption Spectroscopy was performed on a VarianSpectrAA GTA-110 with a graphite furnace to determine the concentration of Au. Transmission Electron Microscopy (FEI Tecnai F20 XT Field Emission TEM) was used to determine mean dimensions of and for 760 and 840 nm AuNRs, respectively. SWNT were purchased from Unidym (Sunnyvale, California) with dimensions of and a molecular weight of ca. . 2.1.DND SynthesisNatural diamond powders (Microdiamant, Lengwil, Switzerland) were radiation-damaged with 40-keV ions generated from a home-built ion beam apparatus as previously described.27 To perform the ion irradiation, diamond powders were first deposited on a long copper tape as a thin film and then exposed to ion bombardment (). After being cleaned in concentrated (, ) at 100°C in a microwave reactor for 3 h, the freshly prepared DNDs were extensively rinsed in deionized (DI) water and stored at room temperature before use. ZetaPALS (Brookhaven Instrument Corporation, Holtsville, New York) was used to determine mean dimensions of the DNDs as 68.7 nm (variance of 0.057) (Fig. 1). TEM image analysis with ImageJ measured an average DND diameter of 58.3 nm (standard deviation of 6.5 nm) (data not shown). X-ray diffraction patterns of DNDs were collected using monochromated CuKα radiation (, 45 kV) on a Bruker Proteum Diffraction System. 2.2.Peak Wavelength and In Vitro SensitivityThe peak optical characteristics of the DNDs were measured using the 10-MHz transducer (37.5-mm focal length; 65.81% fractional bandwidth, V315, Olympus NDT, Waltham, Massachusetts). DNDs suspended in DI water were injected into clear Tygon tubing (1 mm ID, 1.78 mm OD) and imaged by PA imaging at different laser wavelengths. Both the transducer and the tubing containing the DNDs suspension were immersed in the water. Measurements were repeated five times and were referenced to DI water. The laser fluences used in peak wavelength and sensitivity experiments were 18 and , respectively. For peak wavelength determinations, signal intensities from DND suspensions were acquired at each wavelength using the same tubing. For the in vitro sensitivity experiment, DND suspensions at different concentrations were injected into tubing for signal detection. The peak absorption wavelength (820 nm) was used to determine the sensitivity of detection. The optical absorbance of DNDs was measured in a Molecular Devices SpectraMax (Sunnyvale, California). Integrating sphere measurements were taken with a Hitachi U-3900 spectrometer with a ϕ60 integrating sphere. 2.3.Ex Vivo Imaging in Raw Chicken BreastThe DNDs were suspended in water (, 20 μL) and injected into a raw chicken breast at differing depths. The 25-MHz transducer (15-mm focal length; 61% fractional bandwidth, I3-2506-R, Olympus NDT, Waltham, Massachusetts) was used to image the breast immediately after injection. Following imaging, the breast was cut open and the DNDs were photographed. 2.4.In Vivo Imaging in MiceBalb/c mice were anesthetized using isoflurane and placed on a thermostatic pad for PA imaging, in accordance with protocols approved by the University of Kansas IACUC. A 30-μL suspension of DNDs (, 0.238 nM) in 10% phosphate buffered saline (PBS) was injected subcutaneously into the lower back of a mouse. The 5-MHz transducer (35-mm focal length; 70% fractional bandwidth, SU-108-013, Sonic Concepts) was used to image the injection area. Afterwards, the imaging depth was measured by injecting DNDs into the ventral side of the thigh of the mouse, and PA images were taken from the dorsal side. The laser fluence used in both ex vivo and in vivo experiments was . 3.Results and DiscussionDNDs were prepared by ion irradiation of natural (type IA) diamond powders at a high dosage (). This high-dose irradiation created a high concentration (up to 3000 ppm) of vacancies in the diamond crystal lattice. These vacancies, predominantly present in neutral form, are termed as GR1 defect centers. After irradiation to create the vacancies and subsequent strong acid treatments, characteristic diffraction patterns of diamond (111), (220), and (311) peaks were clearly observed in DNDs (data not shown), which indicated that there was no significant damage to the crystal lattice of natural diamond. Previously, we reported the PA imaging of type Ib diamond nanocrystals conjugated with gold nanoparticles.28 FNDs have negatively charged centers, giving a red fluorescence emission at 600 to 800 nm. However, these FNDs do not provide high PA signal intensity in the absence of the gold conjugate. DNDs have GR1 neutral centers, which have a fluorescence life time () of 1 ns at room temperature, whereas the intrinsic lifetime () is on the order of 100 nm.29,30 Thus, the fluorescence quantum yield of DNDs should be ca. at room temperature, according to the equation of . However, the GR1 defects have a zero-phonon line at 741 nm with an absorption tail extending to .31 Thus, 99% of the energy absorbed by the DND is released by nonradiative processes, e.g., vibration heating, which may contribute to the PA signal intensity. With the feasibility of producing a high concentration of GR1 centers in the particles, DNDs are well suited for PA imaging applications without the addition of optically active gold conjugates. The experimental setup for PA imaging of DNDs is shown in Fig. 2. The deep reflection-mode PA imaging system is capable of sub 0.2-mm resolution at depths of 19 mm and a penetration depth of up to 38 mm.32 For this study, we used our previously described PA apparatus,3 including a 532-nm Q-switched Nd:YAG laser (Surelite III, Continuum, Santa Clara, California) that pumps an optical parametric oscillator laser (Surelite OPO PLUS, Continuum, Santa Clara, California) with 6-ns pulses at 10 Hz. The output is conveyed through an optical condenser to generate a ring-shaped illumination, which is depth focused in tissues using a condenser lenses and a focused transducer. The beam diameter was 7 mm at the tissue surface, and the laser intensity was restricted to in accordance with the laser safety limits recommended by the American National Standards Institute. The generated PA signal recorded by the transducer was amplified through a preamplifier (5072PR, Olympus-NDT, Waltham, Massachusetts) and then collected by a PC through an A/D Scope Card (CS21G8-256MS, Gage) with a 125-MHz sampling rate; these data were analyzed and used to create PA images. The optical characteristics of the DNDs were measured by PA and absorbance spectroscopy with an integrating sphere (Fig. 3). The optical absorbance did not have a clear maximum due to high optical scattering. The integrating sphere measurement indicated decreasing absorbance from 590 to 780 nm [Fig. 3(a)], similar to the PA signal trend from 700 to 780 nm [Fig. 3(b)]. The PA signal and integrating sphere absorbance were in agreement up to about 950 nm, with the exception of the PA maximum at 820 nm. The integrating sphere absorbance increased beyond 950 nm whereas PA signal intensity decreased. This may be due in part to our laser system’s reduced intensity at wavelengths above 900 nm and the resulting reduced signal-to-noise ratio. Fig. 3Optical characteristics of DNDs suspended in DI water as a function of wavelength. (a) Absorption spectrum measured with an integrating sphere, and (b) photoacoustic (PA) spectrum.  The PA signal amplitude peaked at 700 nm with a second peak at 820 nm. Wavelengths between 700 and 900 nm are ideal for NIR imaging of biological tissues, since the absorption contributions of hemoglobin, water, and Mie scattering are weak compared to wavelengths below 700 nm. We used 820 nm for subsequent PA imaging of the DNDs. Figure 4 indicates a nonlinear increase in peak-to-peak PA signal amplitude with increasing DNDs concentration. Moreover, there was a significant difference in the PA signal intensity of DI water () and DND suspensions above the concentration of (). At higher DND concentrations, the penetration depth of light into the highly scattering medium decreases, and thus the laser intensity at the focus area decreases. Therefore, the PA signal amplitude gradually levels off at higher concentrations of DNDs. The DNDs were then imaged in raw chicken breast as an ex vivo model. The maximum-amplitude-projected (MAP) image of the chicken breast tissue after the injection of DNDs at a depth of 3 mm [Fig. 5(a)] distinctly shows the regions with and without DNDs presented obviously. The DND injected area increased contrast by 446% compared to the background chicken breast tissue, with a relative standard deviation (RSD) of 33%. A B-scan showed that DNDs can be imaged at a depth of with 79% signal enhancement and 47% RSD [Fig. 5(c)]. Fig. 5Photoacoustic images taken after injecting DNDs into chicken breast tissue. (a) MAP image; (b) corresponding photograph of DNDs in chicken breast tissue (dashed circle); (c) B-scan image.  The DNDs were next imaged after subcutaneous injection into the lower back of a mouse. The injection site and the path along which the needle was withdrawn are clearly visible against the tissue background [Fig. 6(a)]. The DNDs enhanced the PA signal contrast 919% with a 34% RSD. In a second injection at ca. 3 mm into the hip of the mouse [Fig. 6(b)], the DNDs enhanced the contrast 567% compared to surrounding tissues with a 19% RSD. Fig. 6Photoacoustic images taken after injecting DNDs subcutaneously at (a) the back (MAP image) and (b) the ventral side of the thigh of mouse (B-scan image). 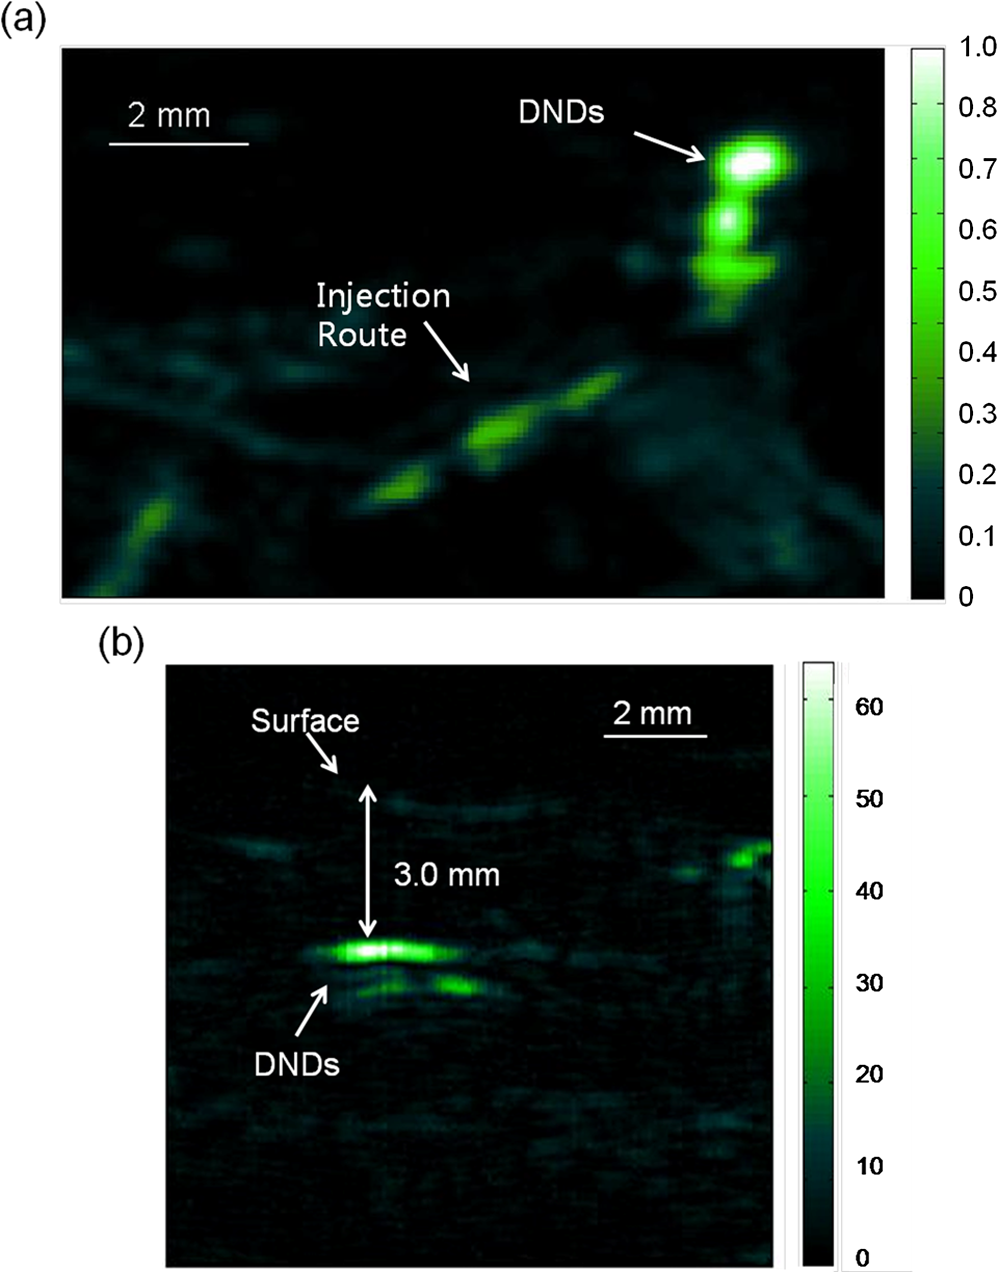 To further understand the signal enhancement of DNDs, we collected and compared the PA signals of DNDs imaged at 820 nm wavelength to AuNRs having longitudinal absorption wavelengths of 760 nm and 840 nm, and to SWNTs having a maximum absorption wavelength of 970 nm. The concentrations of different nanoparticles were adjusted to achieve similar PA intensities in order to limit nonlinearity effects in the comparison. The PA amplitudes of DNDs, AuNRs and SWNTs were calculated on an atom and particle basis using the following equation: where is PA amplitude in volt per number concentration, Amp is PA amplitude, is the number concentration of gold or carbon atoms, and is the number concentration of DNDs, AuNRs or SWNTs.The PA amplitude of DNDs was 1.76 and 1.58 times stronger than AuNRs of 760 and 840 nm, respectively, on an atom basis. On a weight basis, the DNDs produced a signal and 29- and 26-fold greater than AuNRs. On a nanoparticle molar basis, the DNDs produced a signal 71 and 64 times greater than the two AuNRs samples, despite similar longitudinal dimensions. When compared with SWNTs, DNDs exhibited 1.67 and 621-fold greater PA amplitude based on atom and particle molar concentrations, respectively, as shown in Table 1. Table 1Comparison of PA signals between DNDs, AuNRs and SWNT.
The improved PA contrast with DNDs compared to AuNRs may be due in part to both the optical absorbance and the high thermal conductivity of DNDs. Diamond has the highest thermal conductivity of all known natural materials. For example, the thermal conductivity for single crystal diamond is , which is over three times greater than that of copper at 20°C.33 The interfacial thermal conductance is the inverse of the interfacial thermal resistance, which is a measure of an interface’s resistance to thermal flow. Therefore, lower interfacial thermal resistance or higher interfacial conductance of nanoparticles leads to faster heat transfer from the particles to the ambient medium, which is DI water or biological fluids in this study, and this may result in stronger PA signals. However, this explanation does not fully explain the improved signal compared to SWNTs, which have larger on-axis thermal conductivities, in excess of , despite a low off-axis conductivity of ca. .34 Also, the effects of thermal diffusion are generally thought to be negligible over the short excitement pulse length used for PA imaging.35 Hydrogen bonding also could play a role in the improved PA amplitude of DNDs. Chen et al. found that silica-coated AuNRs produced three-fold higher PA signals than uncoated AuNRs, because the hydroxyl groups of the silica surface were able to form hydrogen bonds with water and lowered the interfacial thermal resistance.36 The surfaces of SWNTs and unmodified nanodiamonds are very hydrophobic, and the hydrogen bonding interactions between the carbon atoms and the water are very weak.37 However, the surface of our DNDs was prepared to have carboxyl groups by strong oxidative acid treatment;38 carboxylic acids are strong hydrogen bond acceptors in water. As a result, the interfacial thermal conductance of DNDs may be higher due to the very hydrophilic surface exposed to the aqueous milieu. 4.ConclusionIn summary, DNDs can be synthesized with sub-100 nm nanoscopic dimensions and with high optical absorption in the NIR wavelengths ideal for optical contrast imaging. Our ex vivo and in vivo results indicate that DNDs are superior to AuNRs and SWNTs for PA imaging based on improved optical absorption and known low toxicity.39 Compared with AuNRs and SWNTs, DNDs have better PA amplitude on a mole and weight basis. We envision that PA imaging with surface functionalized DNDs could provide a powerful guidance tool for drug delivery and imaging in deep tissues. AcknowledgmentsThis work was funded in part by the National Institutes of Health (1R21EB01018) and American Cancer Society (RSG-0813301CDD). We thank Prof. C. Chang and Che-Yu Li for technical assistance, and Profs. R. Middaugh and D. Volkin for their assistance in NanoSight measurements. The authors have no conflicts of interest to report. ReferencesM. H. XuL. H. V. Wang,
“Photoacoustic imaging in biomedicine,”
Rev. Sci. Instrum., 77
(4), 041101
(2006). http://dx.doi.org/10.1063/1.2195024 RSINAK 0034-6748 Google Scholar
H. F. Zhanget al.,
“Functional photoacoustic microscopy for high-resolution and noninvasive in vivo imaging,”
Nat. Biotechnol., 24
(7), 848
–851
(2006). http://dx.doi.org/10.1038/nbt1220 NABIF9 1087-0156 Google Scholar
H. Z. CuiX. M. Yang,
“In vivo imaging and treatment of solid tumor using integrated photoacoustic imaging and high intensity focused ultrasound system,”
Med. Phys., 37
(9), 4777
–4781
(2010). http://dx.doi.org/10.1118/1.3480963 MPHYA6 0094-2405 Google Scholar
G. F. Lunguet al.,
“In vivo imaging and characterization of hypoxia-induced neovascularization and tumor invasion,”
Int. J. Oncol., 30
(1), 45
–54
(2007). IJONES 1019-6439 Google Scholar
G. Kuet al.,
“Imaging of tumor angiogenesis in rat brains in vivo by photoacoustic tomography,”
Appl. Opt., 44
(5), 770
–775
(2005). http://dx.doi.org/10.1364/AO.44.000770 APOPAI 0003-6935 Google Scholar
M. L. Liet al.,
“In-vivo photoacoustic microscopy of nanoshell extravasation from solid tumor vasculature,”
J. Biomed. Opt., 14
(1), 010507
(2009). http://dx.doi.org/10.1117/1.3081556 JBOPFO 1083-3668 Google Scholar
Q. H. Yanget al.,
“In vivo photoacoustic imaging of chemotherapy-induced apoptosis in squamous cell carcinoma using a near-infrared caspase-9 probe,”
J. Biomed. Opt., 16
(11), 116026
(2011). http://dx.doi.org/10.1117/1.3650240 JBOPFO 1083-3668 Google Scholar
D. Piraset al.,
“Photoacoustic Imaging of the Breast using the twente photoacoustic mammoscope: present status and future perspectives,”
IEEE J. Sel. Top. Quant. Electron., 16
(4), 730
–739
(2010). http://dx.doi.org/10.1109/JSTQE.2009.2034870 IJSQEN 1077-260X Google Scholar
D. P. J. Panet al.,
“Near infrared photoacoustic detection of sentinel lymph nodes with gold nanobeacons,”
Biomaterials, 31
(14), 4088
–4093
(2010). http://dx.doi.org/10.1016/j.biomaterials.2010.01.136 BIMADU 0142-9612 Google Scholar
W. J. Akerset al.,
“Noninvasive photoacoustic and fluorescence sentinel lymph node identification using dye-loaded perfluorocarbon nanoparticles,”
ACS Nano, 5
(1), 173
–182
(2011). http://dx.doi.org/10.1021/nn102274q 1936-0851 Google Scholar
C. Kimet al.,
“Sentinel lymph nodes and lymphatic vessels: noninvasive dual-modality in vivo mapping by using indocyanine green in rats-volumetric spectroscopic photoacoustic imaging and planar fluorescence imaging,”
Radiology, 255
(2), 442
–450
(2010). http://dx.doi.org/10.1148/radiol.10090281 RADLAX 0033-8419 Google Scholar
A. De La Zerdaet al.,
“Carbon nanotubes as photoacoustic molecular imaging agents in living mice,”
Nat. Nanotechnol., 3
(9), 557
–562
(2008). http://dx.doi.org/10.1038/nnano.2008.231 1748-3387 Google Scholar
L. R. Hirschet al.,
“Nanoshell-mediated near-infrared thermal therapy of tumors under magnetic resonance guidance,”
Proc. Natl. Acad. Sci. U. S. A., 100
(23), 13549
–13554
(2003). http://dx.doi.org/10.1073/pnas.2232479100 PNASA6 0027-8424 Google Scholar
G. von Maltzahnet al.,
“Computationally guided photothermal tumor therapy using long-circulating gold nanorod antennas,”
Cancer Res., 69
(9), 3892
–3900
(2009). http://dx.doi.org/10.1158/0008-5472.CAN-08-4242 CNREA8 0008-5472 Google Scholar
M. Eghtedariet al.,
“High sensitivity of in vivo detection of gold nanorods using a laser optoacoustic imaging system,”
Nano Lett., 7
(7), 1914
–1918
(2007). http://dx.doi.org/10.1021/nl070557d NALEFD 1530-6984 Google Scholar
K. H. Songet al.,
“Noninvasive in vivo spectroscopic nanorod-contrast photoacoustic mapping of sentinel lymph nodes,”
Eur. J. Radiol., 70
(2), 227
–231
(2009). http://dx.doi.org/10.1016/j.ejrad.2009.01.045 EJRADR 0720-048X Google Scholar
Y. S. Chenet al.,
“Assessment of the In Vivo Toxicity of Gold Nanoparticles,”
Nanoscale Res. Lett., 4
(8), 858
–864
(2009). http://dx.doi.org/10.1007/s11671-009-9334-6 1556-276X Google Scholar
A. M. Schrandet al.,
“Are diamond nanoparticles cytotoxic?,”
J. Phys. Chem. B, 111
(1), 2
–7
(2007). http://dx.doi.org/10.1021/jp066387v JPCBFK 1520-6106 Google Scholar
A. S. Barnard,
“Diamond standard in diagnostics: nanodiamond biolabels make their mark,”
Analyst, 134
(9), 1751
–1764
(2009). http://dx.doi.org/10.1039/b908532g ANLYAG 0365-4885 Google Scholar
N. Mohanet al.,
“In vivo imaging and toxicity assessments of fluorescent nanodiamonds in Caenorhabditis elegans,”
Nano Lett., 10
(9), 3692
–3699
(2010). http://dx.doi.org/10.1021/nl1021909 NALEFD 1530-6984 Google Scholar
Y. Q. LiX. P. Zhou,
“Transferrin-coupled fluorescence nanodiamonds as targeting intracellular transporters: an investigation of the uptake mechanism,”
Diam. Relat. Mater., 19
(10), 1163
–1167
(2010). http://dx.doi.org/10.1016/j.diamond.2010.05.003 DRMTE3 0925-9635 Google Scholar
B. Zhanget al.,
“Receptor-mediated cellular uptake of folate-conjugated fluorescent nanodiamonds: a combined ensemble and single-particle study,”
Small, 5
(23), 2716
–2721
(2009). http://dx.doi.org/10.1002/smll.v5:23 1613-6829 Google Scholar
C.-C. Fuet al.,
“Characterization and application of single fluorescent nanodiamonds as cellular biomarkers,”
Proc. Natl. Acad. Sci. U. S. A., 104
(3), 727
–732
(2007). http://dx.doi.org/10.1073/pnas.0605409104 PNASA6 0027-8424 Google Scholar
T.-L. Weeet al.,
“Preparation and characterization of green fluorescent nanodiamonds for biological applications,”
Diam. Relat. Mater., 18
(2–3), 567
–573
(2009). http://dx.doi.org/10.1016/j.diamond.2008.08.012 DRMTE3 0925-9635 Google Scholar
S. K. Nuneet al.,
“Advances in lymphatic imaging and drug delivery,”
Adv. Drug Deliv. Rev., 63
(10–11), 876
–885
(2011). http://dx.doi.org/10.1016/j.addr.2011.05.020 ADDREP 0169-409X Google Scholar
N. R. Jana,
“Gram-scale synthesis of soluble, near-monodisperse gold nanorods and other anisotropic nanoparticles,”
Small, 1
(8–9), 875
–882
(2005). http://dx.doi.org/10.1002/(ISSN)1613-6829 1613-6829 Google Scholar
Y. R. Changet al.,
“Mass production and dynamic imaging of fluorescent nanodiamonds,”
Nat. Nanotechnol., 3
(5), 284
–288
(2008). http://dx.doi.org/10.1038/nnano.2008.99 1748-3387 Google Scholar
B. L. Zhanget al.,
“Photoacoustic emission from fluorescent nanodiamonds enhanced with gold nanoparticles,”
Biomed. Opt. Express, 3
(7), 1662
–1669
(2012). http://dx.doi.org/10.1364/BOE.3.001662 BOEICL 2156-7085 Google Scholar
F. JelezkoJ. Wrachtrup,
“Single defect centres in diamond: a review,”
Physica Status Solidi A Appl. Mater. Sci., 203
(13), 3207
–3225
(2006). http://dx.doi.org/10.1002/pssa.v203:13 PHSSAK 0031-8957 Google Scholar
S. Pezzagnaet al.,
“Creation and nature of optical centres in diamond for single-photon emission-overview and critical remarks,”
New J. Phys., 13 035024
(2011). http://dx.doi.org/10.1088/1367-2630/13/3/035024 NJOPFM 1367-2630 Google Scholar
G. Davieset al.,
“Vacancy-related centers in diamond,”
Phys. Rev. B, 46
(20), 13157
–13170
(1992). http://dx.doi.org/10.1103/PhysRevB.46.13157 PRBMDO 0163-1829 Google Scholar
K. H. SongL. V. Wang,
“Deep reflection-mode photoacoustic imaging of biological tissue,”
J. Biomed. Opt., 12
(6), 060503
(2007). http://dx.doi.org/10.1117/1.2818045 JBOPFO 1083-3668 Google Scholar
S. V. KidalovF. M. ShakhovA. Y. Vul,
“Thermal conductivity of nanocomposites based on diamonds and nanodiamonds,”
Diam. Relat. Mater., 16
(12), 2063
–2066
(2007). http://dx.doi.org/10.1016/j.diamond.2007.07.010 DRMTE3 0925-9635 Google Scholar
S. Sinhaet al.,
“Off-axis thermal properties of carbon nanotube films,”
J. Nanopart. Res., 7
(6), 651
–657
(2005). http://dx.doi.org/10.1007/s11051-005-8382-9 JNARFA 1388-0764 Google Scholar
A. C. Tam,
“Applications of photoacoustic sensing techniques,”
Rev. Mod. Phys., 58
(2), 381
–431
(1986). http://dx.doi.org/10.1103/RevModPhys.58.381 RMPHAT 0034-6861 Google Scholar
Y. S. Chenet al.,
“Silica-coated gold nanorods as photoacoustic signal nanoamplifiers,”
Nano Lett., 11
(2), 348
–354
(2011). http://dx.doi.org/10.1021/nl1042006 NALEFD 1530-6984 Google Scholar
M. C. BellissentFunelR. SridiDorbezL. Bosio,
“X-ray and neutron scattering studies of the structure of water at a hydrophobic surface,”
J. Chem. Phys., 104
(24), 10023
–10029
(1996). http://dx.doi.org/10.1063/1.471728 JCPSA6 0021-9606 Google Scholar
T. T. B. NgyuenH.-C. ChangV. W.-K. Wu,
“Adsorption and hydrolytic activity of lysozyme on diamond nanocrystallites,”
Diam. Relat. Mater., 16
(4–7), 872
–876
(2007). http://dx.doi.org/10.1016/j.diamond.2007.01.030 DRMTE3 0925-9635 Google Scholar
V. Vaijayanthimalaet al.,
“The biocompatibility of fluorescent nanodiamonds and their mechanism of cellular uptake,”
Nanotechnology, 20
(42), 425103
(2009). http://dx.doi.org/10.1088/0957-4484/20/42/425103 NNOTER 0957-4484 Google Scholar
|


