|
|
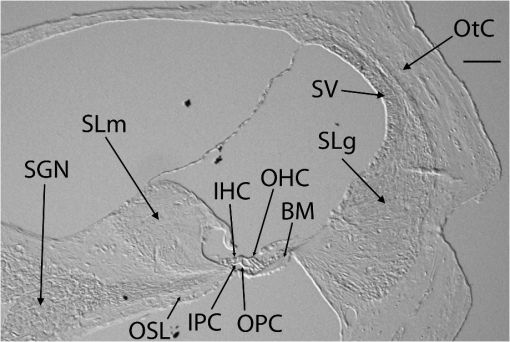
1.IntroductionHearing loss is the most common sensory deficit in the world, affecting over 36 million Americans—18% of people from 45 to 64 years of age, and of people over 75 years of age.1 Yet the cause of deafness is not known for most affected individuals because the inner ear cannot be biopsied today without damaging residual hearing. Current clinical imaging modalities, including computed tomography (CT) and magnetic resonance imaging (MRI), are not sensitive enough to reveal cochlear microanatomy. Novel imaging modalities being developed for ultimate application in humans in vivo will require a full understanding of the optical properties of various cochlear structures. A technique commonly used to investigate the optical properties of biological specimens is polarized light microscopy (PLM).2 A conventional microscope can be converted into a simple polarization-sensitive microscope by placing perpendicularly oriented polarization filters into the beam of light before and after it passes the sample.3 Without any intervening specimen, light passing the first filter is totally absorbed by the second filter. When biological samples are placed in the illumination path, certain structures change the polarization state of light that passes through them, allowing some component of that light to pass the second filter.4 In addition to sample-induced changes in polarization, some implementations of PLM are capable of detecting nonhomogeneous alterations in wave propagation velocity. This phenomenon, often called sample retardance, occurs when the refractive index of the specimen is dependent on the polarization and direction of incoming light (a property known as birefringence). Materials that exhibit birefringence are anisotropic, or ordered in a directionally dependent way. This order can either be on the level of molecular bonds, resulting in intrinsic birefringence, or on a submicroscopic level, resulting in form birefringence.2 Two materials that are abundant in the cochlea, collagen and myelin, are known to exhibit birefringence.2,4 Importantly, defects of collagen and myelin in the cochlea have been implicated in disease; mutations in and autoimmunity against type II collagen5–7 as well as demyelination of cochlear neurons8,9 all lead to hearing loss. A unique advantage of PLM is that it allows for the structural characterization of biological specimens containing birefringent materials without having to stain or label them. PLM has been used in other fields to investigate collagen networks in tissues,10 retinal nerve fiber layers,11 meiotic spindles and microtubules within cells,12,13 and structural features that correlate with the health of ova to be used for intracytoplasmic sperm injection.14 Despite its utility, PLM has rarely been applied to the cochlea. Ren et al. used PLM to examine microcirculation in the guinea pig cochlea,15 whereas Wenzel et al. used PLM to examine collagen organization and content within the basilar membrane and other cochlear structures after laser irradiation.16,17 One of the major drawbacks of standard PLM is that it is not a quantitative technique. The intensity of light observed when a birefringent material is viewed by a polarized light microscope depends on the angle of that material’s optic axis relative to the transmission axes of the polarization filters.4,18 In a biological specimen, such as a histological section, birefringent materials may be oriented at different angles throughout the sample. To address this limitation, a quantitative form of polarized light microscopy (qPLM) has been developed.19,20 In qPLM, two parameters related to the birefringent properties of the specimen are determined, independent of polarizer orientation, for each pixel in the acquired images:19,21 retardance (expressed in nanometers) and the average orientation of the polarization axis with the greater index of refraction (the slow axis). qPLM has been used to examine collagen ultra-structure in normal and damaged articular cartilage,21–23 collagen deposition in burn healing,24 structural changes in myocardial tissue after infarction and regenerative treatments,25 wall structural integrity of brain arteries,26 and the paths of white matter tracts in the brain,27,28 among other applications. To the best of our knowledge, qPLM has never been applied to examine cochlear cross-sections. In this study, we have applied qPLM to unstained murine cochlear cross-sections. We have focused on the mouse model because its cochlear anatomy and physiology is similar to that of humans, and many mouse models of human deafness are available to test the diagnostic power of this technique. To gain a basic understanding of the birefringent properties of the cochlea, we determined retardance values for various cochlear structures across two strains of mice commonly used in research. 2.Materials and Methods2.1.Experimental AnimalsSix-week-old () and () male mice (Jackson Laboratories) were used. All procedures were approved by the Massachusetts Eye & Ear Infirmary Animal Care and Use Committee. 2.2.Histological PreparationAnimals were anesthetized with ketamine and xylazine. Transcardiac perfusion was performed using 4% paraformaldehyde. The oval and round windows were opened and intralabyrinthine perfusion was performed with the same fixative. Cochleae were isolated and placed in fixative for 2 h, decalcified in EDTA for at least three days at room temperature, dehydrated, embedded in paraffin, and sectioned at a thickness of 10 μm. Section thickness was independently measured and confirmed to be 10 μm using a confocal microscope (Leica TCS SP2 Spectral Confocal Laser Scanning Microscope, Leica Microsystems, Wetzlar, Germany). The main structures identifiable on an unstained cross-section by differential interference contrast microscopy are labeled in Fig. 1. 2.3.Quantitative Polarized Light MicroscopyMid-modiolar sections were deparaffinized and coverslipped (unstained) with Permount mounting medium (Fisher Scientific). Slides were imaged using the Abrio Birefringence Imaging System (Cambridge Research & Instrumentation Inc.), which has been described in detail previously.29 Briefly, specimens are placed on the stage of an inverted microscope (Nikon Eclipse TE 2000-S). Circularly polarized monochromatic light (wavelength 546 nm) passes through the sample and then through a universal compensator made from two computer-controlled liquid crystal (LC) variable retarder plates. Images of the specimen are acquired at five different settings of the LC retarder plates by a charge-coupled device (CCD) imaging sensor, and are transferred to a computer. Polarimetric algorithms29 are used to convert the data from these images into a single full-field map of retardance values and slow axis orientations. The system can determine retardance values to a nominal resolution of 0.02 nm. Retardance measurements of cochlear structures were made by finding average pixel intensities in gray scale retardance magnitude images using ImageJ (U.S. National Institutes of Health). Results are expressed as of the mean. Retardance is generated between the orthogonally polarized components of light transmitted through a birefringent material as a result of the difference in their propagation velocities.30 The retardance () divided by the path length of the light through the material () is equal to the birefringence . The path length is difficult to determine, especially in tissue because it is highly scattering. The retardance, however, is proportional to sample birefringence if the path length is held constant. Because our section thickness was the same across measurements, we use “retardance” and “birefringence” interchangeably. The phase shift () at a particular wavelength () is defined as . Therefore, the reported retardance values can specify the expected phase shift at any given wavelength. 2.4.ImmunohistochemistryDeparaffinized sections for collagen immunolabeling were incubated in pepsin solution (Thermo Scientific, AP-9007-005) for 10 min at 37°C in a humidified chamber. All sections were washed in 0.01M PBS, pH 7.4, exposed to blocking serum [5% normal horse serum X] for 1 hour at room temperature in a humidified chamber, incubated with mouse anti-mouse collagen type 2 antibody (Thermo Scientific, Collagen II Ab-2 Clone 2B1.5, MS-235-P0) or chicken anti-mouse myelin basic protein (MBP) antibody (Novus Biologicals, NB100-1603) overnight in a humidified chamber, rinsed in PBS and covered with Alexa Fluor 568 rabbit anti-mouse antibody (Invitrogen, A10037) (collagen) or Alexa Fluor 488 goat anti-chicken antibody (Invitrogen, A11039) (MBP) in 1% NHS for 1 h at room temperature in a humidified chamber. Sections were coverslipped with Vectashield mounting medium (Vector Laboratories, H-1000) and imaged using a fluorescence microscope (Nikon Eclipse E800). 3.Results and DiscussionPseudocolor retardance magnitude and orientation images of unstained cochlear cross-sections through the lower basal turn reveal intricate networks of fibers running throughout the cochlea (Fig. 2). These networks were more elaborate than could be appreciated with differential interference contrast microscopy (Fig. 1). Fibers observed by qPLM converged on the basilar membrane from the spiral limbus and from within the osseous spiral lamina (OSL), and spread from the basilar membrane into the spiral ligament. The same pattern was observed in the lower apical turn (Fig. 3), although the retardance magnitudes appeared to be lower. Fig. 2(a) Pseudocolor retardance magnitude and (b) orientation images of a cross-section through the lower basal cochlear turn of a mouse. The colored bar in (a) indicates the scale for retardance magnitude from 0 to 2.95 nm, and the white bar represents 100 μm. The colored circle in (b) indicates the correspondence between pixel color and orientation of the slow axis. 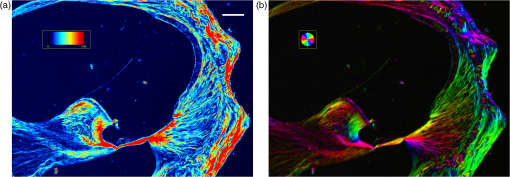 Fig. 3(a) Pseudocolor retardance magnitude and (b) orientation images of a cross-section through the lower apical cochlear turn of a mouse. The colored bar in (a) indicates the scale for retardance magnitude from 0 to 2.95 nm, and the white bar represents 100 μm. The colored circle in (b) indicates the correspondence between pixel color and orientation of the slow axis. 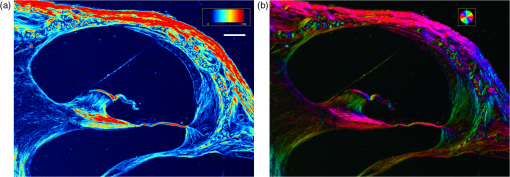 To determine the sources of the observed fiber networks, we used immunohistochemistry directed against collagen and myelin, which are known to exhibit birefringence. We focused on type II collagen [Fig. 4(a)] because it is the main fibrillar component of the mammalian cochlea,31–34 and on myelin basic protein [Fig. 4(b)] because it is a main component of peripheral myelin that ensheathes the processes of cochlear neurons within the OSL.35 Immunoreactivity for type II collagen revealed a strong signal in the spiral limbus, basilar membrane, spiral ligament, and otic capsule [Fig. 4(a)], consistent with previous reports of a radially oriented network of type II collagen fibrils, identified by immunostaining and electron microscopy, beginning in the spiral limbus, converging on the insertion of the basilar membrane, and spreading into the spiral ligament toward the stria vascularis.31,33 Immunoreactivity for myelin basic protein was localized to the myelinated nerve fibers within the OSL [Fig. 4(b)]. This pattern was complementary to the strong collagen II immunoreactivity of the OSL [Fig. 4(a)]. Neither type II collagen nor myelin basic protein were observed within the stria vascularis, which exhibited a weak retardance signal. Fig. 4Cross-sections through the (a) lower basal and (b) upper basal cochlear turns of a mouse with immunofluorescence labeling for (a) type II collagen and (b) myelin basic protein imaged with a fluorescence microscope. The white bars in (a) and (b) represent 100 μm.  Collagen is known to exhibit both intrinsic and form birefringence. The intensity of birefringence of a collagen network thus depends both on the collagen density and on the extent of collagen organization at the fibrillar level.2 The optic axis of a collagen network is oriented along the length of the fibrils and is the slow axis (positive birefringence).36,37 The optic axis of myelin is oriented along the length of the axons, but it is the fast axis (negative birefringence). In sections that have had lipids extracted, such as paraffin sections, myelin exhibits positive birefringence.4 If the fiber networks evident in the qPLM images do represent type II collagen fibrils and myelinated neuronal processes, it is significant that the level of fiber detail in the qPLM images is much greater than that observed in immunofluorescence images. qPLM may thus provide a superior means of qualitatively evaluating the organization of collagen fibrils and neuronal processes in cochlear sections, while saving the tissue, time, and expense required to perform immunohistochemistry. One of the primary strengths of the qPLM technique is its ability to provide objective, quantitative information on tissue organization. To explore the utility of these data, we determined mean retardance values () for a variety of cochlear structures at each cochlear turn (Figs. 5 and 6). The retardance values for and mice were similar for all structures. This is important because each strain offers specific experimental advantages. Many models of hearing loss have been developed in the strain, which exhibits early, age-related hearing loss at high frequencies, whereas the strain has good hearing across frequencies in old age. The similarity in cochlear retardance in and mice is likely due to the young age of the imaged mice as both strains have equally good hearing at six weeks of age. Fig. 5Mean retardance values with error bars (in nm) of various cochlear structures plotted for each cochlear turn in () and mice (). , , , and . neuron cell bodies. Error bars depict standard errors of the mean. 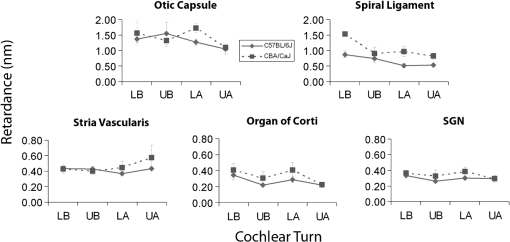 Fig. 6Mean retardance values with error bars (in nm) of various cochlear structures plotted for each cochlear turn in () and mice (). , . Error bars depict standard errors of the mean. 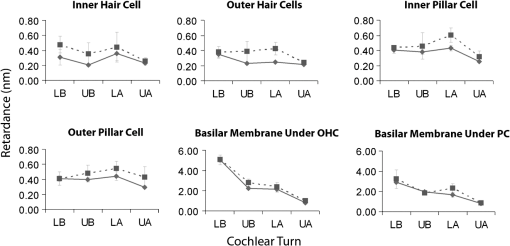 For a given turn, different cochlear structures exhibited different levels of birefringence, with the basilar membrane, spiral ligament and otic capsule being most birefringent. For example, when focusing on the lower basal turn, the mean retardance of the basilar membrane under the outer hair cells was in the mice and in the mice, which was about five times higher than the mean retardance of the spiral ligament ( in the mice and in the mice), and about 12 times higher than the mean retardance of the stria vascularis ( in the mice and in the mice). Some cochlear structures, such as the basilar membrane and the spiral ligament, demonstrated a decreasing gradient of birefringence from the cochlear base to the apex, whereas other structures had more uniform retardance across the cochlear length. For example, the mean retardance of the basilar membrane under the outer hair cells at the upper apical turn was in the mice and in the mice, which was about five to six times smaller, and significantly different from the values at the lower basal turn ( and 0.00020, respectively). Likewise, the mean retardance of the spiral ligament at the upper apical turn was in the mice and in the mice, both of which were significantly smaller than the values at the lower basal turn ( and 0.0043, respectively). We have shown that qPLM provides a powerful tool for qualitative and quantitative analysis of the organization of various cochlear structures. Our results motivate future application of qPLM to characterize various murine models of human hearing loss, based on specific changes in the birefringent properties of cochlear structures. In light of our recent study demonstrating that the optical properties of fixed cochlear tissues are similar to those of unfixed specimens,38 qPLM data from fixed specimens may ultimately be applied in humans in vivo to guide diagnosis and management through the use of new noninvasive imaging modalities. One such imaging modality is optical coherence tomography (OCT), a noninvasive technique that generates cross-sectional images of tissue based on backscattered light from a focused beam directed at the sample. The technique is similar to ultrasound, but uses light instead of sound, allowing for the acquisition of images with high spatial resolution. The OCT resolution, between 2 and 20 μm, exceeds that provided by CT and MRI and is sufficient to allow visualization of cochlear structures.39 In fact, OCT has recently been used to image murine cochlear microanatomy, including the basilar membrane, spiral ligament, and organ of Corti.40–44 An enhanced version of OCT, polarization-sensitive OCT (PS-OCT), allows for measurement of sample birefringence45 and the orientation of the fast axis.46–48 This technique has already been successfully applied to qualitatively and quantitatively examine collagen birefringence patterns in tissue, including human skin.49 However, PS-OCT has not been applied to the cochlea. Assuming linear path lengths, we found the birefringence of cochlear structures to vary between and . PS-OCT may be sufficiently sensitive to detect subtle changes in cochlear birefringence as PS-OCT has been used to determine tissue birefringence levels as low as .50 Our results strongly motivate future application of imaging modalities such as PS-OCT to the human inner ear in vivo to obtain a fundamental new insight to the workings of the inner ear, to establish microstructural diagnosis, and to guide therapy. Successful application of these imaging modalities to the cochlea will require a complete understanding of the baseline optical properties of cochlear structures, including birefringence, and how these properties are altered in disease states. 4.ConclusionWe report the first characterization of optical properties of unstained cochlear structures using qPLM applied to histologic sections. Our results suggest that qPLM has important advantages over immunohistochemistry when qualitatively evaluating the organization of collagen fibrils and myelinated neuronal processes because qPLM provides intricately detailed information on unstained fiber networks, thus saving the tissue, time, and expense required to perform immunohistochemistry. Our results strongly motivate future application of PS-OCT and similar imaging technologies to the human inner ear in vivo. AcknowledgmentsWe are grateful for the support of the National Institute on Deafness and other Communication Disorders Grants K08 DC010419 (K.M.S.) and T32 DC00038 (A.C.L.), the Bertarelli Foundation (K.M.S.), the Harvard Medical School Scholars in Medicine Office (N.M.K.) and the Malaysian Federal Training Scholarship (C.A.O.). S.J.H. and G.H.M. gratefully acknowledge financial support from NASA Microgravity Fluid Sciences (Code UG) Grant NNX09AV99G. We thank Drs. Deborah Perez Fernandez and Johannes Soulages for preliminary studies. References
“Quick Statistics,”
National Institute on Deafness and Other Communication Disorders, 2012). Google Scholar
H. Bennett,
“Methods applicable to the study of both fresh and fixed materials with polarized light,”
McClung’s Handbook of Microscopical Technique, 591
–677 Paul B. Hoeber, New York
(1950). Google Scholar
F. Massoumianet al.,
“Quantitative polarized light microscopy,”
J. Microsc., 209
(1), 13
–22
(2003). http://dx.doi.org/10.1046/j.1365-2818.2003.01095.x JMICAR 0022-2720 Google Scholar
M. Wolman,
“Polarized light microscopy as a tool of diagnostic pathology,”
J. Histochem. Cytochem., 23
(1), 21
–50
(1975). http://dx.doi.org/10.1177/23.1.1090645 JHCYAS 0022-1554 Google Scholar
P. H. Byers,
“Inherited disorders of collagen gene structure and expression,”
Am. J. Med. Genet., 34
(1), 72
–80
(1989). http://dx.doi.org/10.1002/(ISSN)1096-8628 AJMGDA 1096-8628 Google Scholar
H. KuivaniemiG. TrompD. J. Prockop,
“Mutations in collagen genes: causes of rare and some common diseases in humans,”
FASEB J., 5
(7), 2052
–2060
(1991). FAJOEC 0892-6638 Google Scholar
T. Joliatet al.,
“Antibodies against a 30 kilodalton cochlear protein and type II and IX collagens in the serum of patients with inner ear diseases,”
Ann. Otol. Rhinol. Laryngol., 101
(12), 1000
–1006
(1992). AORHA2 0003-4894 Google Scholar
H. Spoendlin,
“Factors inducing retrograde degeneration of the cochlear nerve,”
Ann. Otol. Rhinol. Laryngol. Suppl., 112 76
–82
(1984). Google Scholar
P. A. LeakeG. T. Hradek,
“Cochlear pathology of long term neomycin induced deafness in cats,”
Hear. Res., 33
(1), 11
–33
(1988). http://dx.doi.org/10.1016/0378-5955(88)90018-4 HERED3 0378-5955 Google Scholar
K. FacklerL. KleinA. Hiltner,
“Polarizing light microscopy of intestine and its relationship to mechanical behaviour,”
J. Microsc., 124
(3), 305
–311
(1981). http://dx.doi.org/10.1111/jmi.1981.124.issue-3 JMICAR 0022-2720 Google Scholar
X. R. Huanget al.,
“Variation of peripapillary retinal nerve fiber layer birefringence in normal human subjects,”
Invest. Ophthalmol. Vis. Sci., 45
(9), 3073
–3080
(2004). http://dx.doi.org/10.1167/iovs.04-0110 IOVSDA 0146-0404 Google Scholar
L. Liuet al.,
“Increased birefringence in the meiotic spindle provides a new marker for the onset of activation in living oocytes,”
Biol. Reprod., 63
(1), 251
–258
(2000). http://dx.doi.org/10.1095/biolreprod63.1.251 BIREBV 0006-3363 Google Scholar
P. TranE. D. SalmonR. Oldenbourg,
“Quantifying single and bundled microtubules with the polarized light microscope,”
Biol. Bull., 189
(2), 206
(1995). BIBUBX 0006-3185 Google Scholar
Y. Shenet al.,
“High magnitude of light retardation by the zona pellucida is associated with conception cycles,”
Hum. Reprod., 20
(6), 1596
–1606
(2005). http://dx.doi.org/10.1093/humrep/deh811 HUREEE 0268-1161 Google Scholar
T. RenX. LinA. L. Nuttall,
“Polarized-light intravital microscopy for study of cochlear microcirculation,”
Microvasc. Res., 46
(3), 383
–393
(1993). http://dx.doi.org/10.1006/mvre.1993.1061 MIVRA6 0026-2862 Google Scholar
G. I. Wenzelet al.,
“Laser irradiation of the guinea pig basilar membrane,”
Lasers Surg. Med., 35
(3), 174
–180
(2004). http://dx.doi.org/10.1002/(ISSN)1096-9101 LSMEDI 0196-8092 Google Scholar
G. I. Wenzelet al.,
“Laser-induced collagen remodeling and deposition within the basilar membrane of the mouse cochlea,”
J. Biomed. Opt., 12
(2), 021007
(2007). http://dx.doi.org/10.1117/1.2714286 JBOPFO 1083-3668 Google Scholar
P. S. Jouket al.,
“Mapping of the orientation of myocardial cells by means of polarized light and confocal scanning laser microscopy,”
Microsc. Res. Tech., 30
(6), 480
–490
(1995). http://dx.doi.org/10.1002/(ISSN)1097-0029 MRTEEO 1059-910X Google Scholar
R. OldenbourgG. Mei,
“New polarized light microscope with precision universal compensator,”
J. Microsc., 180
(2), 140
–147
(1995). http://dx.doi.org/10.1111/jmi.1995.180.issue-2 JMICAR 0022-2720 Google Scholar
R. Oldenbourg,
“A new view on polarization microscopy,”
Nature, 381
(6585), 811
–812
(1996). http://dx.doi.org/10.1038/381811a0 NATUAS 0028-0836 Google Scholar
J. Rieppoet al.,
“Practical considerations in the use of polarized light microscopy in the analysis of the collagen network in articular cartilage,”
Microsc. Res. Technol., 71
(4), 279
–287
(2008). http://dx.doi.org/10.1002/(ISSN)1097-0029 MRTEEO 1059-910X Google Scholar
J. P. Arokoskiet al.,
“Decreased birefringence of the superficial zone collagen network in the canine knee (stifle) articular cartilage after long distance running training, detected by quantitative polarised light microscopy,”
Ann. Rheum. Dis., 55
(4), 253
–264
(1996). http://dx.doi.org/10.1136/ard.55.4.253 ARDIAO 0003-4967 Google Scholar
Y. Xiaet al.,
“Quantitative in situ correlation between microscopic MRI and polarized light microscopy studies of articular cartilage,”
Osteoarthr. Cartilage, 9
(5), 393
–406
(2001). http://dx.doi.org/10.1053/joca.2000.0405 OSCAEO 1063-4584 Google Scholar
S. V. Madiballyet al.,
“Influence of insulin therapy on burn wound healing in rats,”
J. Surg. Res., 109
(2), 92
–100
(2003). http://dx.doi.org/10.1016/S0022-4804(02)00036-7 JSGRA2 0022-4804 Google Scholar
M. F. Woodet al.,
“Polarization birefringence measurements for characterizing the myocardium, including healthy, infarcted, and stem-cell-regenerated tissues,”
J. Biomed. Opt., 15
(4), 047009
(2010). http://dx.doi.org/10.1117/1.3469844 JBOPFO 1083-3668 Google Scholar
A. J. RoweH. M. FinlayP. B. Canham,
“Collagen biomechanics in cerebral arteries and bifurcations assessed by polarizing microscopy,”
J. Vasc. Res., 40
(4), 406
–415
(2003). http://dx.doi.org/10.1159/000072831 JVREE9 1018-1172 Google Scholar
H. Axeret al.,
“Quantitative estimation of 3-D fiber course in gross histological sections of the human brain using polarized light,”
J. Neurosci. Methods, 105
(2), 121
–131
(2001). http://dx.doi.org/10.1016/S0165-0270(00)00349-6 JNMEDT 0165-0270 Google Scholar
L. Larsenet al.,
“Polarized light imaging of white matter architecture,”
Microsc. Res. Tech., 70
(10), 851
–863
(2007). http://dx.doi.org/10.1002/(ISSN)1097-0029 MRTEEO 1059-910X Google Scholar
M. ShribakR. Oldenbourg,
“Techniques for fast and sensitive measurements of two-dimensional birefringence distributions,”
Appl. Opt., 42
(16), 3009
–3017
(2003). http://dx.doi.org/10.1364/AO.42.003009 APOPAI 0003-6935 Google Scholar
W. A. Shurcliff, Polarized Light, Production and Use, Harvard University Press, Cambridge, Massachusetts
(1962). Google Scholar
N. B. SlepeckyJ. E. SavageT. J. Yoo,
“Localization of type II, IX and V collagen in the inner ear,”
Acta Otolaryngol., 112
(2), 611
–617
(1992). http://dx.doi.org/10.3109/00016489209137449 AOLAAJ 0001-6489 Google Scholar
H. Kanameet al.,
“Ultrastructural and immunocytochemical study of the subepithelial fiber component of the guinea pig inner ear,”
J. Electron. Microsc. (Tokyo), 43
(6), 394
–397
(1994). Google Scholar
V. TsuprunP. Santi,
“Ultrastructure and immunohistochemical identification of the extracellular matrix of the chinchilla cochlea,”
Hear. Res., 129
(1–2), 35
–49
(1999). http://dx.doi.org/10.1016/S0378-5955(98)00219-6 HERED3 0378-5955 Google Scholar
F. J. DreilingM. M. HensonO. W. Henson Jr.,
“The presence and arrangement of type II collagen in the basilar membrane,”
Hear. Res., 166
(1–2), 166
–180
(2002). http://dx.doi.org/10.1016/S0378-5955(02)00314-3 HERED3 0378-5955 Google Scholar
P. A. HurleyJ. M. CrookR. K. Shepherd,
“Schwann cells revert to non-myelinating phenotypes in the deafened rat cochlea,”
Eur. J. Neurosci., 26
(7), 1813
–1821
(2007). http://dx.doi.org/10.1111/j.1460-9568.2007.05811.x EJONEI 0953-816X Google Scholar
D. B. Brewer,
“Differences in the fine structure of collagen and reticulin as revealed by the polarising microscope,”
J. Pathol. Bacteriol., 74
(2), 371
–385
(1957). http://dx.doi.org/10.1002/(ISSN)1555-2039 JPBAA7 0368-3494 Google Scholar
D. M. Maurice,
“The Cornea and Sclera,”
The Eye, 289
–368 Academic Press, New York
(1962). Google Scholar
X. Yanget al.,
“Two-photon microscopy of the mouse cochlea in situ for cellular diagnosis,”
J. Biomed. Opt., 18
(3), 31104
(2013). http://dx.doi.org/10.1117/1.JBO.18.3.031104 JBOPFO 1083-3668 Google Scholar
D. Huanget al.,
“Optical coherence tomography,”
Science, 254
(5035), 1178
–1181
(1991). http://dx.doi.org/10.1126/science.1957169 SCIEAS 0036-8075 Google Scholar
B. J. Wonget al.,
“Optical coherence tomography of the rat cochlea,”
J. Biomed. Opt., 5
(4), 367
–370
(2000). http://dx.doi.org/10.1117/1.1310165 JBOPFO 1083-3668 Google Scholar
B. J. Wonget al.,
“Imaging the internal structure of the rat cochlea using optical coherence tomography at 0.827 microm and 1.3 microm,”
Otolaryngol. Head. Neck. Surg., 130
(3), 334
–338
(2004). http://dx.doi.org/10.1016/j.otohns.2003.11.007 OHNSDL 0194-5998 Google Scholar
A. Sepehret al.,
“Optical coherence tomography of the cochlea in the porcine model,”
Laryngoscope, 118
(8), 1449
–1451
(2008). http://dx.doi.org/10.1097/MLG.0b013e318173dd6c LARYA8 0023-852X Google Scholar
J. LinH. StaeckerM. S. Jafri,
“Optical coherence tomography imaging of the inner ear: a feasibility study with implications for cochlear implantation,”
Ann. Otol. Rhinol. Laryngol., 117
(5), 341
–346
(2008). AORHA2 0003-4894 Google Scholar
H. M. Subhashet al.,
“Volumetric in vivo imaging of intracochlear microstructures in mice by high-speed spectral domain optical coherence tomography,”
J. Biomed. Opt., 15
(3), 036024
(2010). http://dx.doi.org/10.1117/1.3456554 JBOPFO 1083-3668 Google Scholar
J. F. de Boeret al.,
“Two-dimensional birefringence imaging in biological tissue by polarization-sensitive optical coherence tomography,”
Opt. Lett., 22
(12), 934
–936
(1997). http://dx.doi.org/10.1364/OL.22.000934 OPLEDP 0146-9592 Google Scholar
J. F. de BoerT. E. MilnerJ. S. Nelson,
“Determination of the depth-resolved Stokes parameters of light backscattered from turbid media by use of polarization-sensitive optical coherence tomography,”
Opt. Lett., 24
(5), 300
–302
(1999). http://dx.doi.org/10.1364/OL.24.000300 OPLEDP 0146-9592 Google Scholar
J. E. Rothet al.,
“Simplified method for polarization-sensitive optical coherence tomography,”
Opt. Lett., 26
(14), 1069
–1071
(2001). http://dx.doi.org/10.1364/OL.26.001069 OPLEDP 0146-9592 Google Scholar
C. Hitzenbergeret al.,
“Measurement and imaging of birefringence and optic axis orientation by phase resolved polarization sensitive optical coherence tomography,”
Opt. Express, 9
(13), 780
–790
(2001). http://dx.doi.org/10.1364/OE.9.000780 OPEXFF 1094-4087 Google Scholar
M. C. Pierceet al.,
“Collagen denaturation can be quantified in burned human skin using polarization-sensitive optical coherence tomography,”
Burns, 30
(6), 511
–517
(2004). http://dx.doi.org/10.1016/j.burns.2004.02.004 BURND8 0305-4179 Google Scholar
C. C. Wuet al.,
“Tissue birefringence of hypercholesterolemic rat liver measured with polarization-sensitive optical coherence tomography,”
J. Biomed. Opt., 12
(6), 064022
(2007). http://dx.doi.org/10.1117/1.2812647 JBOPFO 1083-3668 Google Scholar
|

