|
|
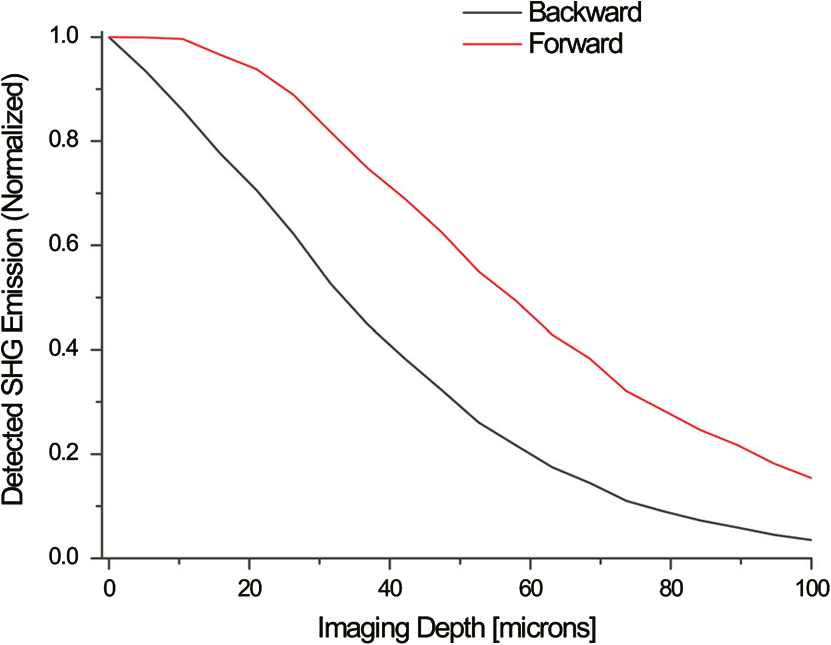
1.IntroductionSpontaneous preterm birth (sPTB), the leading global cause of neonatal death, affects more than 13 million babies every year.1 Premature babies that survive are at lifetime risk for cerebral palsy, respiratory morbidity, mental retardation, blindness, deafness, cardiovascular disease, and cancer.2 The financial and emotional ramifications of preterm birth are staggering; one of every eight births in the U.S. is preterm, costing in excess of $26 billion annually.3,4 Decades of concerted research effort has not reduced the incidence of sPTB; we simply do not understand the problem.5,6 This is not surprising given its complexity. sPTB is multifactorial, the final common denominator of the interaction of a multitude of factors including social stress, infection/inflammation, poor nutrition, genetics, and others.5–9 Interest in the cervix has recently exploded as its critical role in preterm birth has been elucidated; the complex and overlapping pathways to sPTB dovetail into the singular process of remodeling of cervical microstructure, and therefore it is hypothesized that a comprehensive understanding of that microstructure would allow targeted study of upstream molecular mechanisms.5,7,8 Unfortunately, we lack a basic understanding of cervical microstructure, let alone its changes during pregnancy, because its identification and quantification is not trivial. Murine and bovine models suggest two or three layers of collagen in the cervix: a wide central circumferential layer that undergoes relatively greater reorganization in pregnancy than one or two flanking longitudinal layers.10–12 There is a paucity of information about the human cervix because investigation is compromised by the impracticalities of invasive study.13 Like other mammalian models, studies suggest a wide circumferential layer, but disagree about one versus two flanking longitudinal layers. Dubrauszky et al. evaluated a cross-section from the mid cervix of four premenopausal and 11 pregnant cadavers or hysterectomy specimens, noting an inner “noncoordinated cluster-like interweaving” of fibers, a circular central layer, and a “for the most part” longitudinal outer layer, all of which are preserved in pregnant tissue, albeit with a more “relaxed” appearance.14 Aspden and Hukins studied five nonpregnant cervices, and also reported three layers of fibers, proposing that the outer layer prevents the cervix from being torn off while the central layer controls dilation like a ratchet.15,16 Multiple cross-sections were obtained from one cervix, in which the thickness of the inner layer diminished and middle layer increased from proximal to distal.16 Weiss et al. used in vivo diffusion tensor imaging, but after examining five pregnant women, reported that the cervix is even less straightforward than previously described, containing only two overlapping layers, an outer wide circumferential layer and an inner “mostly” longitudinal layer.17 Understanding cervical microstructure is critical because it determines cervical strength. During pregnancy, degradation of collagen crosslinks causes fiber disorganization and increased collagen extractability, which results in the softening, shortening, and dilation that characterizes cervical remodeling.13,18–27 This series of events needs to occur to allow eventual vaginal delivery of a fetus, but premature changes and/or underlying abnormal cervical microstructure may result in preterm birth.28 Paramount to solving the problem of preterm birth is targeted and thorough evaluation of the cervix, and this is our motivation for developing quantitative ultrasound (QUS) methods for in vivo study of cervical collagen microstructure. Our choice of QUS methods is based on the assumption that collagen is the dominant source of acoustic scattering in cervical tissue, as it is for many tissues.29–32 The ability to detect and quantify progressive microstructural changes should facilitate targeted exploration of the associated molecular mechanisms, thus opening the pathway to novel approaches to preventing preterm birth. High-resolution combined imaging of collagen microstructure is an imperative part of our investigation, both to corroborate ultrasound measurements and for comprehensive investigation of cervical microstructure. Second harmonic generation imaging microscopy (SHG) is well suited to this purpose. The fundamental unit of collagen is tropocollagen, a long (300 nm) triple helix protein structure. Cleavage of the pro-peptide termini allow the triple helices to bind together to form collagen fibrils with diameters of 0.1 to 0.5 μm which then link together to form fibers of larger diameter. These different levels of organization can be readily discerned by SHG.33 SHG images collagen by inducing a polarization in a material that is noncentrosymmetric. Unlike multiphoton excited fluorescent microscopy,34 all the energy is conserved, thus the emitted photon has exactly twice the frequency and energy of the incident photon but half the wavelength. Due to the coherence, SHG is directly sensitive to fibril size and organization.34 Moreover, the contrast is endogenous, eliminating the need for staining or exogenous tags, which is useful for looking at intact samples and, ultimately, perhaps the in vivo cervix. Other key advantages are deep optical sectioning35 and less photobleaching.36 In addition, because collagen is a fundamental component of the cellular microenvironment, it can be exploited as part of a metric to study cellular behavior and therefore SHG imaging is a valuable optical biomarker for cellular processes. For instance, it can be used to monitor cancer progression and treatment response; Provenzano et al. described tumor association collagen signatures and the corresponding changes in collagen with breast cancer progression,37 and collagen order in ovarian cancer has been investigated with forward and backward collection of SHG.38,39 Further, SHG imaging has been used to study collagen orientation during wound healing and scar formation,40 and mechanical aspects of collagen have been studied in arteries41 and the trachea.42 Simple SHG techniques have been recently applied to the cervix. One study compared two human cervices from cesarean hysterectomy specimens with one cervix from a nonpregnant specimen.43 Collagen layers were apparent in all cervices, but the authors noted the signal was “less sharp” in the pregnant tissue, implying that the fibers were less well aligned than in nonpregnant tissue.43 Another study applied texture analysis techniques to endomicroscopic SHG images from ex vivo mouse cervices at different gestational ages, demonstrating progressive collagen disorganization throughout pregnancy, particularly in the central circumferential layer.44 We introduce a technique for direct multiscale comparison of detailed human cervical microstructure. We stitch together single SHG image sections into comprehensive cross-sectional images of cervical tissue that preserve the detailed microstructure, and register those comprehensive SHG images with B-mode ultrasound images and QUS measurements. We then compare curvelets-based alignment analysis of the SHG images with QUS parameters for objective evaluation of collagen structure and alignment. This detailed analysis demonstrates that SHG provides not only corroboration of the QUS measurements but also significant insight into cervical microstructure. To our knowledge, this is the largest study of human cervical microstructure to date, and the first to corroborate cervical microstructure with a noninvasive ultrasound technique that is feasible for in vivo study during pregnancy. 2.Materials and Methods2.1.Tissue Acquisition and PreparationFigure 1 is a diagram of the cervix. To study its microstructure, we collected hysterectomy specimens from subjects undergoing surgery for benign reasons not involving cervical pathology ). The specimens were brought to our lab within 1 h of excision. QUS measurements (described below) were acquired, and sections of approximately 1.5 mm were excised and placed in formalin for subsequent SHG imaging. All work was approved by the University of Wisconsin Health Sciences Institutional Review Board. Fig. 1A cross-sectional view of the cervix. The uterus is above the internal os, and the cervix below. The proximal portion of the cervix (closest to the uterus) resides in the pelvis, and the distal portion protrudes into the vagina. The inner cavity is called the endocervical canal and is contiguous with the uterine cavity. (b) Distal portion of the cervix as seen through a speculum. Locations on the cervix are conventionally labeled as if the distal end were the face of a clock.  Figure 2 illustrates the shape and location of the sections. Transverse sections were collected from proximal, medial, and distal locations along the canal, and the longitudinal sections started at the outer os and extended the length of the canal to the inner os. Prior to SHG imaging, sections were sliced into 200 to 400 μm thick sections with a vibrotome (Leica VT1200S semiautomatic vibrating blade microtome; Leica MicroSystems, Buffalo Grove, Illinois) and, if necessary to fit into the optical dish, cut into two or three smaller pieces. Each section was placed in a glass-bottom optical dish for imaging, and a small drop of water and a cover slip were placed on the tissue sample to inhibit desiccation and help prevent tissue curling. Fig. 2A hysterectomy specimen with biopsy samples removed. The uterus (top of image, labeled) and cervix have been bi-valved, and the cervix unrolled such that the surface of the endocervical canal was nominally flat. A longitudinal (parallel to the canal) cross-section has been cut from the anterior side (shown on the left) and three transverse cross-sections (perpendicular to the canal) from about 12:00 to about 6:00 were cut from the proximal, middle, and distal regions of the cervix. The dashed line shows the location of the canal. For the longitudinal biopsy, the canal is on the right of the tissue section. For the distal and medial transverse biopsies, the canal has been partially re-formed and is located in the interior of the samples. The canal is on the edge of the proximal slice and not apparent in this image. For the rest of the cervical tissue (center of the image, not biopsied), the dashed line indicates the boundary of the surface of the unrolled canal. 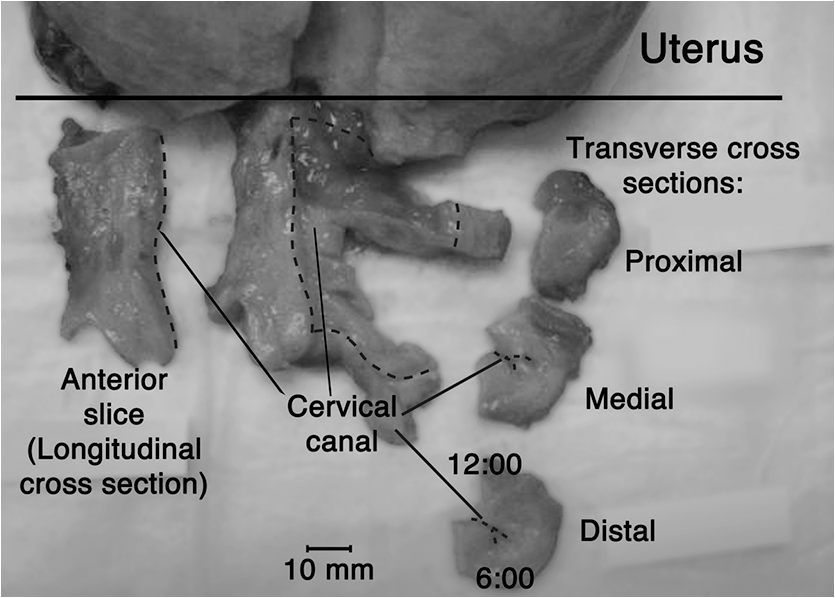 2.2.MicroscopyThree-dimensional (3-D) SHG imaging was performed on a custom microscope capable of collecting both the forward and backward components of the SHG emission in order to investigate the potential for increased SHG image signal to noise ratio when forward SHG signals or forward combined with backward SHG signals were used. This system consisted of a laser-scanning unit (Fluoview 300; Olympus, Center Valley, Pennsylvania) mounted on an upright microscope stand (BX61, Olympus), coupled to a mode-locked Ti:Sapphire femtosecond laser (Mira; Coherent, Santa Clara, California). The excitation wavelength was 890 nm and the signal was detected at 445 nm using a 20 nm bandpass filter (Semrock, Rochester, New York). The light was focused onto the sample using a [numerical aperture ] water-immersion lens (Olympus). The water-immersion lens was used to best match the refractive index of the laser light passed into the tissue. Forward and backward SHG signals were collected simultaneously using two identical 7421 GaAsP photon-counting modules (Hamamatsu, Bridgewater, New Jersey). A single () -location of a 400 μm thick sample was imaged and optically sliced from the surface of the sample to a depth of about 50 μm in steps of 1 μm. We visually evaluated image quality as we moved the focal depth of the excitation laser deeper into the tissue in order to determine the optimal slice thickness for our investigation and assess the potential for creating composite 3-D images. Composite two-dimensional (2-D) SHG image data were collected on an Optical Workstation45 that was constructed around a Nikon (Mehlville, New York) Eclipse TE300 inverted microscope. An excitation wavelength of 890 nm was generated by a MaiTai Deepsee Ti:sapphire laser (Spectra Physics, Mountain View, California). The beam was focused onto the sample with a Nikon Super Fluor air-immersion lens (). A digital zoom () was chosen because it was the lowest magnification [largest field of view ()] that still allowed good resolution of collagen fibers. The backward SHG signal was detected using a H7422 GaAsP photomultiplier detector (Hamamatsu). The presence of collagen was confirmed by filtering the emission signal with a 445 nm (1 nm bandpass) filter (TFI Technologies, Greenfield, Massachusetts) to isolate the SHG signal. Acquisition was performed with WiscScan ( http://www.loci.wisc.edu/software/wiscscan), a laser scanning software acquisition package developed at LOCI (Laboratory for Optical and Computational Instrumentation, University of Wisconsin, Madison, Wisconsin). To acquire the data for composite SHG images, we developed software for WiscScan to automatically control the -stage on the microscope and acquire individual images at each location in a rasterized grid configuration. Subimages within a grid overlap to provide redundant data that allow correlation techniques to align adjacent locations and assemble the final compiled image. We acquired several -slices in order to keep the surface of a tissue sample in focus over an entire grid. This was necessary because of a 50 to 100 μm fluctuation in the location of the tissue sample surface (with a maximum optical penetration of only 50 μm). The size of a grid was optimized to fit the local size and shape of the tissue specimen, and multiple adjacent (and overlapping) grids were collected. The individual images from each tile location were stitched together off-line using a semi-automatic technique involving a combination of Fiji (a distribution of ImageJ)46,47 and Adobe PhotoShop CS4 (Adobe Systems Inc., San Jose, California). The -stage location of each -stack (a series of -slices at the same -location) was saved and embedded in the image metadata. The stacks were fed into the Fiji plug-in “Stitch-ome-tiff” which read the metadata from each stack and optimized the absolute location of each tile (to take into account uncertainty of the -translations). Finally it blended the tiles into a composite image stack of -slices. The slices were projected onto a single plane (in Fiji) resulting in a 2-D image of the surface of the sample. This flattened image was then used with other adjacent grids in the final stitching step of merging all the grids together to form the composite SHG image. Images from adjacent grids were aligned visually using Adobe PhotoShop CS4 and blended together with the “auto-Blend” feature to create a nearly seamless 2-D image of the surface of the tissue section. The centimeter-scale composite SHG images were assembled from individual images (; ) that had 20% to 30% overlap. Tissue cross-sections which had been cut into multiple pieces prior to imaging were imaged separately and aligned with Adobe PhotoShop CS4 after all stitching was complete. 2.3.Ultrasound Data AcquisitionUltrasound data were acquired prior to sectioning tissue for SHG imaging. Radio frequency (RF) echo data were acquired with a clinical ultrasound imaging system (Siemens S2000; Siemens Medical Solutions, USA, Malvern, Pennsylvania) using the Axius Direct ultrasound research interface. Scanning was performed with a commercially available small parts transducer (18L6) as well as an intracavitary prototype transducer. The standard transducer (18L6) has a 51 mm aperture which allows for a continuous ultrasound data field in the ex vivo cervix along the entire length of the canal. Because this transducer is unsuitable for in vivo study (it cannot fit inside the vagina), we also collected data with the smaller prototype transducer to confirm that we could adequately stitch together adjacent images to create a full-length image of the cervix such as is obtainable with the larger transducer. This prototype is a 10-French (3.3 mm diameter), 128-element (14 mm long) array transducer with a center frequency of about 7.5 MHz, 80% bandwidth, and 110 μm pitch, which is small enough to acquire data from within the canal as well as from the external surface of the cervix for comprehensive evaluation. This array covers about one-third of the length of the cervix. Therefore, it was attached to an translational stage to provide systematic movement of the transducer in two to three increments with 30% to 40% overlap in order to stitch and blend adjacent ultrasound data sets, thus forming a composite B-mode image of the entire sample. Both transducers were operated in “linear array mode” where all acoustic beams within the set of data are parallel to each other; this provides a constant angle of incidence for the acoustic beams interacting with the tissue microstructure. RF echo data were collected at beam steering angles of incremented in steps of 4 deg. The composite SHG images were registered with the ultrasound B-mode images via identification of anatomical landmarks (cysts, blood vessels, boundaries) seen in both images followed by manual alignment of data sets using Adobe Photoshop CS4. B-mode images were only allowed to rigidly translate and rotate in order to account for uncertainty in the exact orientation of the ultrasound transducer with the cervical canal. A square scaling (no distortion or skewing) was also used to ensure that the image scales were comparable. This appropriately addressed any possible isotropic shrinking from the fixing process. An important note is that aligning ultrasound B-mode images with SHG images automatically registers SHG with QUS data because all US information is derived from the same RF echo data. The echo signal power spectrum, and the generalized spectrum48,49 of the RF echo data were calculated using overlapping segments from the acquired data (each beam steering angle). QUS parameter estimates were formed from the ultrasound RF echo signal power spectrum. Excess backscattered power loss50 (eBSPL, the power loss beyond that which is expected due to system effects) and integrated generalized spectrum/collapsed average48,49 (CA, a measure of echo signal coherence) were calculated as previously described. These parameters evaluate microstructural arrangement sensed by the propagating ultrasound beam. Briefly, higher values of eBSPL are associated with greater collagen alignment within the ultrasound pulse volume,50 and greater integrated CA (iCA) occurs in regions containing strong isolated scatterers, interfaces separating regions of differing collagen alignment or fiber density, or regions containing (quasi-)periodic structures.48,49 2.4.Multiscale AnalysisSHG images were registered with B-mode images and superimposed with the QUS parameters described above in order to facilitate direct comparison of the millimeter-scale QUS values with the micron-scale collagen cervical microstructure seen in SHG images. For quantitative analysis, curvelets-based alignment analysis (CBAA) (Refs. 51 and 52) was applied to the SHG images to objectively assess local orientation, organization, and strength of alignment within the images, and to provide an intermediate scale to aid the comparison between the SHG and QUS values. The curvelet transform is an image analysis tool which efficiently detects edges and returns the orientation of those edges with respect to a reference, such as a horizontal line.34 For the CBAA, a fully stitched, composite SHG image of the cervix was broken down into regions of interest, and each region of interest was analyzed by sensing edges with an aspect ratio of 2:1 and keeping 10% of the coefficients from the curvelets transform. Average values for the organization and strength of alignment were obtained for each region of interest, and particular attention was paid to changes in strength of alignment because that may indicate a layer boundary. Because quantitative evidence of collagen alignment and layer boundaries is also provided through eBSPL and iCA, this multiscale approach provides multiple levels of corroborative evidence of microstructural alignment. 3.Results3.1.Achievable Imaging DepthWe first determined the maximum optical penetration achievable by SHG because this is highly dependent on the specific scattering and refractive index properties of the tissue being imaged, and there is no available information in the literature for cervix. Figure 3 is an image at of the forward SHG signal along with the corresponding orthogonal views, and is representative of the structure found in all cervices. Crosshairs depict the location of each of the other imaging planes. We visually evaluated image quality as we moved the focal depth of the excitation laser deeper into the tissue in order to determine the optimal slice thickness for our investigation and assess the potential for creating 3-D composite images. We noticed that even with a variety of immersion lens types (including water and oil lenses) and range of wavelengths (800 to 900 nm), the penetration was limited to less than 0.1 mm below the surface, likely due to high light scattering (see below). Because the lens type or lens specifications made no noticeable difference in our ability to form 3-D SHG images, we used the lowest magnification lens available (, 0.5 NA air-immersion) for the composite 2-D images in order to collect the fewest number of overlapping individual images. This gave the largest field of view, improving collection times for large montages. Fig. 3Orthogonal views of a 3-D SHG image of a longitudinal cervical section. The focal depth was incrementally increased to assess the maximum depth of penetration. Images on the top and left represent the corresponding orthogonal views, such that planes formed by those images would intersect where the horizontal and vertical lines (yellow boxes) intersect. Good signal to noise was obtained up to a depth of about 50 μm. 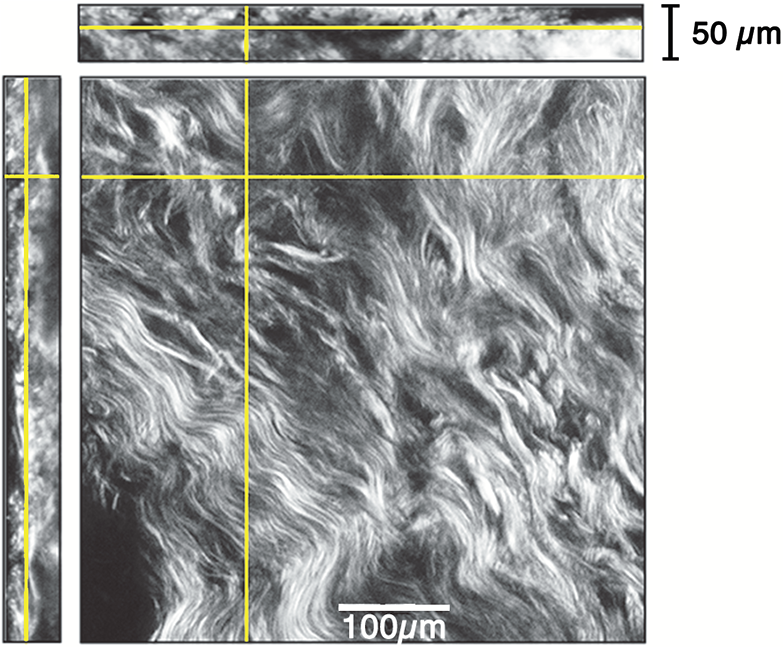 Beyond a depth of about 50 μm, the signal to noise in SHG images gradually decreased such that no features were resolvable or additional structural information gained. Blurring of features began around (just below the cross-hairs in Fig. 3). This made it necessary to acquire several -slices in order to continuously image the tissue (which could demonstrate a 50 to 100 μm fluctuation in the location of the tissue sample surface). The limited depth of SHG imaging can be understood by examining the loss mechanisms. We have previously shown34,38 that for forward detected SHG, the principle factor limiting the imaging depth is the primary filter effect, i.e., the loss of the laser excitation due to scattering as it traverses the tissue. In contrast, the secondary filter effect, i.e., loss of the SHG signal due to scattering, is minimal. This is because the SHG intensity depends on the square of the excitation power, and while scattering at this longer wavelength is reduced relative to , the former effect dominates. For backward detected SHG, we have shown that both the primary and secondary filters are operative, because at greater depths, the laser is increasingly attenuated and the SHG signal has a longer pathway to the tissue exit and detection. Because 50 to 100 μm penetration was less than we hoped, we performed simulations to validate this experimental observation. We expect the bulk optical properties in cervix to be similar to human ovarian stroma because both are female reproductive tissue comprised of dense, highly organized collagen. Therefore, using our measured values for ovary,38 we approximated the achievable imaging depths in forward and backward detected SHG in cervix using Monte Carlo simulations.34,38 Figure 4 shows the resulting simulations as a function of depth for both channels, where each is normalized to its respective maximum. We find that the backward SHG at 50 and 100 μm is reduced to approximately 30% and 5%, respectively, of the maximum, where the attenuation is much slower for the forward channel. Given the initially produced forward/backward SHG ratio will be in the range of ,34 the backward signals are further reduced relative to the forward direction. These results suggest that backward detected SHG from the highly scattering cervix will be limited to about 50 μm at the excitation and SHG wavelengths used here (890 and 445 nm, respectively). In summary, the use of forward or backward SHG made no significant difference in overall SHG imaging depth achieved. We therefore used the inverted multiphoton microscope with backward SHG collection for composite 2-D SHG imaging because it has better tissue clearance and working distance. 3.2.Overall MorphologyFigures 5Fig. 6Fig. 7Fig. 8 to 9 are representative of our findings in all cervices. Figure 5(a) to 5(c) shows three individual tiles from different areas within a transverse cross-section of cervical tissue from a single -slice, highlighted by the boxes on Fig. 6. Also shown in Fig. 5 is the results of curvelet-based alignment analysis (CBAA; described below) on each of those tiles. Figure 6 is the fully stitched image of the entire transverse cross-section, assembled from the projection of about 6 to 10 -slices (spaced 25 μm apart). Each slice was made up of about 450 tiles (each ) that overlapped by 20% to 30%. An important note is that the magnification of the composite image is lower here for display purposes, but the details of collagen fibrils, fibers, and bundles are preserved in the stitching process, making it possible to zoom in (obtaining micron-scale detail) to interpret those features in the original image for detailed understanding and corroboration of CBAA and QUS parameter estimates. Fig. 5Shown in subfigures (a) to (c) are three example tiles (; ) from the three areas outlined by boxes in Fig. 6. Figure 5(d) to 5(f) shows the results of curvelet-based collagen alignment in the respective tiles. Figure 5(g) to 5(i) shows the histogram of collagen alignment angles in the corresponding images.  Fig. 6The composite SHG image of the surface () of a transverse cross-section of cervix (6:00 to 12:00) from the medial part of the cervix. The image is . The canal is on the right side of the image and the serosal surface of the cervix on the left. The boxes indicate the locations of tiles shown in Fig. 5. Short fibers toward the canal indicate primary alignment of collagen fibers is longitudinal (perpendicular to this image plane), and circumferentially orientated fibers appear farther from the canal. 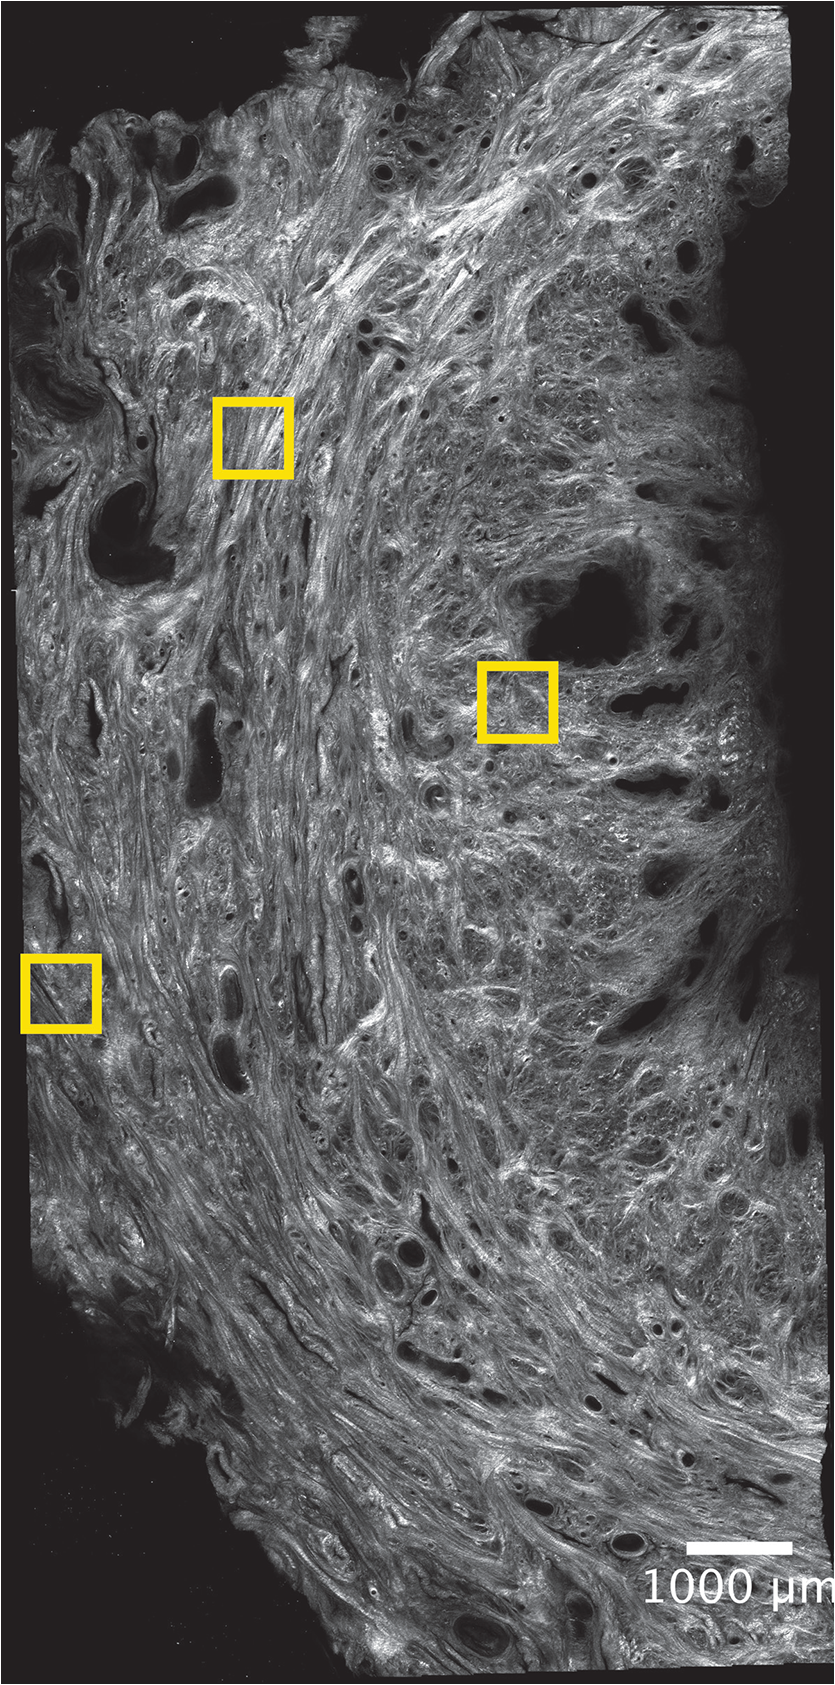 Fig. 7The composite SHG image of a longitudinal section from the posterior part of a cervix, with the canal at the top of the image, the outer serosal surface at the bottom, the more proximal region on the right, and the more distal on the left. The image is . Consistent with Fig. 6, longitudinally oriented fibers dominate the region closest to the canal, with fibers that appear shorter (indicating circumferentially orientated fibers) farther from the canal. 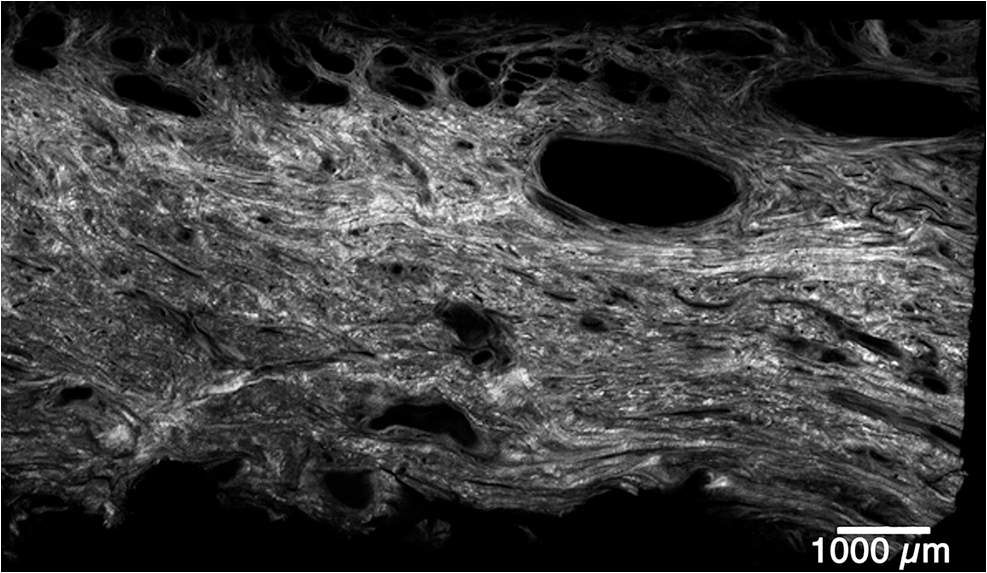 Fig. 8An example of the overlay of an SHG image with an ultrasound B-mode image. Figure 8(a) shows the SHG image of a longitudinal cross-section () of nulliparous cervix tissue. Figure 8(b) shows the corresponding B-mode image of the sample acquired with the 51-mm-long 18L6 array transducer. The B-mode image is . Figure 8(c) shows the B-mode image with the SHG image registered and superimposed. Figure 8(d) shows the registered SHG and B-mode image with edges detected in the SHG image. Figure 8(e) shows the B-mode image overlaid with the edges that were detected in the SHG image. 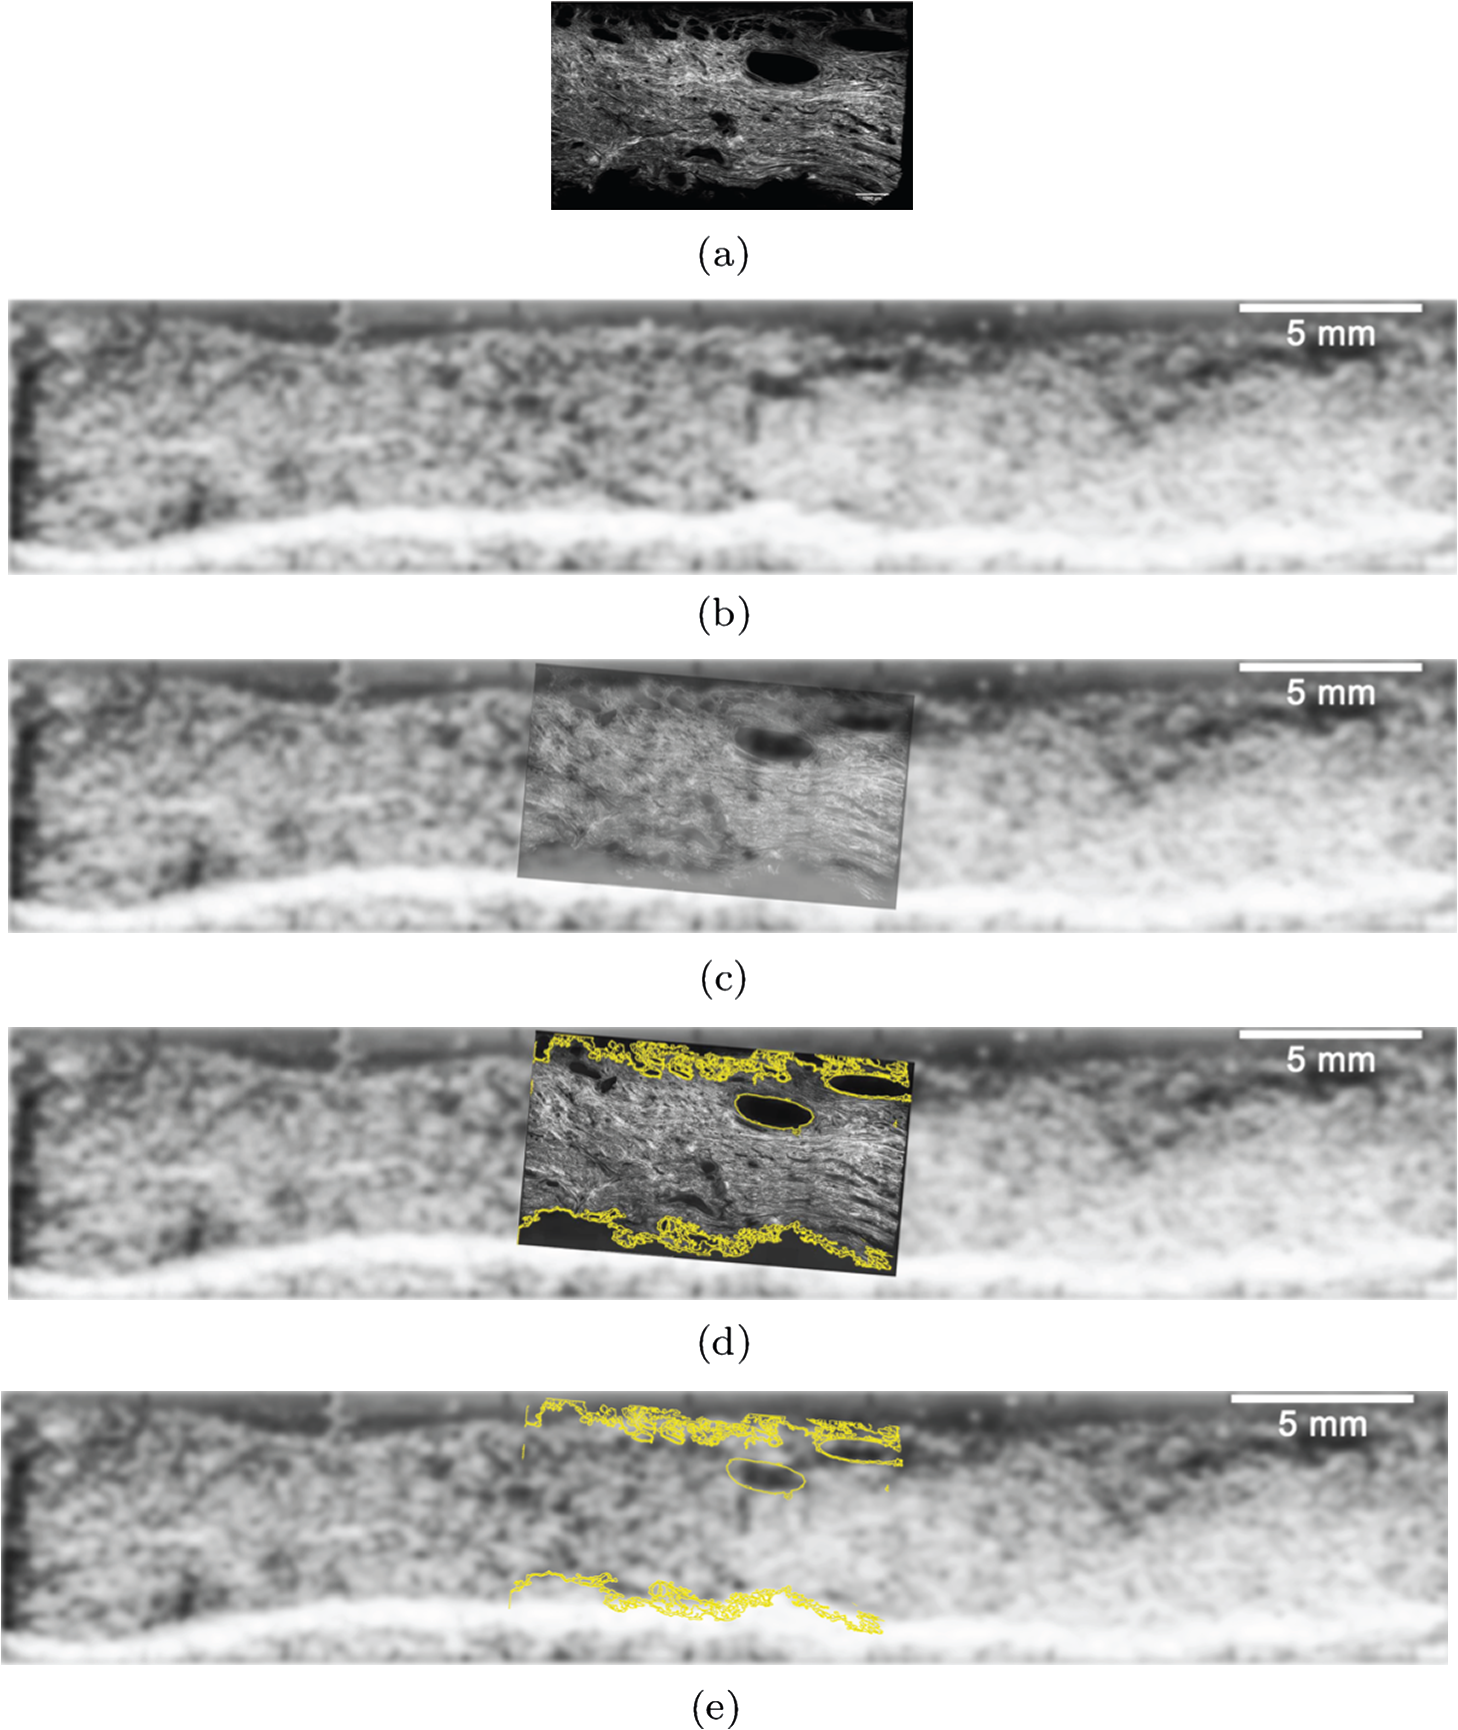 Fig. 9A composite SHG image of a full longitudinal cross-section of cervix tissue (cut into three sections) registered with the stitched B-mode image and overlaid with QUS parameter estimates. Figure 9(a) is the composite SHG image. The canal is at the top of the image and the distal end is at the left edge. Figure 9(b) shows the composite SHG image registered with with B-mode ultrasound data obtained by stitching together three ultrasound echo fields. Figure 9(c) shows coefficient of alignment results from CBAA. Figure 9(d) and 9(e) shows eBSPL and integrated CA, respectively, superimposed on the SHG image. Arrows in (a) to (e) highlight a region that contains relatively high collagen alignment observed visually and as measured by all three quantitative techniques (CBAA, eBSPL, and iCA). The circles highlight a different region where the collagen alignment is relatively low, and the ultrasound echo signal coherence is relatively high (demonstrating that collagen alignment is consistent among the CBAA and QUS measures, but high echo signal coherence can occur for reasons other than collagen alignment). 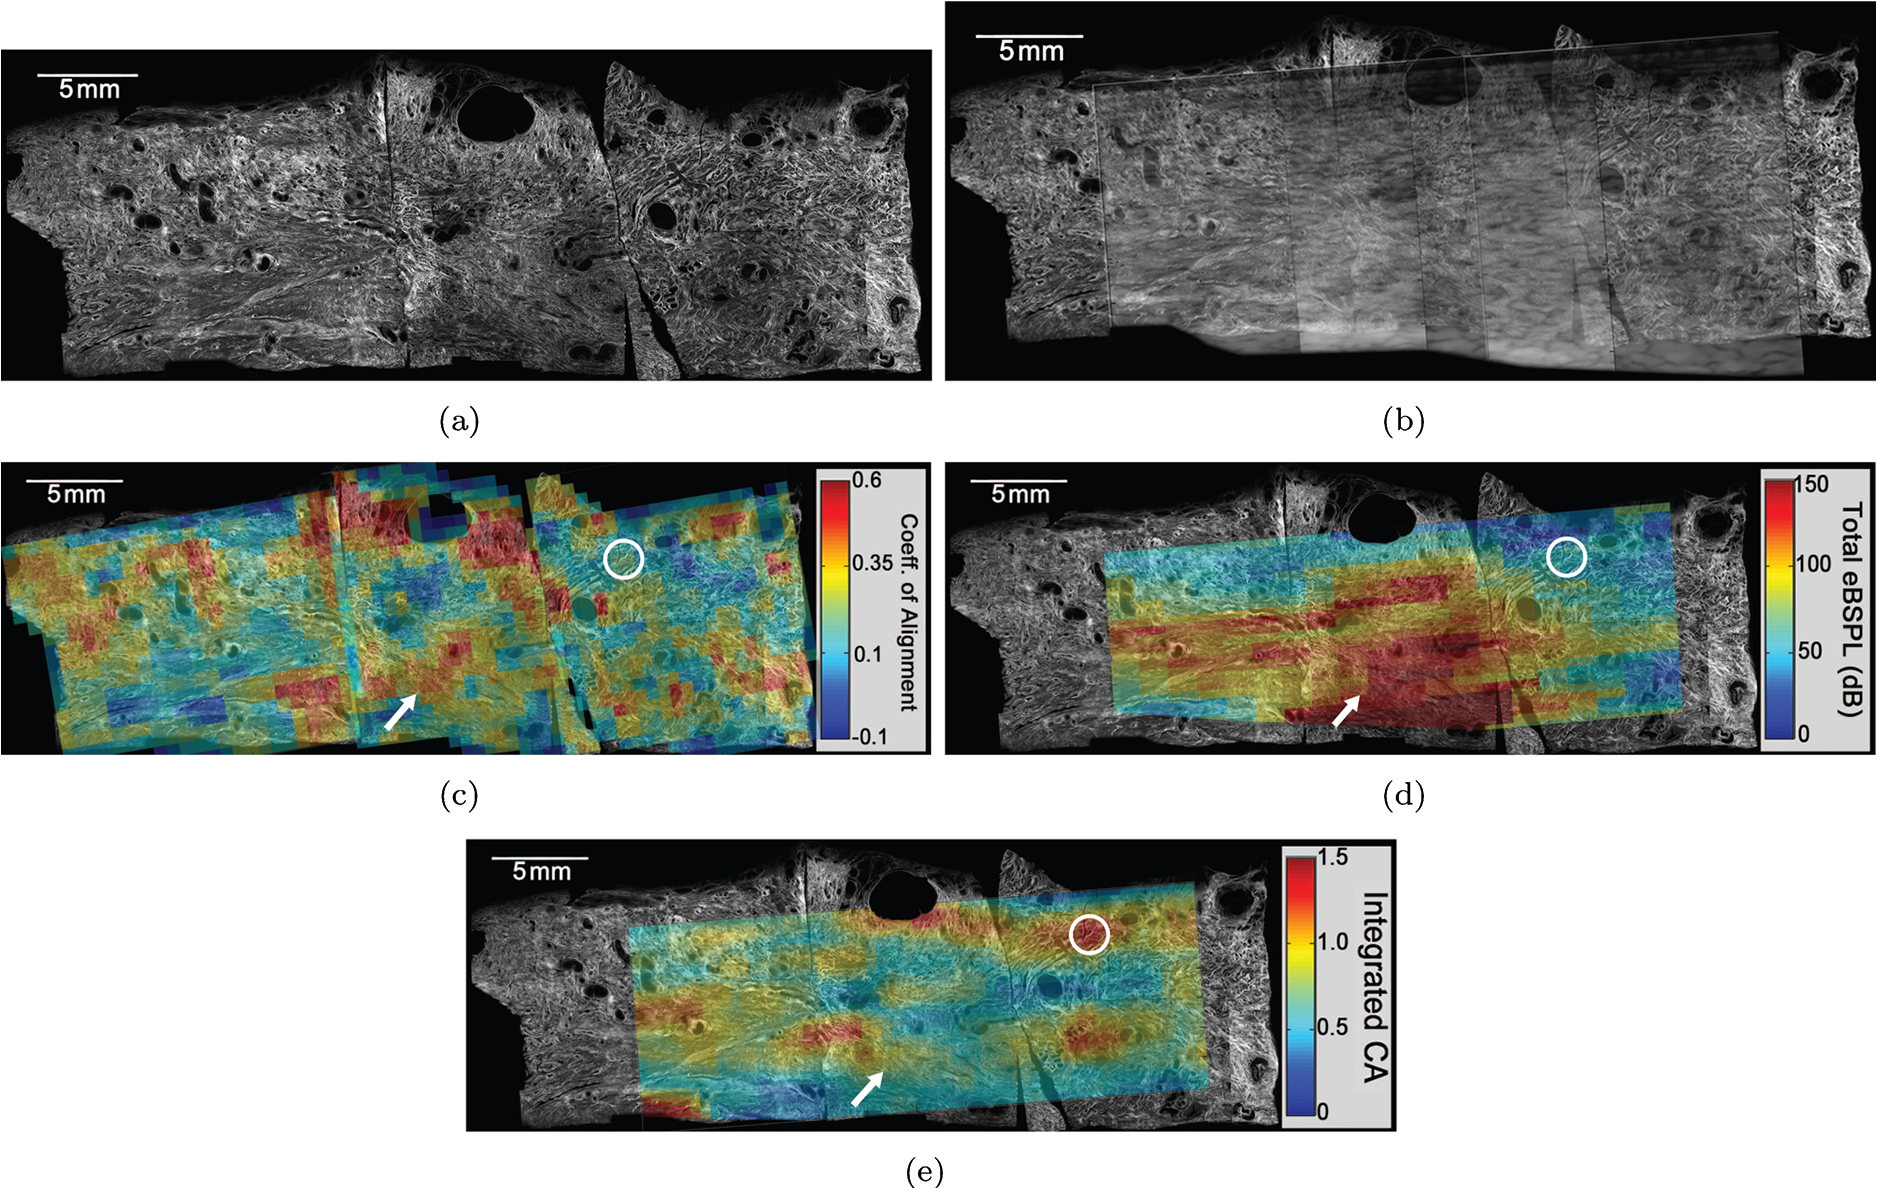 Figure 7 is a composite SHG image of a longitudinal cross-section of cervical tissue, assembled from about 370 subimage tiles. The region nearest the canal appears longitudinally aligned, consistent with that demonstrated in Fig. 6. Again, the apparent length of the fibers changes with increasing axial distance from the canal, indicating that the dominant collagen alignment in the central region of the cervix is circumferential. Near the external surface of the cervix, the presence of longitudinally oriented fibers is noted. However, as in the transverse image, it is difficult to draw firm conclusions about the collagen alignment near the external surface of the cervix because the circumferentially oriented fibers of the central region appear to be increasingly interwoven with longitudinally oriented fibers as the outer edge of the cervix is approached. The degree to which they are interwoven, and thus their specific alignment, will likely only be elucidated with 3-D image reconstruction, and that is one of the challenges we are currently addressing. In summary, these composite SHG images show evidence of layers of differing collagen alignment; near the canal, fibers appear short in the transverse image and long in the longitudinal image, suggesting that the prevailing alignment is along the canal. The alignment changes as axial distance from the canal increases and more circumferentially oriented fibers are present. General orientation changes again near the external surface, where the fibers appear more like those near the canal, suggesting prevailing alignment that is along the canal, although these fibers appear more integrated with the central circumferential fibers than do those near the canal. 3.3.Curvelet AnalysisFigure 5 is an example of curvelet-based alignment analysis (CBAA) for the three regions highlighted in Fig. 6. The top row shows detailed SHG image tiles of those areas, the second shows the respective curvelets transformation reconstructions, and the third the distribution of measured angles of aligned collagen. The mean and standard deviation, , of the measured angles from each region of interest were calculated. A strongly peaked distribution of angles indicates strong alignment, and a broad distribution weaker alignment. Only the standard deviation corresponded to the strength of alignment, and it was converted to coefficient of alignment using so that larger values correspond to strong alignment and smaller numbers correspond to lesser alignment.51,52Table 1 shows the mean angle of alignment, alignment angle standard deviation , and the coefficient of alignment for the three tiles from Fig. 5. Table 1Summary of CBAA results for three regions of interest from the specimen shown in Fig. 6 About 60 angles were included in each distribution to compute the mean, standard deviation, and coefficient of alignment.
CBAA results are consistent with initial visual inspection of Fig. 5(b). However, closer inspection is necessary to interpret fiber alignment detected in Fig. 5(a) and 5(c). This demonstrates the power of objective quantification of structural alignment with regard to its ability to provide insight into collagen microstructure beyond that of simple visual inspection. Critically, it also provides confidence in our ultrasound measurements, as described below. 3.4.Image Registration with Ultrasound DataFigure 8 shows the detailed process used to register SHG images with ultrasound images, our first step in registering SHG images with QUS data. Figure 8(a) is the composite SHG image (Fig. 7) shown at the appropriate spatial scale relative to the ultrasound data. The ultrasound B-mode image data obtained with the 18L6 transducer (capable of imaging the entire length of the cervix) is shown in Fig. 8(b). The registered and superimposed image fields [Fig. 8(c)] demonstrated good visual correlation of image features. To assess whether the presumed shrinkage due to the tissue fixing process for SHG affected our analysis, we utilized the “Trace Contour” feature in Adobe Photoshop to detect and highlight boundaries in the SHG image [Fig. 8(d)]. Figure 8(e) shows these identified contours on the B-mode image alone, confirming good correlation of the registered and superimposed fields and demonstrating that our registration method works well despite presumed tissue shrinkage. This success, particularly as evidenced in Fig. 8(e), provides confidence that this image registration method can be trusted for interpreting QUS data as they relate to the collagen microstructure seen in SHG images described below (in Fig. 9). Figure 9 is a registration of a composite SHG image with QUS data. Data for this image were acquired with the prototype intracavitary transducer. Importantly, this demonstrates that information obtained by stitching together data fields along the cervical canal is equivalent to that obtained with the transducer that images the entire length of the cervix, meaning our approach is feasible in vivo. The transducer was initially placed at the proximal end of the anterior cervix and translated distally to cover the entire length of the canal in steps of 8 mm (with a data field overlap of 40%), after which the individual RF echo data fields and the B-mode images were stitched together to form a composite image. Tissue sections were dissected and individually imaged with SHG as described above. Each of the 3 images shown here was assembled from about 450 tiles, and the SHG images of these segments combined to form the full longitudinal section shown in Fig. 9. Again, we used the step-by-step approach described above to register the SHG image with the B-mode ultrasound image, which simultaneously registered the QUS data (because it is from the same RF echo dataset). Figure 9(b) shows composite B-mode images overlaid with the composite SHG image. Registration of SHG images with B-mode images [Fig. 8(c) and 9(b)] indicates that B-mode image brightness [Fig. 8(b) and 9(b)] correlates (loosely) with collagen structure as elucidated by SHG imaging, although it is important to keep in mind that the relationship is complicated because it depends on a combination of factors such as collagen fiber size, density, and orientation to the acoustic beam. Quantitative measures of collagen structure provide clarification. For example, the arrow in Fig. 9(c) points to a region with high CBAA coefficient of alignment estimates. That area also demonstrates high eBSPL [Fig. 9(d)], consistent with high collagen alignment, and high integrated CA values [relatively high echo signal coherence; Fig. 9(e)]. Conversely, the circles on these images indicates a region where the CBAA and eBSPL [Fig. 9(c) and 9(d), respectively] suggest relatively low collagen alignment but relatively high echo signal coherence [Fig. 9(e)]. Close inspection of the SHG image shows that this region has a highly interwoven network of fibers with little overall alignment. This means that the high CA value is not due to a high degree of collagen alignment, but instead to another factor, such as a strong isolated backscatterer (see below). There are multiple similar examples on these images; the two described were randomly chosen in order to illustrate the power, and necessity, of multiscale analysis. 4.DiscussionThe cervical microstructural organization we found corroborates and clarifies previous reports. Specifically, we demonstrated three discrete layers of collagen, including a wide circumferential layer and two flanking longitudinal layers, although the layers were markedly more complex and overlapping than we expected based on previous studies.14–16 Compared to the innermost layer, the outer demonstrates marked intertwining with the central which, upon initial inspection, could lead to the assumption of two layers instead of three as was reported by one group.17 Importantly, we noted a tremendous amount of biological variability, which is valuable information for future, more detailed study. Our main motivation for using SHG was to corroborate our QUS quantification of collagen alignment. We were pleased to learn that not only is SHG ideal for this purpose, it adds significantly to our understanding of the cervix. We demonstrated that composite SHG images allow visual corroboration of QUS data (eBSPL and iCA), and that quantitative analysis of those images (with CBAA) provides greater insight and confidence. Further, registration of ultrasound data (B-mode and QUS) with SHG images (including CBAA) suggests that the optically evident aligned collagen microstructure can be detected acoustically and quantified despite the expected complexity of the relationship due to variability in collagen fiber size, density, organization, and orientation to ultrasound beam. Although these are preliminary investigations into the direct comparison of SHG image data and QUS data, the initial results are encouraging and inspiring of further study. More specifically, visual inspection of the composite SHG image [Fig. 9(a)] is generally consistent with objective collagen fiber alignment detected with CBAA [Fig. 9(c)]. CBAA involves two parameters (the aspect ratio of the edges being detected and the number of transform coefficients retained in the reconstruction) that affect the spatial scale of the analysis. The specific spatial scale used in our CBAA analysis is likely not the best match for comparisons with ultrasound backscatter, nor for the spatial frequency sensitivity of the eye, but we found it appropriate for a preliminary analysis. Optimizing the parameter selection for robust agreement with QUS analysis is an ongoing effort, but we are pleased that the results are largely consistent and demonstrate that SHG provides a step forward in understanding and interpreting ultrasound backscatter. Further, although this might initially seem inconsistent, high iCA values (from QUS) do not imply an expectation for high coefficient of alignment values (from CBAA) and high eBSPL values (from QUS). Ultrasound echo signal coherence (quantified by the iCA values) occurs in regions containing strong isolated scatterers, interfaces separating regions of differing collagen alignment or fiber density, or regions containing (quasi-)periodic structures. Therefore, regions of both high echo signal coherence (large iCA values) and high eBSPL values suggest areas that either contain an interface or contain quasi-periodic spacing in the collagen microstructure. But, high echo signal coherence can also be caused by strong isolated scattering sources that do not produce high eBSPL values. Our future plans include analysis of additional parameters29,53 such as acoustic attenuation, average backscatter coefficient, effective scatterer diameter, and shear wave speed.54 Estimates of these parameters would help to more fully understand cervical microstructure with noninvasive interrogation. Identifying areas of high iCA is critical because the presence of a coherent component in the echo signals violates assumptions used in modeling and will increase variance in these parameter estimates. Also, areas with high iCA and high eBSPL might alter shear wave propagation. These examples, which demonstrate how QUS data can be interpreted within the context of SHG image and CBAA, illustrate the power of our multiscale approach to evaluation of the cervical microstructure. That said, we have many challenges. One is the difficulty of 3-D imaging. Although this would add significantly to our understanding of the microstructure, currently, volume imaging would require numerous thin tissue sections and many hours of microscope time because penetration is limited to less than 100 μm. It is likely that the high collagen density of the cervix is causing dramatic scattering and therefore, a longer excitation wavelength55 or optical clearing techniques56 may increase penetration. We are currently addressing this issue by investigating the use of new clearing agents (such as scale),57 and second harmonic33 and third harmonic generation imaging in thick samples. In addition, methods for a more rigorous comparison of the microstructure seen in SHG images to that detected by QUS, including a summary measure of the collage microstructure, are under development. For example, we will compare the local () autocorrelation function for the SHG image (the collagen microstructure) with the inverse Fourier transform of the backscatter form factor function58 for a comparable region of interest. Complementing this effort, we are initiating statistical tests to confirm the robustness of our findings as we collect more data. Applying these approaches in a larger sample size should facilitate accurate interpretation of QUS data, which is critical given the large variance in results we expect due to underlying biological variability. This is, to our knowledge, the largest and most in-depth study of human cervical microstructure to date. It is also the first to corroborate microscopy-confirmed human cervical microstructure with a noninvasive method feasible for in vivo evaluation. We expect that detailed, precise investigations will finally illuminate the complex human cervical microstructure and ultimately facilitate confident noninvasive study during pregnancy. A comprehensive fundamental understanding of the cervix, together with the ability to detect and accurately interpret changes to its microstructure in vivo would direct study of associated molecular mechanisms of cervical change at specific timepoints during pregnancy. This, in turn, should facilitate research into novel, targeted preventive and therapeutic approaches to the significant global problem of preterm birth. 5.ConclusionsEvaluation of the human cervix with SHG microscopy and QUS allows detailed exploration of its complex microstructure. SHG microscopy both elucidates cervical microstructure and corroborates QUS measurements, which are critical steps toward eventual noninvasive study of the cervix. Ultimately, detection and appropriate interpretation of incremental microstructural changes during pregnancy should facilitate targeted exploration of associated molecular mechanisms. This is imperative if we are to finally conceive of novel therapies for preterm birth. AcknowledgmentsThe authors thank Abhinav Tallavajhula and Curtis Rueden for programming support, Ernie L. Madsen for construction of ultrasound phantoms, and Janelle Anderson for her assistance in the initial studies. This work was supported by NIH Grants R21HD061896 and R21HD063031 from the Eunice Kennedy Shriver National Institute of Child Health and Human Development. ReferencesS. Becket al.,
“The worldwide incidence of preterm birth: a systematic review of maternal mortality and morbidity,”
Bull. W. H. O., 88
(1), 31
–38
(2010). http://dx.doi.org/10.2471/BLT.08.062554 BWHOA6 Google Scholar
C. Y. Spong,
“Prediction and prevention of recurrent spontaneous preterm birth,”
Obstet. Gynecol., 110
(2 Pt. 1), 405
–415
(2007). http://dx.doi.org/10.1097/01.AOG.0000275287.08520.4a OBGNAS 0029-7844 Google Scholar
M. T. MellaV. Berghella,
“Prediction of preterm birth: cervical sonography,”
Semin. Perinatol., 33
(5), 317
–324
(2009). http://dx.doi.org/10.1053/j.semperi.2009.06.007 SEMPDU 0146-0005 Google Scholar
A. Goldberget al.,
“Cervical ripening,”
WebMD,
(2011). Google Scholar
M. G. Gravettet al.,
“Global report on preterm birth and stillbirth (2 of 7): discovery science,”
BMC Pregnancy Childbirth, 10
(Suppl. 1), S2
(2010). http://dx.doi.org/10.1186/1471-2393-10-S1-S2 BPCMBT 1471-2393 Google Scholar
R. Romero,
“Vaginal progesterone to reduce the rate of preterm birth and neonatal morbidity: a solution at last,”
Women’s Health, 7
(5), 501
–504
(2011). http://dx.doi.org/10.2217/whe.11.60 Google Scholar
R. Romero,
“Prevention of spontaneous preterm birth: the role of sonographic cervical length in identifying patients who may benefit from progesterone treatment,”
Ultrasound Obstet. Gynecol., 30
(5), 675
–686
(2007). http://dx.doi.org/10.1002/uog.5174 0960-7692 Google Scholar
R. Menonet al.,
“An overview of racial disparities in preterm birth rates: caused by infection or inflammatory response?,”
Acta Obstetr. Gynecol. Scand., 90
(12), 1325
–1331
(2011). http://dx.doi.org/10.1111/aog.2011.90.issue-12 AOGSAE 0001-6349 Google Scholar
L. J. MugliaM. Katz,
“The enigma of spontaneous preterm birth,”
N. Engl. J. Med., 362
(6), 529
–35
(2010). http://dx.doi.org/10.1056/NEJMra0904308 NEJMAG 0028-4793 Google Scholar
M. L. AkinsK. Luby-PhelpsM. Mahendroo,
“Second harmonic generation imaging as a potential tool for staging pregnancy and predicting preterm birth,”
J. Biomed. Opt., 15
(2), 026020
(2010). http://dx.doi.org/10.1117/1.3381184 JBOPFO 1083-3668 Google Scholar
V. N. Breeveld-Dwarkasinget al.,
“Regional differences in water content, collagen content, and collagen degradation in the cervix of nonpregnant cows,”
Biol. Reprod., 69
(5), 1600
–1607
(2003). http://dx.doi.org/10.1095/biolreprod.102.012443 BIREBV 0006-3363 Google Scholar
V. N. Breeveld-Dwarkasinget al.,
“Changes in water content, collagen degradation, collagen content and concentration on repeat biopsies of the cervix of pregnant cows,”
Biol. Reprod., 69
(5), 1608
–1614
(2003). http://dx.doi.org/10.1095/biolreprod.102.012534 BIREBV 0006-3363 Google Scholar
R. A. Wordet al.,
“Dynamics of cervical remodeling during pregnancy and parturition: mechanisms and current concepts,”
Semin. Reprod. Med., 25
(1), 69
–79
(2007). http://dx.doi.org/10.1055/s-2006-956777 SRMECJ 1526-8004 Google Scholar
V. DubrauszkyH. SchwalmM. Fleischer,
“Fibre system of connective tissue in childbearing age, menopause, and pregnancy,”
Archiv. Fur Gynakologie, 210
(3), 276
–292
(1971). http://dx.doi.org/10.1007/BF00667740 ARGYAJ 0003-9128 Google Scholar
D. HukinsR. Aspden,
“Composition and properties of connective tissues,”
Trends Biochem. Sci., 10
(7), 260
–264
(1985). http://dx.doi.org/10.1016/0968-0004(85)90077-5 TBSCDB 0167-7640 Google Scholar
R. M. Aspden,
“Collagen organization in the cervix and its relation to mechanical function,”
Collagen Rel. Res., 8
(2), 103
–112
(1988). http://dx.doi.org/10.1016/S0174-173X(88)80022-0 CREXDV 0174-173X Google Scholar
S. Weisset al.,
“Three-dimensional fiber architecture of the nonpregnant human uterus determined ex vivo using magnetic resonance diffusion tensor imaging,”
Anat. Rec. Part A, 288
(1), 84
–90
(2006). http://dx.doi.org/10.1002/(ISSN)1552-4892 1552-4884 Google Scholar
N. Uldbjerget al.,
“Isolation and characterization of dermatan sulphate proteoglycan from human uterine cervix,”
Biochem. J., 209 497
–503
(1983). BIJOAK 0264-6021 Google Scholar
D. Danforth,
“The morphology of the human cervix,”
Clin. Obstet. Gynecol., 26
(1), 7
–13
(1983). http://dx.doi.org/10.1097/00003081-198303000-00005 COGYAK 0009-9201 Google Scholar
D. Parry,
“The molecular and fibrillar structure of collagen and its relationship to the mechanical properties of connective tissue,”
Biophys. Chem., 29
(1–2), 195
–209
(1988). http://dx.doi.org/10.1016/0301-4622(88)87039-X BICIAZ 0301-4622 Google Scholar
H. P. Kleisslet al.,
“Collagen changes in human uterine cervix at parturition,”
Am. J. Obstet. Gynecol., 130
(7), 748
–753
(1978). AJOGAH 0002-9378 Google Scholar
P. Theobaldet al.,
“Histological and electron-microscopic examinations of collageneous connective tissue of the non-pregnant cervix, the pregnant cervix, and the pregnant prostaglandin-treated cervix,”
Arch. Gynecol., 231
(3), 241
–245
(1982). http://dx.doi.org/10.1007/BF02110124 ARCGDG 0170-9925 Google Scholar
T. RechbergerN. UldbjergH. Oxlund,
“Connective tissue changes in the cervix during normal-pregnancy and pregnancy complicated by cervical incompetence,”
Obstet. Gynecol., 71
(4), 563
–567
(1988). OBGNAS 0029-7844 Google Scholar
T. RechbergerS. R. AbramsonJ. F. Woessner,
“Onapristone and prostaglandin e(2) induction of delivery in the rat in rate pregnancy: a model for the analysis of cervical softening,”
Am. J. Obstet. Gynecol., 175
(3 Pt. 1), 719
–723
(1996). http://dx.doi.org/10.1053/ob.1996.v175.a74254 AJOGAH 0002-9378 Google Scholar
C. Readet al.,
“Cervical remodeling during pregnancy and parturition: molecular characterization of the softening phase in mice,”
Reproduction, 134 327
–340
(2007). http://dx.doi.org/10.1530/REP-07-0032 1470-1626 Google Scholar
B. TimmonsM. AkinsM. Mahendroo,
“Cervical remodeling during pregnancy and parturition,”
Trends Endocrinol. Metab., 21
(6), 353
–361
(2010). http://dx.doi.org/10.1016/j.tem.2010.01.011 TENME4 1043-2760 Google Scholar
M. Houseet al.,
“Magnetic resonance imaging of three-dimensional cervical anatomy in the second and third trimester,”
Eur. J. Obstet. Gynecol. Reprod. Biol., 144
(S1), S65
–S69
(2009). http://dx.doi.org/10.1016/j.ejogrb.2009.02.027 EOGRAL 0301-2115 Google Scholar
K. M. Myerset al.,
“Mechanical and biochemical properties of human cervical tissue,”
Acta Biomaterialia, 4
(1), 104
–116
(2008). http://dx.doi.org/10.1016/j.actbio.2007.04.009 ABCICB 1742-7061 Google Scholar
M. F. InsanaT. J. HallJ. L. Fishback,
“Identifying acoustic scattering sources in normal renal parenchyma from the anisotropy in acoustic properties,”
Ultrasound Med. Biol., 17
(6), 613
–626
(1991). http://dx.doi.org/10.1016/0301-5629(91)90032-R USMBA3 0301-5629 Google Scholar
J. H. Roseet al.,
“A proposed microscopic elastic wave theory for ultrasonic backscatter from myocardial tissue,”
J. Acoust. Soc. Am., 97
(1), 656
–668
(1995). http://dx.doi.org/10.1121/1.412288 JASMAN 0001-4966 Google Scholar
C. S. Hallet al.,
“The extracellular matrix is an important source of ultrasound backscatter from myocardium,”
J. Acoust. Soc. Am., 107
(1), 612
–619
(2000). http://dx.doi.org/10.1121/1.428327 JASMAN 0001-4966 Google Scholar
T. GarciaW. J. HornofM. F. Insana,
“On the ultrasonic properties of tendon,”
Ultrasound Med. Biol., 29
(12), 1787
–1797
(2003). http://dx.doi.org/10.1016/S0301-5629(03)01069-X USMBA3 0301-5629 Google Scholar
P. Campagnola,
“Second harmonic generation microscopy: applications to diseases diagnostics,”
Anal. Chem., 83
(9), 3224
–31
(2011). http://dx.doi.org/10.1021/ac1032325 ANCHAM 0003-2700 Google Scholar
R. LacombO. NadiarnykhP. Campagnola,
“Qualitative second harmonic generation imaging of the diseased state osteogenesis imperfecta: experiment and simulation,”
Biophys. J., 94
(11), 4504
–14
(2008). http://dx.doi.org/10.1529/biophysj.107.114405 BIOJAU 0006-3495 Google Scholar
V. CentonzeJ. White,
“Multiphoton excitation provides optical sections from deeper within scattering specimens than confocal imaging,”
Biophys. J., 75
(4), 2015
–24
(1998). http://dx.doi.org/10.1016/S0006-3495(98)77643-X BIOJAU 0006-3495 Google Scholar
J. Squirrellet al.,
“Long-term two-photon fluorescence imaging of mammalian embryos without compromising viability,”
Nat. Biotechnol., 17
(8), 763
–7
(1999). http://dx.doi.org/10.1038/11698 NABIF9 1087-0156 Google Scholar
P. Provenzanoet al.,
“Collagen reorganization at the tumor-stromal interface facilitates local invasion,”
BMC Med., 4
(1), 38
(2006). http://dx.doi.org/10.1186/1741-7015-4-38 BMMECZ 1741-7015 Google Scholar
O. Nadiarnykhet al.,
“Alterations of the extracellular matrix in ovarian cancer studied by second harmonic generation imaging microscopy,”
BMC Cancer, 10 94
(2010). http://dx.doi.org/10.1186/1471-2407-10-94 BCMACL 1471-2407 Google Scholar
N. D. KirkpatrickM. A. BrewerU. Utzinger,
“Endogenous optical biomarkers of ovarian cancer evaluated with multiphoton microscopy,”
Cancer Epidemiol. Biomarkers Prev., 16
(10), 2048
–57
(2007). http://dx.doi.org/10.1158/1055-9965.EPI-07-0009 CEBPE4 1055-9965 Google Scholar
R. Cicchiet al.,
“Scoring of collagen organization in healthy and diseased human dermis by multiphoton microscopy,”
J. Biophoton., 3
(1–2), 34
–43
(2010). http://dx.doi.org/10.1002/jbio.200910062 JBOIBX 1864-063X Google Scholar
A. Zoumiet al.,
“Imaging coronary artery microstructure using second-harmonic and two-photon fluorescence microscopy,”
Biophys. J., 87
(4), 2778
–86
(2004). http://dx.doi.org/10.1529/biophysj.104.042887 BIOJAU 0006-3495 Google Scholar
C. Raubet al.,
“Linking optics and mechanics in an in vivo model of airway fibrosis and epithelial injury,”
J. Biomed. Opt., 15
(1), 015004
(2010). http://dx.doi.org/10.1117/1.3322296 JBOPFO 1083-3668 Google Scholar
K. Myerset al.,
“Changes in the biochemical constituents and morphologic appearance of the human cervical stroma during pregnancy,”
Eur. J. Obstet. Gynecol. Reprod. Biol., 144
(S1), S82
–S89
(2009). http://dx.doi.org/10.1016/j.ejogrb.2009.02.008 EOGRAL 0301-2115 Google Scholar
S. Zhanget al.,
“A compact fiber-optic SHG scanning and endomicroscope and its application to visualize cervical remodeling during pregnancy,”
Proc. Natl. Acad. Sci. U. S. A., 109
(32), 12878
–12883
(2012). http://dx.doi.org/10.1073/pnas.1121495109 PNASA6 0027-8424 Google Scholar
D. L. Wokosinet al.,
“Optical workstation with concurrent, independent multiphoton imaging and experimental laser microbeam capabilities,”
Rev. Sci. Instrum., 74
(1), 193
–201
(2003). http://dx.doi.org/10.1063/1.1524716 RSINAK 0034-6748 Google Scholar
M. AbramoffP. MagelhaesS. Ram,
“Image processing with imageJ,”
Biophoton. Int., 11
(7), 36
–42
(2004). Google Scholar
S. PreibischS. SaalfeldP. Tomancak,
“Globally optimal stitching of tiled 3D microscopic image acquisitions,”
Bioinformatics, 25
(11), 1463
–1465
(2009). http://dx.doi.org/10.1093/bioinformatics/btp184 BOINFP 1367-4803 Google Scholar
K. D. Donohueet al.,
“Tissue classification with generalized spectrum parameters,”
Ultrasound Med. Biol., 27
(11), 1505
–1514
(2001). http://dx.doi.org/10.1016/S0301-5629(01)00468-9 USMBA3 0301-5629 Google Scholar
L. Huanget al.,
“Duct detection and wall spacing estimation in breast tissue,”
Ultrason. Imag., 22
(3), 137
–152
(2000). ULIMD4 0161-7346 Google Scholar
H. FeltovichK. NamT. J. Hall,
“Quantitative ultrasound assessment of cervical microstructure,”
Ultrason. Imag., 32
(3), 131
–142
(2010). ULIMD4 0161-7346 Google Scholar
E. CandesD. Donoho, Curvelets-A Surprisingly Effective Non-Adaptive Representation for Objects with Edges, Vanderbilt Univ. Press, Tennessee
(1999). Google Scholar
E. J. CandsF. Guo,
“New multiscale transforms, minimum total variation synthesis: applications to edge-preserving image reconstruction,”
Signal Process., 82
(11), 1519
–1543
(2002). http://dx.doi.org/10.1016/S0165-1684(02)00300-6 SPRODR 0165-1684 Google Scholar
M. F. InsanaT. J. Hall,
“Parametric ultrasound imaging from backscatter coefficient measurements: image formation and interpretation,”
Ultrason. Imag., 12
(4), 245
–267
(1990). http://dx.doi.org/10.1016/0161-7346(90)90002-F ULIMD4 0161-7346 Google Scholar
M. L. Palmeriet al.,
“Noninvasive evaluation of hepatic fibrosis using acoustic radiation force-based shear stiffness in patients with nonalcoholic fatty liver disease,”
J. Hepatol., 55
(3), 666
–672
(2011). JOHEEC 0168-8278 Google Scholar
D. Kobatet al.,
“In vivo deep tissue imaging with long wavelength multiphoton excitation,”
Proc. SPIE, 7569 75692R
(2010). http://dx.doi.org/10.1117/12.842292 PSISDG 0277-786X Google Scholar
N. Uldbjerget al.,
“Multiphoton fluorescence, second harmonic generation, and fluorescence lifetime imaging of whole cleared mouse organs,”
J. Biomed. Opt., 16
(10), 106009
(2011). http://dx.doi.org/10.1117/1.3641992 JBOPFO 1083-3668 Google Scholar
H. Hamaet al.,
“Scale: a chemical approach for fluorescence imaging and reconstruction of transparent mouse brain,”
Nat. Neurosci., 14 1481
–1488
(2011). http://dx.doi.org/10.1038/nn.2928 NANEFN 1097-6256 Google Scholar
M. F. Insanaet al.,
“Describing small-scale structure in random media using pulse-echo ultrasound,”
J. Acoust. Soc. Am., 87
(1), 179
–192
(1990). http://dx.doi.org/10.1121/1.399283 JASMAN 0001-4966 Google Scholar
|