|
|
|
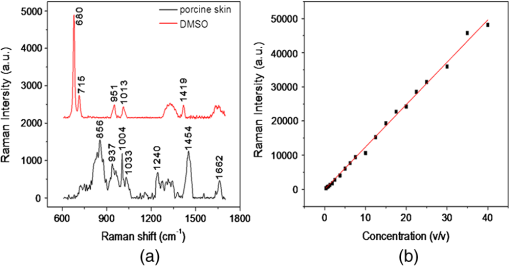
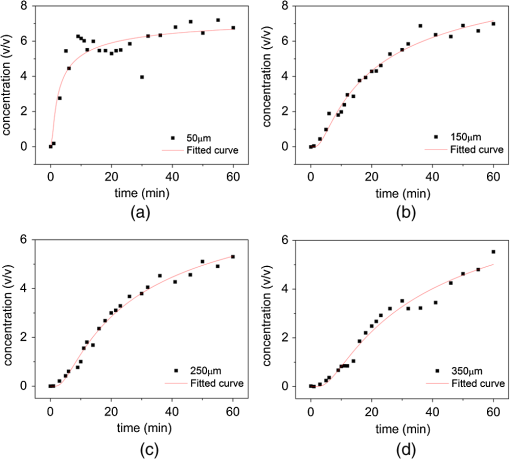
Applying optical techniques in the medical field is becoming more and more important.1 However, most biological tissues scatter light strongly, which limits the penetrating depth of light in the tissues. The difference of refractive index between the scattering particles and the ground substances of tissue is the major reason to give the biological tissues a strong optical scattering effect.2 The optical property of biological tissues can be controlled by using appropriate chemical agents, called optical clearing agents (OCAs). Glycerol, glucose, propylene glycol, dimethyl sulphoxide (DMSO), and their combinations are frequently used as OCAs.3 OCAs have been successfully employed in many optical techniques to improve image and spectroscopy quality at greater depths in tissue.4,5 Although numerous studies have revealed that application of OCA to highly scattering biological tissue could cause optical clearing effect, the understanding of clearing mechanisms is still relatively poor,6,7 especially diffusion in multilayered biological tissue, such as skin. The percutaneous absorption dynamics had been studied by Fourier transform infrared spectroscopy (FTIR), optical coherence tomography, and second harmonic generation.8–10 Unfortunately, these methods were not able to resolve the problem on diffusion coefficient change. In this article, we try to use confocal micro-Raman spectroscopy to solve this problem. Raman spectroscopy is a potential nondestructive measurement technique with many advantages, including high sensitivity, high spatial resolution, resistance to autofluorescence and photobleaching, relative insensitivity to water, simple to perform, and fully automated.11,12 Based on inelastic light scattering, Raman spectroscopy measures molecular vibrations and provides fingerprint signatures for various biomolecules in tissues, such as collagen, blood, proteins, lipids, and nucleic acids.13,14 Meanwhile, Raman spectra usually show narrow bands associated with the analyte, and, in theory, the intensity of an analyte band is linearly proportional to the analyte concentration.15 It makes Raman quantification promising. The Raman system used in this study has been described previously.11 In this study, the power of the laser beam focalized on the sample is measured and maintained at 50 mW. The spectral range is from 600 to , and collect with 2 s exposure time. All the data are collected under the same conditions. DMSO is purchased from the Tianjin Damao Chemical Reagent Factory (China) with a purity of 99.90%. Concentrations of DMSO solutions ranging from 0.31% to 40% () are obtained by dilution. Fresh porcine skin obtained from a local slaughterhouse is cleaned with doubly deionized water. The tissue samples are stored at 4°C for no longer than 12 h before measure. For micro-Raman spectroscopy analysis, each sample is cut into pieces. The role of the filter paper is to prevent the solution from flowing down along the lateral edge of the porcine skin and make the liquid permeate uniformly. The filter paper and the skin sample are the same size. In this study, we measure the concentrations of DMSO at the profile of the porcine skin. For this purpose, instrument is connected with a Leica microscope objective () of magnification by the 90 deg adaptor. The measurement is set into two groups. First, record the progress of the changes of DMSO concentration with time at 50, 150, 250, and 350 μm under the surface. Set the focal position at as (0, 0, 0). Raman spectra are taken after dropping DMSO on the filter paper. Second, longitudinal Raman scan ( scan) of the porcine skin’s profile with a step length of 100 μm between 50 and 850 μm, at 5, 10, 30, and 50 min, respectively. To reduce system error, DMSO (40%) is used as the external standard. And the Raman spectrum is baseline corrected by the software R 2.8.1 which is provided by Renishaw. Using Nonlinear Curve Fit of Origin 8.5 (OriginLab Corporation, Northampton, Massachusetts) to fit the data which is obtained in our experiment. Before we analyze the diffusion coefficient, we obtain the Raman spectra of porcine skin and DMSO [Fig. 1(a)]. The bond of carbon and sulphur (c–s) stretch at is chosen to reliably extract the DMSO concentration from the observed Raman signal.16 Then the Raman spectra of different concentrations of DMSO are measured (total number of sample concentrations, 20). The calibration curves of DMSO solution are shown in Fig. 1(b). It has a correlation coefficient () of 0.9983. and denote the Raman intensity and the concentration of DMSO, respectively. These calibration curves can be used to calculate the concentration of DMSO. Fig. 1(a) Raman spectra of 2.5% DMSO (top) and porcine skin (bottom). (b) Relative Raman intensity at for increasing volume fraction of DMSO in water.  In the following, we analyze the changes of the diffusion coefficient in the process of optical clearing. For different depths below the porcine skin surface, 50, 150, 250, and 350 μm, respectively, we obtained the variation of DMSO concentration which is shown in Fig. 2. From Fig. 2, we find that the diffusion curves become more smoother, tending to a straight line as the depth increases, which is consistent with the theoretical model in previous study.17 Fig. 2The changes of DMSO concentration with time at different depths of (a) 50 μm, (b) 150 μm, (c) 250 μm, and (d) 350 μm.  In order to detect the changes of DMSO diffusion coefficient responding to the depths of the skin, we use the passive diffusion model in this study. As to the fibrous structures such as human skin dermis and muscle, it is quite reasonable to assume that the dynamics of fluid diffusion within this tissue is well described by free diffusion. To analyze concentration profiles under vitro condition, according to Fick’s second law of diffusion, we have17,18 where is the transport diffusion coefficient describing the mass transport of the OCA through the tissue; is the time after topical application of the OCA; is the depth in the tissue. A solution of Eq. (1) for a semi-infinite medium (tissue samples) is where erfc is the complementary error function and is the maximum OCA concentration that reached in tissue at saturation condition. In this letter, we use instead of the saturation concentration.Using the model mentioned above, according to the custom curve fitting in software Origin 8.0 and the calibration curves of DMSO, we obtain the fitting parameters, which are shown in Table 1. From Table 1, we find that the correlation coefficients () of the fitted curves are all above 97%, except for the one at 50 μm with 82.40%, demonstrating that the formula has made considerable fitting results for the data. We also realize that to 12.01%, which is much lower than 40%. The reasons may lie in two aspects, one is the dilution of the DMSO concentration due to the tissue dehydration, and the other is the barrier function of the corneum.7 The fluctuant variation of may be attributed to the dehydration of the tissue micro-environment, while the increasing trend of diffusion coefficient () may be relevant to the hierarchical structure of the skin.19 Table 1Calculated results in different depths by passive diffusion model.
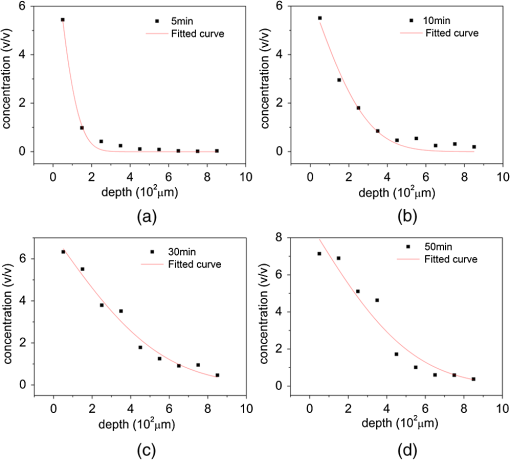
Figure 3 shows the changes of DMSO concentration with the depth at 5, 10, 15, 30, and 50 min after DMSO application onto the surface of porcine skin. Using the passive diffusion model and Origin 8.0, we obtained Table 2. From Fig. 3 and Table 2, we find that the longitudinal diffusion curves become smooth as the treatment time increased, which is agreed with the result of theoretical model.17 All the correlation coefficients are above 93.81%, which shows a good fitting between the fitting formula and the data. (6.43% to 9.04%) is also much less than 40%. The value of diffusion coefficient () shows a trend from ascent to descent with respect to time and reaches maximum at 30 min. It might be caused by the dehydration of tissue constituents and/or the structural modification of collagen.20 Fig. 3The changes of DMSO concentration with the depth at different times of 5 min (a), 10 min (b), 30 min (c), and 50 min (d) after application of DMSO onto the surface of porcine skin.  Table 2Calculated results in different time by passive diffusion model.
In conclusion, confocal micro-Raman spectroscopy provides a highly sensitive way to characterize DMSO diffusion coefficient in porcine skin. Our results confirm the following: (1) The diffusion coefficients of DMSO in porcine skin are varying at different depths of skin (different layer in porcine skin). (2) The diffusion coefficients of DMSO in porcine skin changed with the treatment time, and it shows a time-related trend from ascent to descent and reaches maximum at 30 min. (3) The maximum DMSO concentration () reached in tissue is about 10%, much lower than 40%, because of the tissue dehydration and the barrier function of the corneum. The current results show that Raman spectroscopy has the ability to quantitatively monitor the process of optical clearing. The experimental results also verify the theoretical model.17 It demonstrates that Raman spectroscopy techniques may have great potential in further studies of the optical clearing process. ReferencesV. V. Tuchin,
“Optical immersion as a new tool to control optical properties of tissues and blood,”
Laser Phys., 15
(8), 1109
–1136
(2005). LAPHEJ 1054-660X Google Scholar
X. Wenet al.,
“In vivo skin optical clearing by glycerol solutions: mechanism,”
J. Biophoton., 3
(1–2), 44
–52
(2010). http://dx.doi.org/10.1002/jbio.200910080 JBOIBX 1864-063X Google Scholar
E. A. Geninaet al.,
“Optical clearing of the eye sclera in vivo caused by glucose,”
Quantum Electron., 36
(12), 1119
–1124
(2006). http://dx.doi.org/10.1070/QE2006v036n12ABEH013337 QUELEZ 1063-7818 Google Scholar
R. LaCombet al.,
“Quantitative second harmonic generation imaging and modeling of the optical clearing mechanism in striated muscle and tendon,”
J. Biomed. Opt., 13
(2), 021109
(2008). http://dx.doi.org/10.1117/1.2907207 JBOPFO 1083-3668 Google Scholar
V. V. TuchinX. XuR. K. Wang,
“Dynamic optical coherence tomography in studies of optical clearing, sedimentation, and aggregation of immersed blood,”
Appl. Opt., 41
(1), 258
–271
(2002). http://dx.doi.org/10.1364/AO.41.000258 APOPAI 0003-6935 Google Scholar
A. N. Bashkatovet al.,
“In vivo investigation of human skin optical clearing and blood microcirculation under the action of glucose solution,”
Asian J. Phys., 15
(1), 1
–14
(2006). Google Scholar
C. G. Rylanderet al.,
“Dehydration mechanism of optical clearing in tissue,”
J. Biomed. Opt., 11
(4), 041117
(2006). http://dx.doi.org/10.1117/1.2343208 JBOPFO 1083-3668 Google Scholar
J. Jianget al.,
“Penetration kinetics of dimethyl sulphoxide and glycerol in dynamic optical clearing of porcine skin tissue in vitro studied by Fourier transform infrared spectroscopic imaging,”
J. Biomed. Opt., 13
(2), 021105
(2008). http://dx.doi.org/10.1117/1.2899153 JBOPFO 1083-3668 Google Scholar
X. Guoet al.,
“In vivo quantification of propylene glycol, glucose and glycerol diffusion in human skin with optical coherence tomography,”
Laser Phys., 20
(9), 1849
–1855
(2010). http://dx.doi.org/10.1134/S1054660X10170032 LAPHEJ 1054-660X Google Scholar
M. Zimmerleyet al.,
“Following dimethyl sulfoxide skin optical clearing dynamics with quantitative nonlinear multimodal microscopy,”
Appl. Opt., 48
(10), D79
–D87
(2009). http://dx.doi.org/10.1364/AO.48.000D79 APOPAI 0003-6935 Google Scholar
Z. F. Zhuanget al.,
“Study of molecule variations in renal tumor based on confocal micro-Raman spectroscopy,”
J. Biomed. Opt., 18
(3), 031103
(2012). http://dx.doi.org/10.1117/1.JBO.18.3.031103 Google Scholar
P. J. CaspersG. W. LucassenG. J. Puppels,
“Combined in vivo confocal Raman spectroscopy and confocal microscopy of human skin,”
Biophys. J., 85
(1), 572
–580
(2003). http://dx.doi.org/10.1016/S0006-3495(03)74501-9 BIOJAU 0006-3495 Google Scholar
M. EgawaT. Kajikawa,
“Changes in the depth profile of water in the stratum corneum treated with water,”
Skin Res. Technol., 15
(2), 242
–249
(2009). http://dx.doi.org/10.1111/j.1600-0846.2009.00362.x Google Scholar
H. P. Buschmanet al.,
“In vivo determination of the molecular composition of artery wall by intravascular Raman spectroscopy,”
Anal. Chem., 72 3771
–163775
(2000). http://dx.doi.org/10.1021/ac000298b ANCHAM 0003-2700 Google Scholar
P. J. AarnoutseJ. A. Westerhuis,
“Quantitative Raman reaction monitoring using the solvent as internal standard,”
Anal. Chem., 77
(5), 1228
–1236
(2005). http://dx.doi.org/10.1021/ac0401523 ANCHAM 0003-2700 Google Scholar
P. J. Casperset al.,
“Monitoring the penetration enhancer dimethyl sulfoxide in human stratum corneum in vivo by confocal Raman spectroscopy,”
Pharm. Res., 19
(10), 1577
–1580
(2002). http://dx.doi.org/10.1023/A:1020481305420 PHREEB 0724-8741 Google Scholar
F. ZhouR. K. Wang,
“Theoretical model on optical clearing of biological tissue with semipermeable chemical agents,”
Proc. SPIE, 5330 215
–232
(2004). http://dx.doi.org/10.1117/12.531499 PSISDG 0277-786X Google Scholar
A. N. Bashkatovet al.,
“Monte Carlo study of skin optical clearing to enhance light penetration in the tissue,”
Proc. SPIE, 6436 64360Z
(2007). http://dx.doi.org/10.1117/12.716874 Google Scholar
V. V. Tuchin,
“Coherent optical techniques for the analysis of tissue structure and dynamics,”
J. Biomed. Opt., 4
(1), 106
–124
(1999). http://dx.doi.org/10.1117/1.429926 JBOPFO 1083-3668 Google Scholar
S. Zhuoet al.,
“Quantitatively linking collagen alteration and epithelial tumor progression by second harmonic generation microscopy,”
Appl. Phys. Lett., 96
(21), 213704
(2010). http://dx.doi.org/10.1063/1.3441337 Google Scholar
|

