
|
|
1.IntroductionFörster resonance energy transfer (FRET) is becoming widely utilized to measure the proximity of molecules, structural changes within macromolecules, as a signal of biochemical events and as a sensor of local conditions.1–6 In FRET, one fluorophore, known as the “donor,” after being excited by an initial photon of light (usually supplied by a laser or a filtered arc lamp), spontaneously transfers its energy to another molecule, the “acceptor,” by a nonradiative dipole-dipole interaction.7 The probability of energy being transferred in this way is related to both the spectral characteristics of the fluorophores involved and the distance between them, making the technique useful for proximity and structural measurements. FRET is normally quantified by the efficiency of transfer, , which is the proportion of light absorbed by the donor that is transferred in this nonradiative manner to the acceptor. While can be determined by measurements of the fluorescence lifetime of the donor fluorophore8–10 or of the polarization of light emitted from the sample,11,12 the most commonly used techniques depend upon accurate measurements of the intensities of light emitted by one or both of the donor and acceptor fluorophores. A requirement for FRET is that the emission spectrum of the donor overlaps with the excitation spectrum of the acceptor, with a greater degree of overlap yielding larger transfer efficiencies. As a consequence, the emission spectrum of the donor usually overlaps that of the acceptor, making it difficult to determine if light measured in the acceptor emission channel has originated from the donor or the acceptor. The appearance of donor fluorescence in the acceptor channel is often termed “donor spectral bleedthrough.” A second problem is that the excitation wavelengths of the donor and acceptor fluorophores also generally overlap, making it difficult to excite the donor fluorophores without also directly exciting some of the acceptors, an issue known as either acceptor spectral bleedthrough or cross excitation. In practice these issues are overcome in many different ways. One is to use donor-only samples at the same concentration as the doubly labelled sample (either by creating a second reference sample or by photo bleaching the acceptor fluorophores in the doubly labelled sample) and to monitor the change in intensity in the donor emission channel that is not compromised by acceptor emission.13–15 Acceptor photo bleaching is destructive meaning that no further measurements can be made on the sample, and often it is difficult to bleach the acceptor without also influencing the donor fluorophores.16 An alternative is to use post-processing to remove bleedthrough and cross excitation through the use of a number of reference images determined for donor only, acceptor only and doubly labelled samples at different excitation and emission wavelengths (sensitized emission).17–19 One possible way to circumvent the issue of donor spectral bleedthrough is to take emission measurements at multiple wavelengths so as to recreate the complete emission spectrum of the sample. Once this is done, it can be divided into contributions from the donor and acceptor based upon the spectra of a donor only and acceptor only sample, thus separating donor spectral bleedthrough from acceptor emission. Notably, it is still not possible to directly distinguish between emission from the acceptor due to FRET and due to cross excitation as these signals directly overlap. While such spectral measurements have previously been possible using spectrofluorometers, they have recently become practical for microscopy with the development of spectral detectors that are now common on commercial microscopes, although the longer data collection times required may limit the use in live cell studies of fast cellular interactions. The concept of unmixing fluorescence spectra to gain FRET efficiencies was described by Clegg,20 and more recently it has been used to identify FRET from the relative ratio of the donor emission peak to that of the acceptor emission peak in differing samples.21,22 Spectral unmixing has also been used indirectly in the quantification of FRET as a way to separate spectrally overlapping donor and acceptor signals for use in acceptor photo bleaching or sensitized emission measurements of the transfer efficiency.23–25 Five recent studies26–30 have shown how spectral unmixing of the emission spectrum can be used to overcome donor spectral bleedthrough when quantifying the FRET efficiency. This is an ideal way to remove donor spectral bleed through in intensity measurements; however, all these approaches require cross excitation to be corrected in some additional manner. Just as donor bleedthrough can be removed through unmixing of emission spectra, cross excitation can also be removed, in principle, by unmixing of excitation spectra. That is, the contribution of the donor to emission at a given wavelength can be distinguished from that of the acceptor by examining at what excitation wavelengths the emission arises. Although this approach has previously been suggested as a way to separate spectrally overlapping fluorophores,31 it is less common due to the lack of availability of multiple excitation wavelengths. While a first step in this direction has been made through the use of three intensity values to quantify FRET in a so called excitation-emission matrix,32 to the best of our knowledge, the complete unmixing of the combined excitation and emission spectra has not been used to assist in the quantification of FRET. In this manuscript we show that unmixing of the combined excitation/emission spectra (ExEm unmixing) can be used to accurately quantify FRET efficiency without the need for additional corrections for donor spectral bleedthrough or cross excitation. In order to develop and explain the method, we first contrast it to the calculation of FRET obtained by unmixing of only emission spectra (Em unmixing), presenting our own slightly improved approach that includes a correction for cross excitation. We are able to show that the ExEm unmixing approach is accurate with as few as two excitation wavelengths and is therefore applicable to data collected on any microscope or fluorometer with a spectral detector. Both our Em and ExEm methods can be equally well applied to microscope images on a pixel-by-pixel basis, to average intensities of regions of interest in images or to individual spectra obtained from fluorometer measurements. Furthermore, we have developed simple ImageJ plugins to make both these methods easy to use. As the ExEm method circumvents both the problems of donor spectral bleedthrough and cross excitation without the need for additional corrections, we believe it is a particularly appealing approach for measuring FRET efficiency that overcomes many of the inherent issues involved in intensity-based measurements. In addition, the ExEm method is readily applicable to cases with more than two types of fluorophores as it adds an extra dimension in which to separate the overlapping spectral signatures that can be difficult to distinguish from a single emission spectrum. 2.TheoryBefore describing the details of the method, we start by graphically illustrating the principles of the spectral unmixing approaches using a cartoon of recreated data. Figure 1 illustrates the issues of donor spectral bleedthrough and cross excitation. Here the emission spectrum for a sample undergoing FRET is shown in black. This total fluorescence is a combination of emission from the donor (blue), emission from acceptors that were directly excited by the illuminating light (purple) and emission from the acceptor due to the presence of FRET (red). If the emission of the acceptor is being monitored in only one channel (e.g., at around 550 nm in the example) then the FRET signal (red) will be compromised by the presence of donor spectral bleedthrough and directly excited acceptor emission. Collecting the entire emission spectrum as done in the figure allows for the total emission to be decomposed into components originating from the donor and acceptor as done in Em unmixing. However, with only the emission spectra, directly excited acceptors have to be discriminated from those emitting due to FRET in a different way. Fig. 1Illustration of how spectral unmixing of emission spectra (Em unmixing) can be used to remove donor spectral bleedthrough. In a normal emission spectrum for a sample undergoing FRET, the total emission (black) is composed of donor emission (blue), emission from acceptors that were directly excited (purple) and emission from acceptors due to FRET (red). Monitoring emission at only one wavelength means that these three components cannot be distinguished. If the complete spectrum is recorded, the donor emission can be unmixed as it is spectrally distinct from the acceptor emission, but directly excited acceptors have to be accounted for in a different way.  In Fig. 2, we show how unmixing both the excitation and emission spectra (ExEm unmixing) can circumvent both donor spectral bleedthrough and cross excitation. In Fig. 2(a), we show the emission spectra of a sample undergoing FRET obtained at a number of excitation wavelengths, and again, the total emission includes light originating from both the donor and acceptor fluorophores. However, the addition of the excitation dimension means that emission from the donor, emission from directly excited acceptors, and emission from acceptors due to FRET do not coincide. Thus simple unmixing of the spectra can be used to directly determine the FRET signal, and thus FRET efficiency can be calculated without the need for additional corrections as has previously been required. Fig. 2Illustration of how simultaneous unmixing of excitation and emission spectra (ExEm unmixing) can be used to remove both donor spectral bleedthrough and cross excitation. The total excitation/emission spectrum for a sample undergoing FRET (a), is composed of donor emission (b), emission from acceptors that were directly excited (c) and emission from acceptors due to FRET (d). As none of these peaks directly overlap they can be unmixed from one another.  2.1.FRET by Em Spectral UnmixingAlthough the focus of this manuscript is simultaneous unmixing of both excitation and emission spectra, we start by introducing the simpler unmixing of emission spectra. This method requires the collection of five different spectra as listed below and shown schematically in Fig. 3, as well as background spectra (collected from background regions of each image or spectra taken on blank samples) for background correction. To keep the naming convention consistent throughout this manuscript, refers to a spectrum (i.e., fluorescence intensity at a number of different wavelengths) rather than a single intensity value, while refers to the intensity in a single wavelength channel, in this case the channel with maximum intensity. The superscripts describe the samples, for a donor only sample, for an acceptor only sample and DA for a sample containing both donor and acceptor fluorophores (the FRET sample). The subscripts refer to the wavelength of excitation light used to obtain the spectra, which will be designed to either excite the donor fluorophores , or acceptor fluorophores .
The spectra should all be collected using the same instrument settings (i.e., laser power, detection wavelengths, etc). For this reason, the reference spectra should ideally be collected at the same time as collecting the FRET data. Note that the two acceptor only spectra ( and ) should be taken on the same sample, as should the two double-labelled spectra ( and ). The process of calculating the FRET efficiency can then be broken into the following steps as shown in Fig. 3.
2.2.FRET by ExEm Spectral UnmixingThe ExEm method essentially reduces to the Em method when only two excitation wavelengths chosen as the donor and acceptor excitation wavelengths are used. However, the ExEm approach is simpler (even when only two excitation wavelengths are employed) as no cross-excitation correction is required. Four spectra are required for this method, with the fluorescence intensity recorded at a number of excitation and emission wavelengths. The subscript denoting the excitation wavelength is dropped in the following equations as each spectrum includes multiple excitation wavelengths.
FRET is then calculated using the following procedure illustrated in Fig. 4:
2.3.Unmixing AlgorithmThe removal of background spectra, the determination of the relative acceptor concentrations in the acceptor only and FRET samples, as well as the separation of the corrected FRET spectrum into contributions from donor and acceptor fluorescence, requires the unmixing of a complex spectrum into contributions from two or more reference spectra. Techniques for doing this are now commonly implemented in microscope software, but it can be done simply using standard linear algebra. Using the example in Eq. (6) with no background unmixing, we can set as the difference between the sum of the reference spectra and the FRET spectrum: Now the task is to find the values of and that minimize by minimizing the value of defined as: This can be done in many ways using standard matrix techniques. Here we minimize by finding its derivative, setting it equal to zero and solving the resulting equations using Gauss-Jordan elimination for both the Em and ExEm methods. 3.Experimental MethodsHuman embryonic kidney (HEK293FT) cells were maintained at 37°C in 5% and complete media (Dulbecco’s modified Eagle’s medium (DMEM) containing glutamine, penicillin and streptomycin (Gibco) supplemented with 10% foetal calf serum (FCS) and Geneticin (Gibco). Transient transfections were carried out 24 h after cell seeding using Genejuice (Novagen) according to the manufacturer’s instructions in six-well plate format (0.3 μg cDNA/well). Experiments were performed 48 h post-transfection. Transfected HEK293FT cells were fixed with 4% (weight/volume) paraformaldehyde/5% (weight/volume) sucrose for imaging on a Nikon A1 laser scanning confocal microscope using a Nikon PlanApo VC NA 1.4 oil-immersion objective lens. The samples were illuminated with either a 405 or 488 nm solid-state laser to excite the cerulean (donor) and venus (acceptor) proteins, respectively. Images were taken in spectral mode, with data separated into 24 wavelength channels at 10 nm intervals between 420 and 660 nm. For measurement on the spectrofluorometer, cells were suspended in phenol red-free DMEM buffer, placed in a 1 cm pathlength cuvette and emission spectra obtained on a Varian Cary Eclipse Spectrofluorometer from intensities recorded at 56 different emission wavelengths between 430 and 650 nm for each of 44 different excitation wavelengths between 380 and 552 nm. 4.ResultsThe ExEm unmixing method described here was tested by determining the FRET efficiencies for five well-characterized FRET standards for which the FRET efficiency has previously been determined using a number of techniques. Three of the FRET standards involve cerulean and venus fluorescent proteins joined by linkers of 5, 17, or 32 amino acids termed C5V, C17V, and C32V, respectively.34 The last two involve either two cerulean proteins joined to one venus (CVC) or two venus joined to one cerulean (VCV).35 In addition to the FRET standards expected to display FRET values greater than 0.3, we include a non-fretting sample consisting of a mixture of cells expressing either Cerulean or Venus cDNA. In this sample, the donor and acceptor are far from each other (in separate cells), making FRET extremely unlikely. However, light collected from the sample will contain emission from both donor and acceptor. Thus analyzing the emitted light provides a good test that the unmixing procedure can separate the donor and acceptor fluorescence and find no sensitized emission. When using the fluorometer, the two cell samples were mixed in a sample cuvette so that the recorded spectrum included emission from both cell samples. For the microscope data, pairs of ROIs (one of a cell expressing Cerulean and one of a cell expressing Venus) are combined. Each of these constructs was expressed in HEK293FT cells, and the FRET efficiency was determined using each of the methods described here as summarized in Table 1 and described in more detail below. Table 1FRET efficiencies ±standard error in the mean determined for each of the methods described here and the values reported in the literature by Koushik et al.34 and Chen et al.35 Numbers in brackets refer to the number of independent cells used to obtain the average FRET efficiency. Standard errors are not given for the fluorometer data as these are obtained from only one set of spectra for each situation.
4.1.FRET from ExEm Spectral Unmixing of Fluorometer DataExamples of the ExEm spectra obtained on the fluorometer are shown in Fig. 5, including the sensitized emission spectrum obtained from convoluting the donor and acceptor spectra as described in Eq. (10). The spectra obtained for the “Mix” sample, which included cells expressing either cDNA for cerulean only or venus only mixed in the sample cuvette, shows the donor and acceptor peaks, but the third sensitized emission peak is not present, indicating that no FRET is taking place. In contrast, each of the C5V, C17V, VCV, and CVC samples clearly show three peaks corresponding to emission directly from the donor, directly excited acceptor and sensitized emission. As described in the introduction, in contrast with Em emission spectra in which the sensitized emission and directly excited acceptor emission overlap, in the ExEm case a new third peak appears when FRET is taking place making the presence of FRET unambiguous. The relative intensity of the donor and sensitized emission peaks can be used to obtain the FRET efficiencies, which are reported in Table 1. These data also show excellent agreement with reported values indicating the feasibility of using the ExEm unmixing approach for quantifying FRET efficiencies. Fig. 5Example spectra from ExEm spectral unmixing of data collected on a spectrofluorometer. ExEm spectra are shown for (a) cerulean only; (b) venus only; (c) the sensitized emission spectrum obtained from convoluting the donor only and acceptor only spectra; (d) a mixture of cells expressing either venus or cerulean only; (e) C5V; (f) C17V; and (g) VCV and (h) CVC. Contours are shown at intensity levels of 1, 2, 4, 6, 8, 12, 16, 24, 32, 48 and 64. 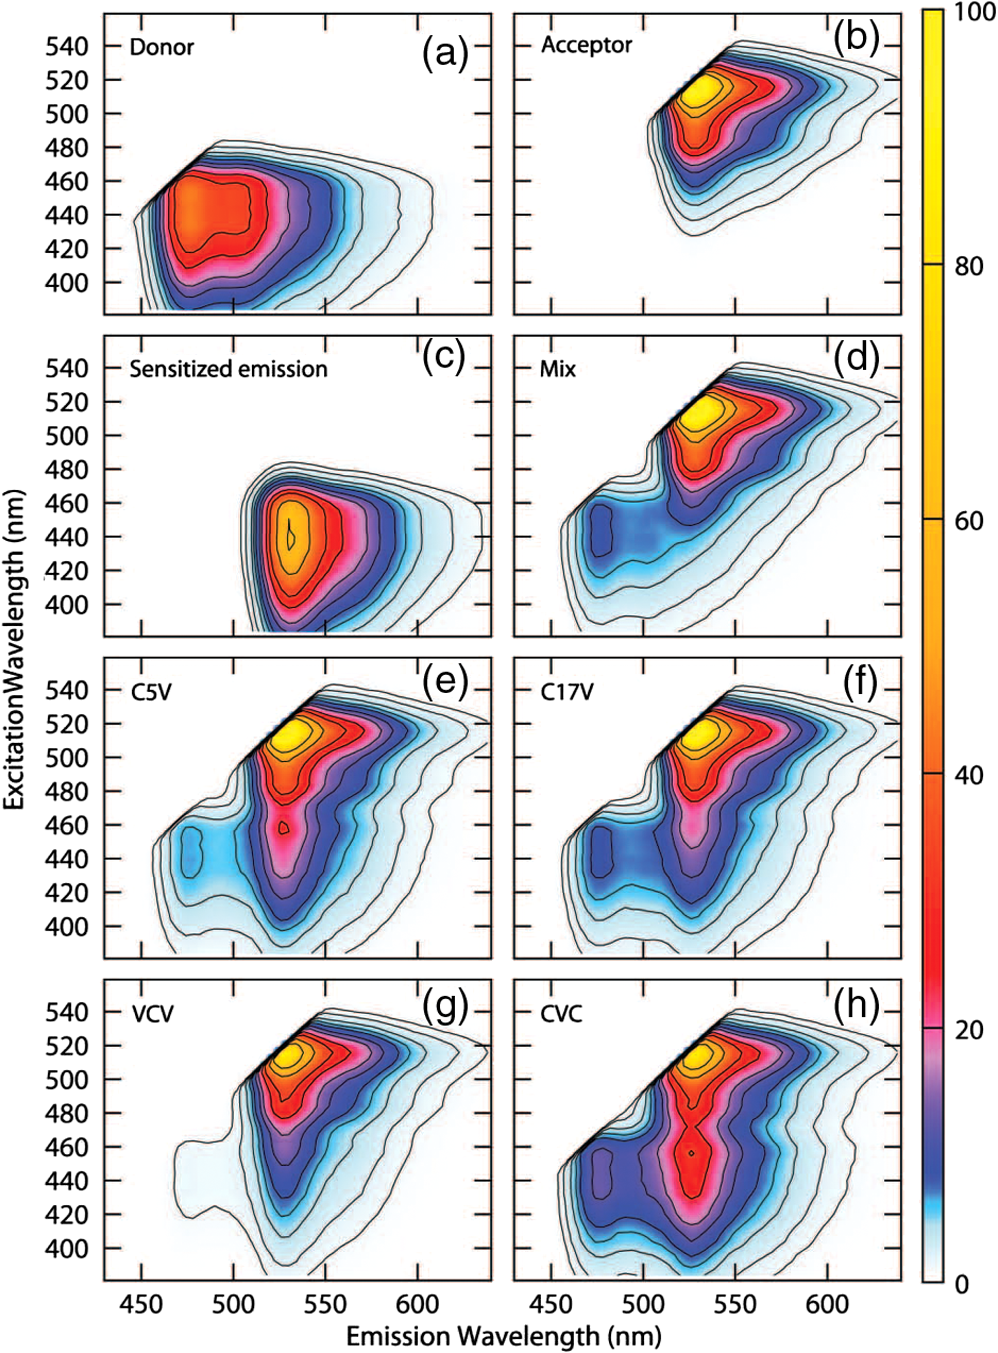 4.2.How Many Excitation Wavelengths Are Required?The ExEm spectra obtained from the fluorometer involve 44 different excitation wavelengths and 56 different emission wavelengths. While it is easy to collect such data on a spectrofluorometer in which the excitation wavelength can be changed at will, this may not be so easy if the method was to be used on a microscope. Thus it is important to know how many different excitation wavelengths are required to accurately determine the FRET efficiency using ExEm spectral unmixing. To answer this question, smaller quantities of data were extracted from the ExEm spectra, and calculations were made just using these. Surprisingly, as can be seen in Table 2, accurate results were obtained with as few as two excitation wavelengths, including those used in collecting the microscope data. This suggests that the ExEm approach could be extended to microscope data without the need for a large number of excitation wavelengths. Although the fact that good results can be obtained with such little data may seem surprising, it is worth noting that relatively good results have been obtained both here and elsewhere using the Em unmixing method with only two excitation wavelengths. Better results should be expected from the ExEm method when given the same amount of data as the Em method, as there is no need for cross excitation corrections. Table 2FRET efficiency determined for C5V with ExEm spectral unmixing using different amounts of data based upon the numbers of excitation wavelengths. All results make use of the complete number (56) of emission wavelengths.
4.3.FRET from Spectral Unmixing of Microscope DataSpectral unmixing of the microscope data can be performed in two ways, both of which are implemented in our ImageJ plugins described below. The first is to calculate the FRET efficiency of each pixel of the image (Fig. 6), to produce an image of FRET efficiencies. The FRET efficiencies in ROIs in the image, corresponding with each of the cells being imaged, can then be averaged. Alternatively, intensities can be averaged within each ROI in the microscope images resulting in a single set of spectra for each cell, as depicted in Fig. 7, which can be unmixed to calculate the average FRET efficiency for each cell. While the first method allows a graphical representation of FRET occurring in the cell and is good for visualizing regions in the cell with different FRET efficiencies, the second approach of first averaging intensities in an ROI before calculating FRET provides slightly more reliable quantitative results which are less prone to movement or noise. Thus we report the values obtained in this second approach in Table 1. Fig. 6Construction of FRET image: (a) An excerpt of a pixel confocal microscope image of HEK293FT cells expressing the C5V construct. Each pixel is approx 0.415 μm across and a 10 μm scale bar is shown. The color represents fluoresence intensity using the ImageJ lookup table “fire.” (b) A FRET efficiency image created using the ExEm unmixing method for each pixel. Scale bar shows coloring of efficiency values.  Fig. 7Example data from ExEm unmixing of microscope data. ExEm spectra are shown for (a) cerulean only; (b) venus only; (c) the sensitized emission spectrum found from convoluting the cerulean and venus spectra; and (d) the C5V construct. 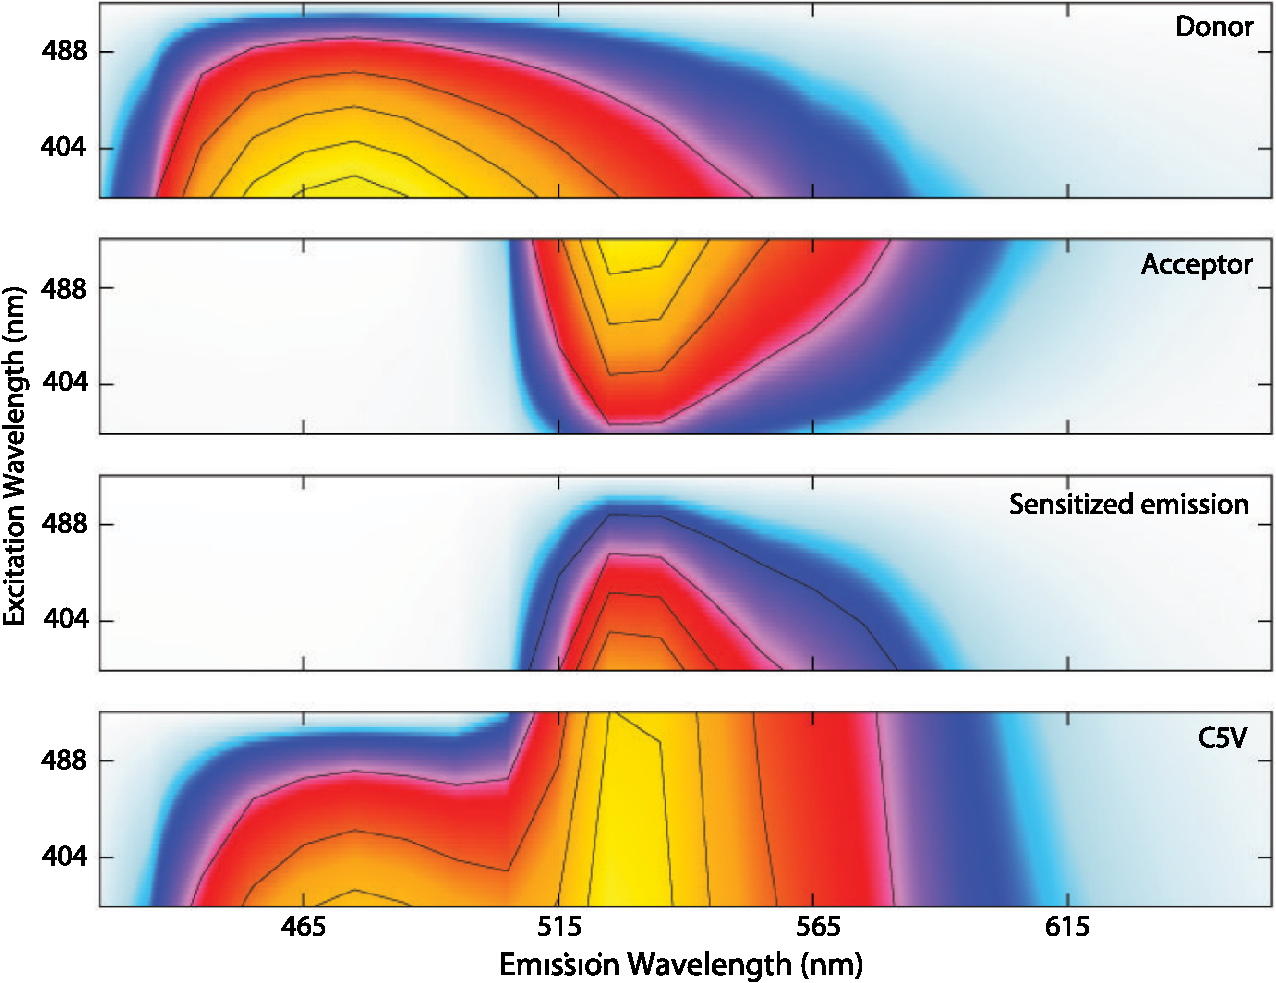 To test if the ExEm unmixing algorithm could be used to quantify FRET from microscope images obtained at two excitation wavelengths, we analyzed spectral images of the cerulean-venus constructs expressed in HEK cells. An example of the ExEm spectra constructed from the microscope data is shown in Fig. 7. While these may not look as informative as the spectra pictured in Fig. 5, it is evident that the C5V sample has three high-intensity regions corresponding with donor emission, sensitized emission, and directly excited acceptor emission. Using the ExEm unmixing method, it is possible to directly calculate the FRET efficiency of each of the cells in the microscope images to compare with reported values. In our case, however, an additional instrumental correction is required to allow pixels of all intensities to be included. To illustrate this, in Fig. 8 we show the FRET efficiency for each of the C5V cells, determined using the ExEm spectral unmixing method with no correction for the spectral sensitivity of the detectors. Clearly, at both the level of individual pixels [Fig. 8(a)] or within ROIs encompassing each cell [Fig. 8(b)], the calculated FRET efficiency changes dramatically as a function of the total brightness of the pixel or ROI. That is, fainter parts of the images have a lower FRET efficiency than brighter parts. A similar effect has previously been reported by Chen et al.27 and Levy et al.30 who noted that the PMT detectors on common microscopes do not respond linearly to different incident light intensities, and that this response may differ depending on the incident wavelength. In our case, the detectors show a much greater deviation from linearity in the red part of the spectrum (longer wavelengths) than in the blue (shorter wavelengths). As a consequence, the acceptor emission appears less intense relative to the donor emission in faint cells compared with bright cells as can be seen in the emission spectra plotted in Fig. 8(c). As can be seen in Fig. 8(a), the efficiency values approach a constant value at high intensities, so it is possible to gain accurate results by using only the brightest parts of the images. However, if reliable results are to be obtained independent of the pixel brightness, then a correction for the spectral response of the instrument is required. It is worth noting that while this nonlinear response is common in most PMT detectors, it may not be to the level reported here if the instrument has been well precalibrated and linearized. Furthermore, such nonlinearity is not generally present for CCD cameras which are more common on wide field microscopes. Thus the instrument spectral response correction may not be required in many cases. Fig. 8FRET efficiency calculations without instrument spectral response correction: (a) The FRET efficiency calculated at each pixel of an image of HEK293FT cells expressing C5V is plotted versus the acceptor emission intensity of the pixel (in the wavelength channel representing the peak in acceptor emission). The average FRET efficiency for each pixel intensity value is shown by the red line. (b) The FRET efficiency calculated in ROIs corresponding to cells expressing C5V are shown without (red) and with (black) instrument spectral response correction as a function of the average acceptor emission intensity in the ROI. (c) Emission spectra found for ROIs corresponding to cells expressing C5V under 405 nm excitation, normalized to the intensity of maximal donor emission. Each line corresponds with the spectrum found for an ROI with different emission intensity in the donor channel as indicated in the legend. (d) The FRET efficiency calculated in ROIs corresponding to cells expressing C5V are plotted against the calculated unquenched donor:acceptor ratio. The faintest ROIs are shown in red and blue, while the bright ROIs presenting robust data are shown in black. 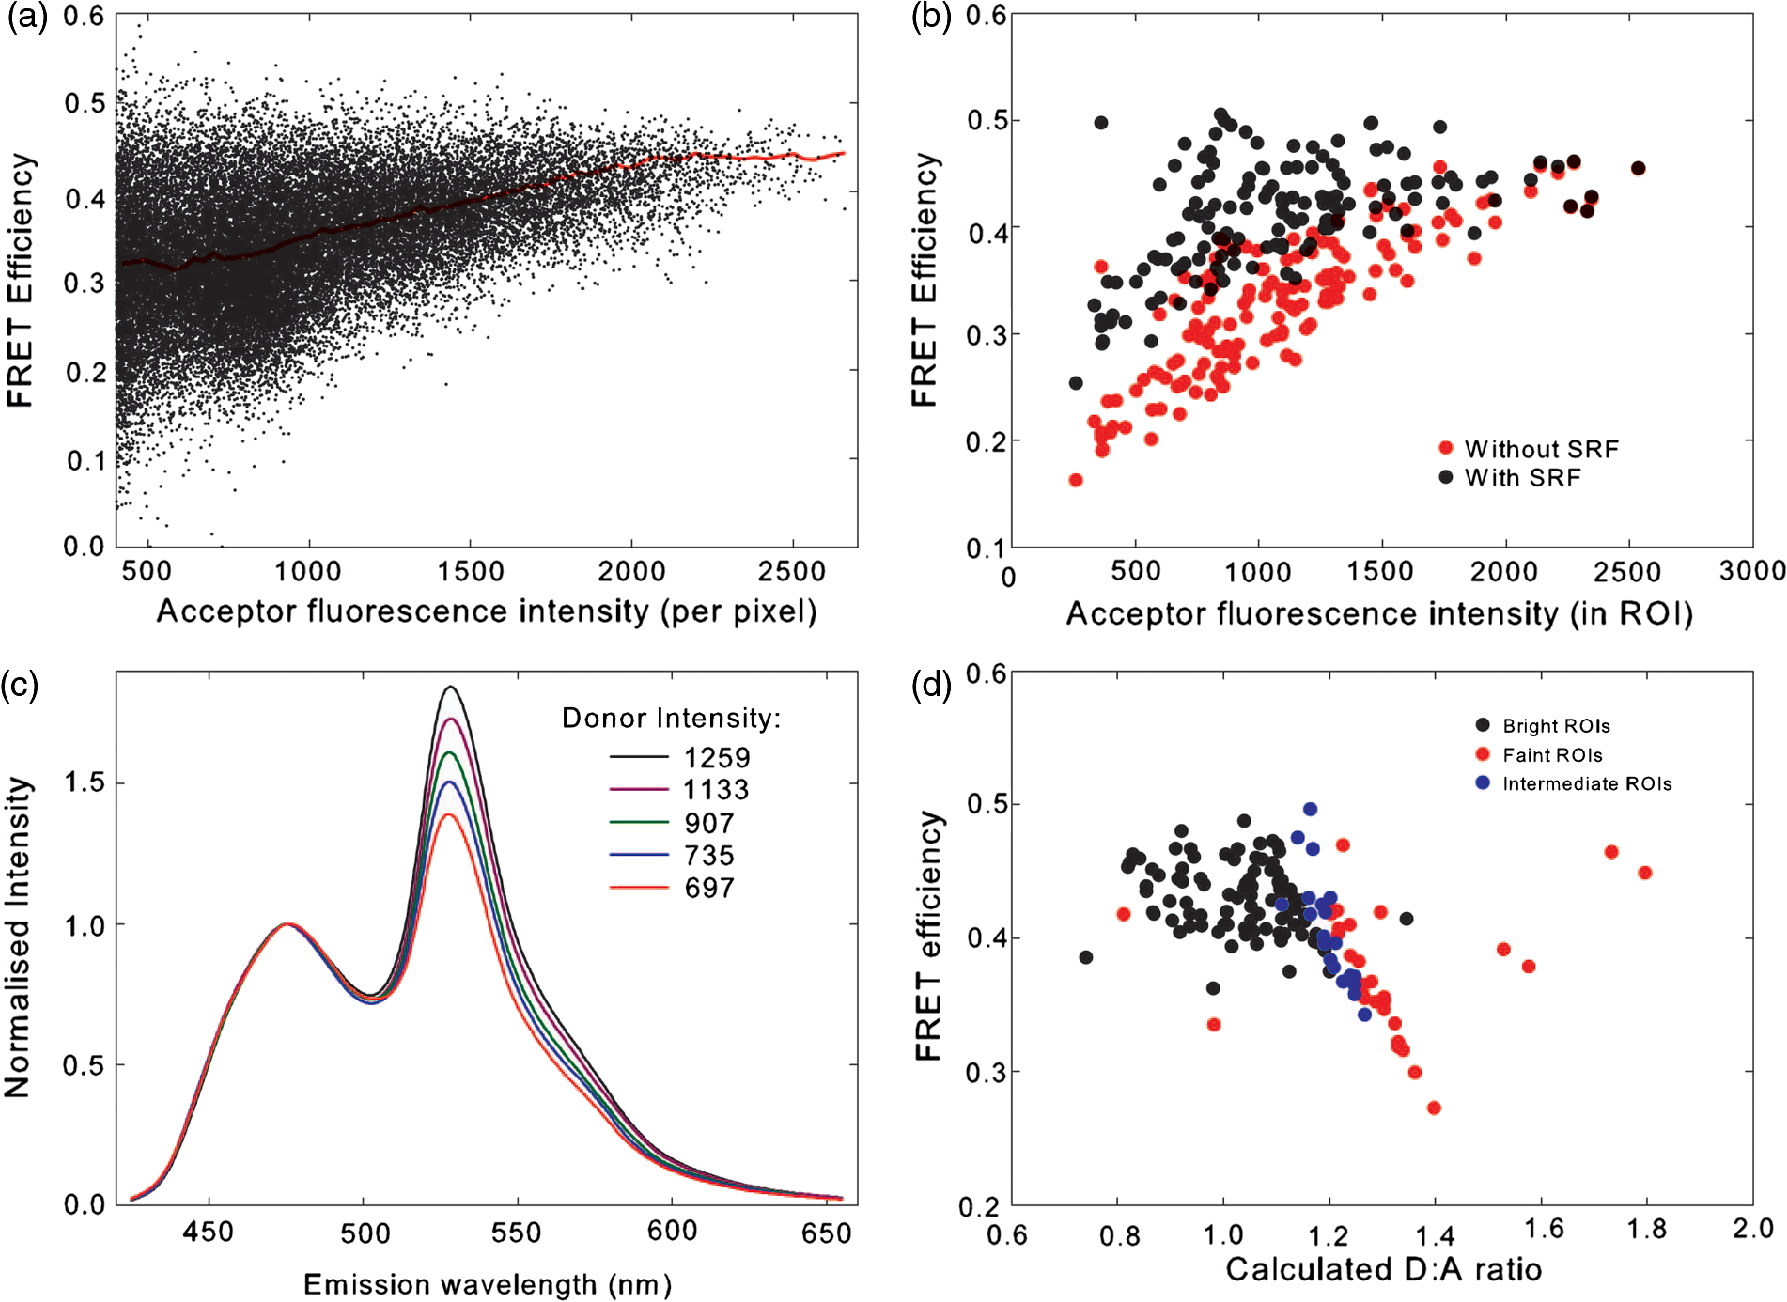 While the spectral response can be calibrated using a light source with a well characterised intensity versus wavelength output,30 such a source is not often readily available. The spectral response can also be corrected by noting that for a sample with fixed donor to acceptor stoichiometry, as in any one of the FRET samples used here, the ratio of donor to acceptor intensity should not change with pixel brightness. Thus deviations from this constant value represent the different response of the detector to different wavelengths of incident light. To apply this correction, one set of images was chosen as a control and the pixels were divided into intensity ranges based upon the brightness in one channel representing acceptor emission with either donor or acceptor excitation. The ratio of the total donor emission to acceptor emission [characterized by the coefficients and in Eq. (11)] was calculated for each pixel intensity range, then normalized to the ratio in the 10 brightest pixel intensity ranges and stored in a table we call the spectral response function, . The normalization to the brightest channels is done as the detector response appears linear for all wavelengths in these bright channels. The data in the spectral response table represents the amount by which the acceptor intensity needs to be multiplied to account for the nonlinear response of the detectors such that the ratios will be the same as in the bright pixel intensity ranges. Thus the correction can be applied during the FRET calculation by multiplying the coefficient in Eq. (11) by the spectral response correction corresponding to the intensity of the pixel for which the calculation is being made, , before proceeding to calculate the FRET efficiency. An example of the calculated spectral response correction is shown in Fig. 9. It can be seen that the poor response of the PMTs to red light means that the intensity of the acceptor is underestimated by up to 1.6 fold in the faint pixels. To demonstrate the effectiveness of the spectral response correction, the FRET efficiencies determined in ROIs corresponding to 134 different cells expressing C5V are plotted in Fig. 8(b) with and without the spectral correction. The clear dependence of efficiency on ROI intensity that is present prior to spectral response correction is removed when the correction is applied. This can be seen even more clearly in Fig. 9(b) where we show the average FRET efficiency calculated from the ROIs shown in Fig. 8(b), using only the ROIs that have an average intensity above the value shown on the -axis. Without the spectral response correction, the FRET efficiency only converges to a stable value for ROIs with an intensity greater than 2000. While it is difficult to completely account for the detector efficiency for the faintest cells, good results are obtained for all ROIs with intensity above 500. Fig. 9Instrument spectral response correction: (a) The spectral response correction [] related to the normalized ratio of donor to acceptor emission intensities in a sample with fixed FRET efficiency is plotted against the maximal acceptor emission intensity of each pixel. (b) The average FRET efficiency for cells expressing C5V is shown using only ROIs that have average acceptor intensity above the value shown on the -axis, before (red) and after (black) instrument spectral response correction. 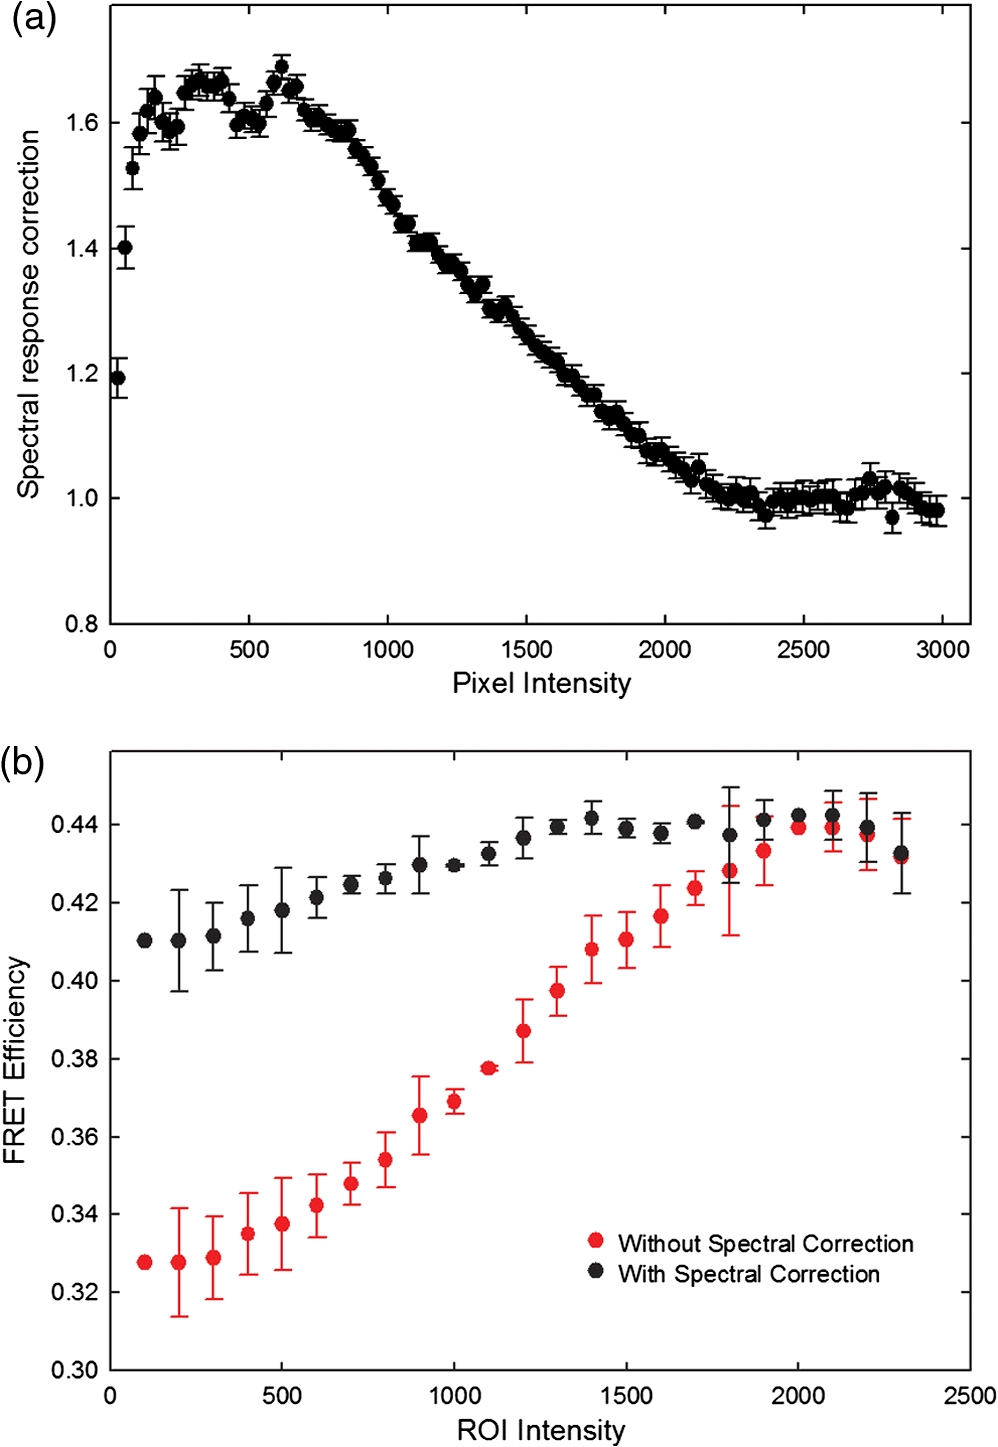 Random association of fluorophores can produce a systematic change in FRET efficiency with fluorophore density due to the presence of inter-molecular FRET.36,37 Such a behavior is not expected in our system given the likely expression levels of the constructs. The dependence of FRET efficiency upon fluorescence intensity seen in our raw data appears to be due to the spectral sensitivity of the detectors rather than increasing fluorophore association. This is supported by the FRET efficiency being constant for all the bright ROIs and the change in efficiency with brightness being mostly removed after spectral correction. To further support this claim, we plot the FRET efficiency calculated for ROIs shown in Fig. 8(b) versus the unquenched (calculated) donor:acceptor ratio [Fig. 8(d)]. While there is some scatter in the individual values about unity, there is no systematic trend in the results as would be expected if inter-molecular FRET was occurring. The tail of high D:A ratios is almost completely from the low intensity ROIs (red), indicating that they do not provide robust data. The FRET efficiency values obtained using ExEm spectral unmixing of the microscope data, averaged over all the imaged cells, are given in Table 1. The results are in close agreement with the previously reported values for these samples and those obtained from unmixing the fluorometer data. The negative control is also calculated to have no FRET taking place. 4.3.1.Em unmixing of microscope dataAs a final test of the ExEm spectral unmixing algorithm, we compare the results with those obtained using our version of the Em unmixing approach, which only unmixes emission spectra. In this case an additional cross-excitation correction is required to remove the signal of the directly excited acceptors from the FRET signal. As described in the theory section, this can be done by observing the proportion of acceptors excited with donor excitation compared with those excited with acceptor excitation in an acceptor only signal accounting for the instrument response of the detector. While the instrument response correction used when doing the cross-excitation correction has a common origin as the spectral response correction described earlier (the nonlinear response of the PMT detectors), this second correction only accounts for the response of the detectors at the acceptor emission wavelengths, while the spectral response correction contains the relative response of both the donor and acceptor emission wavelengths. As for the ExEm unmixing algorithm, a spectral response correction is also required for the Em method when using PMT detectors. Thus the Em method requires cross excitation correction and two instrument response corrections when using PMTs. In contrast, the ExEm method requires no corrections for the fluorometer data or CCD detectors and only one instrument response correction when using PMTs. The FRET efficiency values obtained with ExEm unmixing show general agreement with that obtained using the Em approach as shown in Table 1. Notably, the ExEm approach yields more reliable results for faint pixels and is closer to the reported values for the VCV construct. 5.ImageJ PluginsA plugin for ImageJ called “Fretty” has been developed to expediate the analysis of microscope images using the methods described here. This contains two methods, one for each of the Em and ExEm spectral unmixing approaches, the graphical interfaces of which are shown in Fig. 10. The final FRET analysis can either be applied on a pixel-by-pixel basis to create a FRET image, in which each pixel contains the FRET efficiency at that location, or to calculate the FRET efficiency within regions of interest. The plugin is available from the authors or through the ImageJ plugin repository. A detailed user guide is provided on our website (karri.anu.edu.au), so we give only a brief description of the use of the ExEm unmixing program here. Fig. 10Screen shots of the graphical interfaces for the ImageJ plugin Fretty for FRET analysis of microscope images using ExEm (a) and Em (b) spectral unmixing. 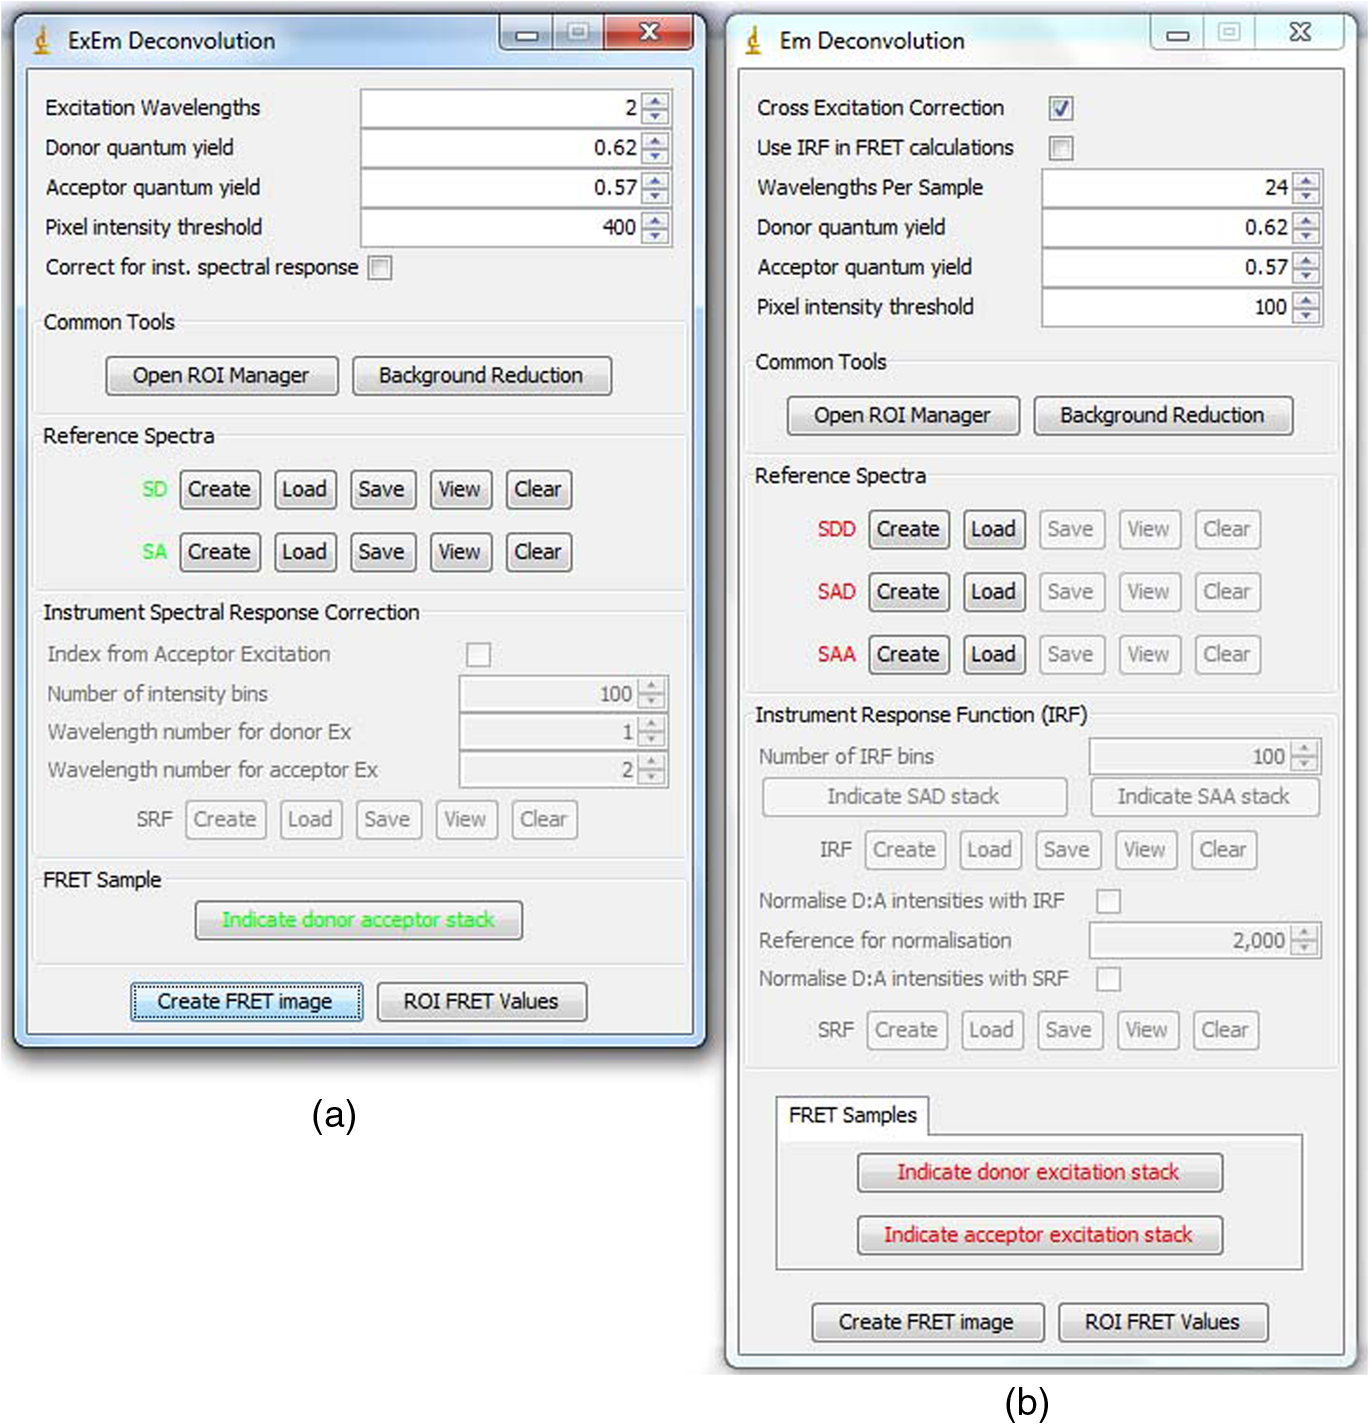 For each sample, the emission spectra needs to be collected using a spectral detector for at least two excitation wavelengths. These images are combined into stacks, ordered such that all the emission wavelengths for one excitation are found in sequence before moving to the next excitation wavelength. Reference spectra can be automatically generated once regions of interest in either the donor only or acceptor only image have been drawn using the ImageJ ROI manager. The spectral response function can also be automatically created from data from a FRET sample once the number of intensity bins to be used in generating the response function has been specified and ROIs have been drawn around the foreground regions of the image. The reference spectra and spectral response function can be saved for later use (ideally a new set should be created each time new FRET data are collected). Analysis of FRET images is straightforward once a stack containing data from a FRET sample has been created. If creating a FRET image, then the transfer efficiency will only be calculated for pixels whose intensity is above a designated threshold to avoid background regions showing up in the image. In this case, no ROIs need to be drawn and a new image will be generated in which each pixel value represents the FRET efficiency at that position. If calculating FRET in ROIs, then these must first be drawn on the image with the ROI manager, and once the analysis is complete a results table will be generated listing the average FRET efficiency value in each ROI. 6.DiscussionA number of recent studies have used spectral unmixing of emission spectra to aid the quantification of FRET. By doing so, they explicitly account for donor spectral bleedthrough, but acceptor cross excitation has to be accounted for through an additional correction. The methods differ in exactly how this correction is determined and each has its strengths. The Em method presented here follows these approaches with close similarities to the corrections of Ecker et al.,33 and Chen et al.27 An advantage of both our method and that of Chen et al. is that they can account for nonlinear instrument responses that otherwise yield different FRET efficiencies for cells of different intensities. In addition, unlike the method of Thaler et al.26 the concentrations of the reference samples need not be known. The ExEm method described here involves the unmixing of both excitation and emission spectra and so directly accounts for both donor spectral bleedthrough and acceptor cross excitation without the need for additional corrections. An advantage of this approach is that the presence of FRET can be unambiguously determined by the appearance of a third peak in the spectra, which does not overlap the donor only or acceptor only spectra. While we initially expected that the ExEm approach would require the use of a large number of different excitation wavelengths, we found that better results were obtained with this method than with Em spectral unmixing when using only two excitation wavelengths. ExEm spectral unmixing is considerably more elegant than the Em approach for quantifying FRET efficiencies, as it does not require specific cross-excitation corrections and recognises FRET by the presence of a spectral peak that does not overlap either the donor or acceptor signals. In hindsight, it is not surprising that it outperforms the Em approach when given the same data. The availability of multiple lasers, tunable gratings with arc lamp excitation, or tunable white lasers will make the simpler ExEm approach even more appealing in the future, as the use of additional excitation wavelengths will make the approach even more accurate. A particularly promising future application of the ExEm method described here is in studies with more than two fluorophores present, such as when examining the interactions of three different proteins. The unmixing of both excitation and emission wavelengths is particularly helpful for separating the signals from multiple overlapping fluorophores. This could be useful, for example, when FRET is simultaneously taking place between different types of fluorophores, such as in three-color FRET where the acceptor for transfer from another fluorophore can act as a donor for transfer to a third fluorophore.38–43 Unmixing of both the excitation and emission wavelengths would allow for robust analysis without making any assumptions about how each excitation wavelength excites each fluorophore type. One issue with the methods described here is that while the contributions from free acceptors can be distinguished from those involved in DA pairs undergoing FRET, free donors cannot be identified and this can compromise FRET values.44,45 Approaches to overcome this include adding additional data such as lifetime measurements44 or additional calibration.30,45 FRET is being ever more commonly utilized for examining protein-protein interactions, the composition of macromolecular complexes, examining protein structure and conformational changes, and as an indicator of biochemical events.6 The methods and user interfaces described here add to the arsenal of scientists needing to accurately quantify FRET efficiencies, and we envisage them being useful for a range of applications in both microscopy and spectrometry. AcknowledgmentsThe authors thank the Australian Research Council for funding, including a Future Fellowship (FT100100271) to Kevin Pfleger, and iVEC for the provision of a research internship to John Hannagan. We thank Srinagesh V. Koushik and Steven S. Vogel for kindly making plasmids for the FRET constructs available to us. The authors acknowledge the facilities, and the scientific and technical assistance of the Australian Microscopy & Microanalysis Research Facility at the Centre for Microscopy, Characterisation & Analysis, The University of Western Australia, a facility funded by the University, State and Commonwealth Governments. The ImageJ plugins and user guide are available at: http://karri.anu.edu.au/corry/software.html. ReferencesJ. R. Lakowiczet al.,
“Conformational distributions of melittin in water/methanol mixtures from frequency-domain measurements of nonradiative energy transfer,”
Biophys. Chem., 36
(2), 99
–115
(1990). http://dx.doi.org/10.1016/0301-4622(90)85014-W BICIAZ 0301-4622 Google Scholar
E. R. Chapmanet al.,
“Fluorescence energy transfer analysis of calmodulin-peptide complexes,”
Biochemistry, 31
(51), 12819
–12825
(1992). http://dx.doi.org/10.1021/bi00166a016 MIRBD9 0144-0578 Google Scholar
T. Heyduk,
“Measuring protein conformational changes by FRET/LRET,”
Curr. Opin. Biotechnol., 13
(4), 292
–296
(2002). http://dx.doi.org/10.1016/S0958-1669(02)00332-4 CUOBE3 0958-1669 Google Scholar
M. A. HinkT. BisselinA. J. Visser,
“Imaging protein-protein interactions in living cells,”
Plant Mol. Biol., 50
(6), 871
–883
(2002). http://dx.doi.org/10.1023/A:1021282619035 PMBIDB 0167-4412 Google Scholar
G. BuntF. S. Wouters,
“Visualization of molecular activities inside living cells with fluorescent labels,”
Int. Rev. Cytol., 237 205
–277
(2004). http://dx.doi.org/10.1016/S0074-7696(04)37005-1 IRCYAJ 0074-7696 Google Scholar
Y. Sunet al.,
“FRET microscopy in 2010: the legacy of Theodor Förster on the 100th anniversary of his birth,”
Chem. Phys. Chem., 12
(3), 462
–474
(2011). http://dx.doi.org/10.1002/cphc.201000664 CPCHFT 1439-4235 Google Scholar
T. Förster,
“Transfer mechanisms of electronic excitation,”
Discuss. Faraday Soc., 27 7
–17
(1959). http://dx.doi.org/10.1039/df9592700007 DFSOAW 0014-7664 Google Scholar
R. M. CleggP. C. Schneider, Fluoresence Lifetime-Resolved Imaging Microscopy: A General Description of Lifetime-Resolved Imaging Measurements, 15
–33 Plenum Press, New York
(1996). Google Scholar
A. G. HarpurF. S. WoutersP. I. Bastiaens,
“Imaging FRET between spectrally similar GFP molecules in single cells,”
Nat. Biotechnol., 19
(2), 167
–169
(2001). http://dx.doi.org/10.1038/84443 NABIF9 1087-0156 Google Scholar
Y. ChenJ. D. MillsA. Periasamy,
“Protein localization in living cells ans tissues using FRET and FLIM,”
Differentiation, 71
(9–10), 528
–541
(2003). http://dx.doi.org/10.1111/dif.2003.71.issue-9-10 DFFNAW 0301-4681 Google Scholar
M. A. RizzoD. W. Piston,
“High-contrast imaging of fluorescent protein FRET by fluorescence polarization microscopy,”
Biophys. J., 88
(2), L14
–L16
(2005). http://dx.doi.org/10.1529/biophysj.104.055442 BIOJAU 0006-3495 Google Scholar
D. W. PistonM. A. Rizzo,
“FRET by fluorescence polarization microscopy,”
Meth. Cell Biol., 85 415
–430
(2008). http://dx.doi.org/10.1016/S0091-679X(08)85018-2 MCBLAG 0091-679X Google Scholar
T. ZalN. R. Gascoigne,
“Photbleaching-corrected FRET efficiency imaging of live cells,”
Biophys. J., 86
(6), 3923
–3939
(2004). http://dx.doi.org/10.1529/biophysj.103.022087 BIOJAU 0006-3495 Google Scholar
E. B. van Munsteret al.,
“Fluorescence resonance energy transfer (FRET) measurement by gradual acceptor photobleaching,”
J. Micros., 218
(Pt. 3), 253
–262
(2005). http://dx.doi.org/10.1111/jmi.2005.218.issue-3 JMICAR 0022-2720 Google Scholar
A. K. Kenworthy, Photobleaching FRET Microscopy, 146
–164 Oxford University Press, New York
(2005). Google Scholar
B. Corryet al.,
“An improved open channel structure of mscl determined from FRET confocal microscopy and simulation,”
J. Gen. Physiol., 136
(4), 483
–494
(2010). http://dx.doi.org/10.1085/jgp.200910376 JGPLAD 0022-1295 Google Scholar
G.W. Gordonet al.,
“Quantitative fluorescence resonance energy transfer measurements using fluorescence microscopy,”
Biophys. J., 74
(5), 2702
–2713
(1998). http://dx.doi.org/10.1016/S0006-3495(98)77976-7 BIOJAU 0006-3495 Google Scholar
Z. XiaY. Liu,
“Reliable and global measurement of fluorescence resonance energy transfer using fluorescence microscopes,”
Biophys. J., 81
(4), 2395
–2402
(2001). http://dx.doi.org/10.1016/S0006-3495(01)75886-9 BIOJAU 0006-3495 Google Scholar
Y. Chen, M. Elangovan, and A. Periasamy, FRET Data Analysis: The Algorithm, 146
–164 Oxford University Press, New York
(2005). Google Scholar
R. M. Clegg,
“Fluorescence resonance energy-transfer and nucleic-acids,”
Meth. Enzymol., 211 353
–388
(1992). http://dx.doi.org/10.1016/0076-6879(92)11020-J MENZAU 0076-6879 Google Scholar
F. J. M. van Kuppeveldet al.,
“Homomultimerization of the coxsackievirus 2B protein in living cells visualized by fluorescence resonance energy transfer microscopy,”
J. Virol., 76
(18), 9446
–9456
(2002). http://dx.doi.org/10.1128/JVI.76.18.9446-9456.2002 JOVIAM 1070-6321 Google Scholar
C. M. S. Croixet al.,
“Nitric oxide-induced modification of protein thiolate clusters as determined by spectral fluorescence resonance energy transfer in live endothelial cells,”
Free Radical Biol. Med., 37
(6), 785
–792
(2004). http://dx.doi.org/10.1016/j.freeradbiomed.2004.06.004 FRBMEH 0891-5849 Google Scholar
T. Zimmermannet al.,
“Spectral imaging and linear un-mixing enables improved FRET efficiency with a novel GFP2-YFP FRET pair,”
FEBS Lett., 531
(2), 245
–249
(2002). http://dx.doi.org/10.1016/S0014-5793(02)03508-1 FEBLAL 0014-5793 Google Scholar
Y. Guet al.,
“Quantitative fluorescence resonance energy transfer (FRET) measurement with acceptor photobleaching and spectral unmixing,”
J. Micros., 215
(2), 162
–173
(2004). http://dx.doi.org/10.1111/j.0022-2720.2004.01365.x JMICAR 0022-2720 Google Scholar
V. Raicuet al.,
“Protein interaction quantified in vivo by spectrally resolved fluorescence resonance energy transfer,”
Biochem. J., 385
(Pt. 1), 265
–277
(2005). http://dx.doi.org/10.1042/BJ20040226 BIJOAK 0264-6021 Google Scholar
C. Thaleret al.,
“Quantitative multiphoton spectral imaging and its use for measuring resonance energy transfer,”
Biophys. J., 89
(4), 2736
–2749
(2005). http://dx.doi.org/10.1529/biophysj.105.061853 BIOJAU 0006-3495 Google Scholar
Y. Chenet al.,
“Characterization of spectral FRET imaging microscopy for monitoring nuclear protein interactions,”
J. Micros., 228
(Pt. 2), 139
–152
(2007). http://dx.doi.org/10.1111/jmi.2007.228.issue-2 JMICAR 0022-2720 Google Scholar
D. Megiaset al.,
“Novel lambda FRET spectral confocal microscopy imaging method,”
Micros. Res. Technol., 72
(1), 1
–11
(2009). http://dx.doi.org/10.1002/jemt.v72:1 MRTEEO 1059-910X Google Scholar
C. BattersH. ZhuJ. E. Sale,
“Visualisation of PCNA monoubiquitination in vivo by single pass spectral imaging FRET microscopy,”
PLoS One, 5
(2), e9008
(2010). http://dx.doi.org/10.1371/journal.pone.0009008 1932-6203 Google Scholar
S. Levyet al.,
“SpRET: Highly sensitive and reliable spectral measurement of absolute FRET efficiency,”
Micros. Microanal., 17
(2), 176
–190
(2011). http://dx.doi.org/10.1017/S1431927610094493 MIMIF7 1431-9276 Google Scholar
T. ZimmermannJ. RietdorfR. Pepperkok,
“Spectral imaging and its applications in live cell microscopy,”
FEBS Lett., 546
(1), 87
–92
(2003). http://dx.doi.org/10.1016/S0014-5793(03)00521-0 FEBLAL 0014-5793 Google Scholar
J. Yuanet al.,
“Quantitative FRET measurement by high-speed fluorescence excitation and emission spectrometer,”
Opt. Express, 18
(18), 18839
–18851
(2010). http://dx.doi.org/10.1364/OE.18.018839 OPEXFF 1094-4087 Google Scholar
R.C. Eckeret al.,
“Application of spectral imaging microscopy in cytomics and fluorescence resonance energy transfer (FRET) analysis,”
Cytometry A, 59
(2), 172
–181
(2004). http://dx.doi.org/10.1002/(ISSN)1097-0320 1552-4922 Google Scholar
S.V. Koushiket al.,
“Cerulean, Venus, and VenusY67C FRET reference standards,”
Biophys. J., 91
(12), L99
–L101
(2006). http://dx.doi.org/10.1529/biophysj.106.096206 BIOJAU 0006-3495 Google Scholar
H. Chenet al.,
“Measurement of FRET efficiency and ratio of donor to acceptor concentration in living cells,”
Biophys. J., 91
(5), L39
–L41
(2006). http://dx.doi.org/10.1529/biophysj.106.088773 BIOJAU 0006-3495 Google Scholar
A. K. KenworthyM. Edidin,
“Distribution of a glycosylphosphatidylinositol-anchored protein at the apical surface of MDCK cells examined at a resolution of <100 Å using imaging fluorescence resonance energy transfer,”
J. Cell Biol., 142
(1), 69
–84
(1998). http://dx.doi.org/10.1083/jcb.142.1.69 JCLBA3 0021-9525 Google Scholar
H. Wallrabeet al.,
“Confocal FRET microscopy to measure clustering of ligand-receptor complexes in endocytic membranes,”
Biophys. J., 85
(1), 559
–571
(2003). http://dx.doi.org/10.1016/S0006-3495(03)74500-7 BIOJAU 0006-3495 Google Scholar
M. Heilemannet al.,
“Multistep energy transfer in single molecular photonic wires,”
J. Am. Chem. Soc., 126
(21), 6514
–6515
(2004). http://dx.doi.org/10.1021/ja049351u JACSAT 0002-7863 Google Scholar
S. HohngC. JooT. Ha,
“Single-molecule three-color FRET,”
Biophys. J., 87
(2), 1328
–1337
(2004). http://dx.doi.org/10.1529/biophysj.104.043935 BIOJAU 0006-3495 Google Scholar
E. GalperinV. V. VerkhushaA. Sorkin,
“Three-chromophore FRET microscopy to analyze multiprotein interactions in living cells,”
Nat. Methods, 1
(3), 209
–217
(2004). http://dx.doi.org/10.1038/nmeth720 1548-7091 Google Scholar
J. P. ClammeA. A. Deniz,
“Three-color single-molecule fluorescence resonance energy transfer,”
ChemPhysChem., 6
(1), 74
–77
(2005). http://dx.doi.org/10.1002/(ISSN)1439-7641 CPCHFT 1439-4235 Google Scholar
N. K. Leeet al.,
“Three-color alternating-laser excitation of single molecules: Monitoring multiple interactions and distances,”
Biophys. J., 92
(1), 303
–312
(2007). http://dx.doi.org/10.1529/biophysj.106.093211 BIOJAU 0006-3495 Google Scholar
Y. Sunet al.,
“Three-color spectral FRET microscopy localizes three interacting proteins in living cells,”
Biophys. J., 99
(4), 1274
–1283
(2010). http://dx.doi.org/10.1016/j.bpj.2010.06.004 BIOJAU 0006-3495 Google Scholar
R. A. NeherE. Neher,
“Applying spectral fingerprinting to the analysis of FRET images,”
Micros. Res. Tech., 64
(2), 185
–195
(2004). http://dx.doi.org/10.1002/(ISSN)1097-0029 MRTEEO 1059-910X Google Scholar
J. Wlodarczyket al.,
“Analysis of FRET signals in the presence of free donors and acceptors,”
Biophys. J., 94
(3), 986
–1000
(2008). http://dx.doi.org/10.1529/biophysj.107.111773 BIOJAU 0006-3495 Google Scholar
|
|||||||||||||||||||||||||||||||||||||||||||||||||||||||||||||||||||||||||||||||||||||


