
|
|
1.IntroductionSquamous cell carcinoma (SCC), arising from various human anatomic sites, including esophagus, oral cavity, lung, and cervix, is the most common cancer capable of metastatic spread worldwide.1 Early diagnosis and localization of premalignant lesions along with effective clinical treatment (e.g., surgical resection) is crucial towards improving SCC patients’ survival.1,2 However, current conventional clinical method to detect the high-risk lesionsis usually based on visual inspection.3,4 Subtle tissue transformation may not be apparent, limiting diagnostic accuracy.3,4 Positive biopsy is the standard criterion for squamous precancer diagnosis, but is invasive and impractical for screening high-risk patients who may have multiple suspicious lesion sites. Therefore, a noninvasive imaging technique permitting direct assessment of tissue architectural, cellular/subcellular morphology and biochemical information from suspicious lesions in vivo would represent a significant advancement in the oncology realm for tissue precancer diagnosis. Nonlinear optical (NLO) microscopy is a powerful imaging technique that possesses inherent three-dimensional imaging capability, deep tissue penetration, and low photodamage.5,6 In particular, it offers the advantage of label-free subcellular resolution imaging through probing tissue endogenous NLO signals.5 Hence, in the last decade NLO microscopy has gained much attention from scientific and medical community for ex vivo and in vivo imaging of precancerous and cancerous tissues in various organ parts of animal models and human subjects.7–13 For instance, two photon excited fluorescence (TPEF) imaging, one of the most commonly used NLO imaging technology, can detect mitochondria-related metabolic coenzymes such as nicotinamide adenine dinucleotide (NADH) in different tissue pathological conditions, including precancers.7,9–12 This label-free imaging modality has shown to provide valuable cellular/subcellular morphological and biochemical information for premalignancy diagnosis.7,10,12 Additionally, intrinsic TPEF signals of structural proteins within the epithelia (e.g., keratin) have also been unraveled to contain significant diagnostic information for identification of preneoplasia.10,14 Through the use of a second harmonic generation (SHG)-based NLO microscopy, the stroma layer underlying the epithelia has also been revealed to hold significant endogenous collagen structural and molecular signals that correlate highly with intraepithelial neoplasia tissue transformation.8 In general, various individual NLO techniques have been demonstrated to hold significance potential to be clinically applied for precancer tissue diagnosis in situ.7,8 Therefore, a multimodal microscopy integrating different NLO techniques can potentially provide more accurate diagnostic information for aiding early detection of squamous epithelial precancers. It is known that a single near-infrared (NIR) excitation light (e.g., 720 to 780 nm) is capable to elicit valuable TPEF signals of NADH, keratin, and collagen, and the SHG signal of collagen in the epithelial mucosa tissue.15,16 Hence, to date, most of the multimodal NLO imaging combinations have centered upon the single near infrared (NIR) excitation light for precancer and cancer tissue diagnosis.10,11 This strategy, however, impedes potential endogenous NLO signals that necessitate in other wavelength range for excitation to be readily investigated for diseased tissue diagnosis. For example, NLO signals of amino acids such as TPEF of tryptophan remains unexplored in the literature for precancer and cancer diagnosis as it requires optimal excitation light in the visible spectral domain (e.g., to 600 nm);17 despite being consistently demonstrated to be pivotal towards premalignancy and malignancy tissue detection in different organs ex vivo with harmful one-photon ultra-violet fluorescence excitation techniques.18–20 Very recently, our group successfully developed a unique multicolor excitation-based multimodal NLO microscopy, which can simultaneously collect TPEF of NADH, keratin, collagen, and tryptophan, and SHG of collagen in biological tissues in vivo.21 The system was further equipped with time- and spectral-resolved detection modalities, facilitating sophisticated analysis of the complex NLO signals, thereby increasing the diagnostic power of the multicolor-based excitations multimodal NLO microscopy.22 In this study, we characterize the squamous epithelial endogenous signals probed from the multimodal NLO system at different epithelial mucosa tissue layers from stratum corneum to stroma. Additionally, we aim to assess the diagnostic efficacies of the NLO image-derived diagnostic parameters from the various excitation wavelengths alone and collectively for in vivo detection of preneoplastic lesion. In the in vivo study, 7, 12-dimenthylbenz(a)anthracene (DMBA) hamster cheek pouch carcinogenesis model was utilized to systematically evaluate the efficacy of multimodal system for in situ diagnosis of various squamous preneoplasia grades. 2.Materials and Methods2.1.DMBA-Treated Hamster Cheek Model of Squamous Epithelial PrecancerThe conventional Golden Syrian hamster (Mesocricetus auratus) cheek pouch model was used.23 A total of 23 animals were subjected to application of 0.5% DMBA in mineral oil (DMBA-treated model) three times per week on the right cheek pouch. This resulted in the development of different precancerous grades over a period of 20 weeks. To establish a control group for comparison, 11 animals were subjected to only mineral oil using the same technique as described for DMBA-treated model. At 11 to 20 weeks after the commencement of the treatment, three animals including 2 treated and 1 control were measured and subsequently sacrificed every week. This study was approved by the Hong Kong University of Science and Technology Animal Care Committee. 2.2.Multicolor Excitation-Based Multimodal NLO MicroscopeThe instrument developed for in vivo microscopic studies of TPEF and SHG signals from epithelial tissues has been previously described in detail elsewhere.22 Briefly, the 745 nm beam (NIR) from femtosecond laser (Coherent, Mira-900) was divided into two parts by a beam splitter (BP145B2, Thorlabs). One part of the laser light was used to pump a photonic crystal fiber (PCF, NL-1.4-775, Crystal Fiber) for generation of an ultrafast supercontinuum that was subsequently bandpass filtered (D600/40M, Chroma) to extract visible light (VIS). The remaining part of the laser light was utilized to combine with the VIS-supercontinuum at 600 nm for producing multicolor excitation source in this system. The excitation and emission light were coupled through an in-house developed upright microscope with a water immersion objective (40×, 1.15 NA, Olympus), providing lateral and axial resolution of approximately 0.4 and 1.5 μm, respectively. A nondescanned detection configuration primarily comprising of a dichroic mirror (FF510, Semrock) and short-pass filters (SP01-532RU/FF01-680SP) was used to deliver emitted NLO signals to a Czerny-Turner spectrograph (MS125, LOT-Oriel). A linear array of photomultiplier tube (PMT) connected to a time-correlated single photon counting (TSCPC) module (PML-16-C-0 and SPC-150, Becker & Hickl) was used to detect the NLO emission signals. The measurement wavelength covers 16 consecutive spectral bands from 300 to 500 nm at a 13 nm interval. The instrument response function of the time-resolved spectroscopic system, measured by the reflection of the femtosecond laser light, was approximately 230 ps at full width half maximum. 2.3.In Vivo Imaging Acquisition ProcedurePrior to in vivo tissue measurement, the hamster was intraperitoneally anaesthetized with a mixture of ketamine and xylazine. Subsequently, the right cheek pouch was everted and stretched over a 6 mm diameter pole. This facilitates buccal epithelial surface to be accessible by the microscopy objective for tissue examination. Before each measurement, to minimize residual food residual interference within the oral cavity, the cheek pouch was wiped with saline. In each animal, 1 to 2 spatially distinct tissue sites were selected for subsequent biopsy removal. Within each tissue site, to account for intra-site variability, 2 to 4 different locations were eventually measured by the NLO microscopy. En face images of ( pixels) were acquired at different tissue depths through 3 μm -step intervals. The first image of the -stack was taken from above the epithelial tissue surface. The remaining images of the -stack were recorded until the signal was completely attenuated and/or no discernible pattern could be identified. 745-nm-excitation -stack acquisitions generally preceded the 600-nm-excitation -stack at the same measurement location. To ensure similar light fluence rate at different tissue layer depths, mean excitation powers at the samples were adjusted to between 10 to 40 and 10 to 15 mW for 745 and 600 nm excitations, respectively (deeper layer typically necessitates higher power). Each image was scanned for a period of 8 s. There was no significant change in the photon count rates during image acquisition, affirming negligible photobleaching effect on the tissue measurement sites. Note that before the commencement of each experiment, the fluorescence of standard NADH and tryptophan solution were measured to ensure the spectral-lifetime measurements were consistent between different time periods of experimentation. 2.4.HistopathologyAfter the completion of optical interrogation measurements at a biopsy-designated tissue site, it was ink-labeled. Once all biopsy-designated tissue sites were ink-labeled, 4 mm diameter tissues were punch-biopsied from these locations. The biopsy samples were fixed in 4% formaldehyde solution and submitted for histopathologic evaluation by experienced pathologists. The results showed that among the 62 samples submitted for histopathological examination, 18 were normal, 30 were mild dysplasia, seven were moderate dysplasia, three were severe dysplasia, and four were carcinoma in situ (CIS). Since the harvested severe dysplasia and CIS tissue samples were small, the two pathology grades were grouped into one group () to increase statistical power. 2.5.Quantification of Morphologic ParametersThe NLO images acquired at different depth facilitate image stacks to be clearly separated into three distinct layers: stratum corneum, stratum granulosum–stratum basale, and stroma (details are provided Figs. 1 and 2). Through identifying the image planes where the three distinctive tissue layer unique spatial features first appear, the different tissue layer thickness can be calculated and used for statistical analysis in this work.10,24 As the tissue layer from stratum granulosum to stratum basale conventionally provides crucial diagnostic information during histopathological examination of precancers,7,10,25 we analyzed their NLO images in detail. Briefly, the density and area of nucleus in each TPEF image plane was determined through the use of ImageJ (NIH) and CellAnalyst (AssaySoft, Inc. version 2.0) software. Empirical trials indicated a mono-exponential function and a linear model were best fitted to calculate the changes of density and area of nucleus with tissue depth, respectively. The gradient coefficients from the two models were utilized for quantitative analysis of changes of nucleus density and area associated with the progress of precancer development. Fig. 1In vivo NLO spectral signals and TPEF images from normal squamous epithelial mucosa at different tissue depths. The NLO spectral signals excited at 745 and 600 nm are displayed in red and blue curves, respectively. The TPEF emission peaks of keratin, NADH, collagen, and tryptophan at 470, 450, and 350 nm are marked with asterisks, as well the collagen SHG peaked at 373 nm. The images at certain tissue depth displayed below the corresponding NLO spectral curves were formed with the TPEF signals excited at 745 and 600 nm, respectively. All TPEF images (shown in gray scale) are acquired at size in horizontal plane (- axis). The excitation light incident power at 745 and 600 nm on samples were approximately 25 and 12 mW, respectively. TPEF of collagen signal was magnified 10 times for visual clarity in (d).  Fig. 2Representative in vivo depth-resolved color-coded images formed with TPEF signals of keratin, NADH, collagen, and tryptophan in squamous epithelia mucosa, and SHG signals of collagenin stroma during precancerous tissue transformation process. For the different image stacks, the TPEF and SHG images excited at 745 nm are displayed on the left, while TPEF images excited at 600 nm are shown on the right. Measurement depth is labeled in μm on the left hand side of each image.  In this study, collagenous structural organization within the stroma layer was also investigated.8 In general, image spatial information from the 745-nm-induced SHG scattering of noncentrosymmetric collagen fibril was explored for texture and spatial frequency content analysis. A gray-level co-occurrence matrix (GLCM) analysis,26 based upon joint intensity probability distribution statistics belonging to pairs of neighboring pixels within an image, was utilized for texture analysis [GLCM texture analyzer module (v0.4) in ImageJ software (NIH)]; while, fast Fourier transform (FFT) analysis was used to determine the spatial frequency content of an image. As most of the spatial information are localized in the low spatial frequency domain at less than (excluding the ) (data not shown), a summed up approach of spatial frequency content less than was carried out and used in this investigative work.8 2.6.Quantification of Biochemical Information from TPEF and SHGTPEF lifetime parameters within the epithelia, and image intensities belonging to TPEF and SHG of collagen in stroma matrix were utilized for biochemical analysis. A dual exponential function model was employed to compute fluorescence lifetime parameters.24 The TPEF signals from all the pixels within an image at a tissue depth were integrated to calculate the representative time-decay for improving fitting accuracy. A custom-written global fitting algorithm that sets and as the global parameter for the spectral-resolved lifetime decay was subsequently employed for analysis in each TPEF image.27 Note that the tissue lifetime information within the same tissue layer are similar; therefore, TPEF lifetime signals in the stratum corneum and stratum granulosum–stratum basale were volume-averaged within corresponding tissue layers, respectively. To evaluate the changes of collagen network in stromal layer with the progress of precarcinogenesis, a ratiometric algorithm was employed to correlate intensities of TPEF and SHG belonging to collagen in stromal layer. It is basically computed through summation of pixels’ intensities possessing both TPEF and SHG collagen signals in an image plane, followed by the division of the TPEF by the SHG signals.8 2.7.Multivariate Statistical AlgorithmTo correlate the various diagnostic parameters for multiclass tissue classification, multiple discriminant analysis (MDA) was employed.28 MDA essentially determines linear discriminant functions that maximize the variances in the data between groups while minimizing the variation between members of the same group. It can generate a maximum of linear discriminant functions, where is the number of categories involved for classification. In this study, a three-class tissue classification algorithm was implemented. The overall accuracy rate of the trichotomous diagnostic algorithm derived for identifying different squamous tissue types was evaluated through a Mossman’s three way receiver operating characteristic (ROC).28 The Mossman’s three way ROC technique utilizes the correct classification rates [i.e., true-positive rate (sensitivity)] to construct a three-dimensional surface for the three-group tissue classification.28 The volume under the three-group ROC surface (VUS) provides the overall accuracy rate of trichotomous diagnostic algorithms for tissue diagnosis.28 One notes that a VUS of 0.17 indicates an accuracy of not better than random chance in classifying three different categories, while a VUS of 1.00 signifies a perfect accuracy rate. 3.Results3.1.In Vivo Multicolor Excitation NLO Signals and Images of Squamous MucosaFigure 1(a) to 1(d) exemplify the in vivo NLO emission spectra measured from various tissue depths from normal tissue at excitations of 745 and 600 nm, respectively. With 745 nm excitation, notable spectral peak at 470 nm, representing TPEF of keratin,16,21 can generally be observed in stratum corneum (SC), the topmost epithelial tissue that possesses indiscernible subcellular structures such as the nucleus. On the other hand, the TPEF signal of NADH peaked at 450 nm was found in the deeper epithelial tissues, the stratum granulosum–stratum basale (SG-SB) layer, which holds clear cellular and nucleus boundaries.16,21 Strong sharp peak signal at approximately 373 nm in tandem with faint broad TPEF emission peak around 450 nm were sequentially detected in stromal layer underlying SG-SB layer, where fibrous structures are abundant; these signals are indicative of SHG and TPEF signals of collagen, respectively, in the stroma matrix.16,21 With 600 nm excitation, prominent emission spectral peak at 350 nm, which indicates tryptophan,21 was typically found throughout the entire epithelia tissues layer, as well as in the stroma. The spectral curves in Fig. 1 clearly show that as long as the 600 nm excited tryptophan TPEF signal is not completely dominant, the interference of its tail to 745 nm excited TPEF signals is negligible. On the other hand, though SHG signal overlaps with tryptophan fluorescence, it can be easily separated from the fluorescence signal in time domain because SHG is prompt while the lifetime of tryptophan fluorescence is over 2 ns.21,22 Therefore, the two-color excitation NLO signals/images can be generated simultaneously and they are almost crosstalk-free. Figure 2 further illustrates the simultaneously generated TPEF and SHG images of squamous epithelium mucosa at varying tissue depths during the different stages of premalignancy progression (i.e., normal, mild dysplasia, moderate dysplasia, severe dysplasia/CIS). Enucleated cell in the SC layer, dark nucleus cells within the SG-SB layer can be consistently observed across the different intraepithelial neoplasia pathologies with 745 and 600 nm excitation wavelengths. Collagenous fiber structures in the stroma can be clearly visualized using 745 nm excitation in all pathologies. As a result, multicolor excitation TPEF and SHG-based multimodal microscopy enables label-free identification of distinctive tissue layers. It can effectively provide depth-resolved tissue structural (tissue architecture and cellular/subcellular morphology) and biochemical (TPEF spectral and temporal characteristics) information for epithelial pathology diagnosis. 3.2.Bio-Morphological and Biochemical Changes in Different Tissue SublayersAs shown in Fig. 2, the TPEF images excited at 745 and 600 nm in SC and SG-SB layers provide almost identical morphological information, while SHG and TPEF signals excited at 745 nm show clear fibrous structure of collagen network. In this work, we analyzed the 745 and 600 nm excited NLO images and derived a set of parameters to quantify the tissue architecture and cell morphology SC and SG-SB layers, while extracted texture and spatial parameters from the collagen network in stromal layer based on SHG images excited at 745 nm.7,8,10 Figure 3(a) to 3(f) presents the mean standard error (SE) of the parameters for various tissue pathologies in SC, SG-SB and stroma layers [i.e., normal (), mild dysplasia (), moderate dysplasia (), and severe dysplasia/CIS ()]. In comparison to normal, the thickness of SC and SG-SB layers are remarkably higher in all preneoplastic grades, while the gradients of epithelial cell density and cell nucleus area in the SG-SB layer are considerably lower. In stromal layer, the texture parameter of collagen fiber architecture, is notably lower in all precancerous grades, while the low spatial frequency content () is considerably higher. Kruskal-Wallis post hoc test from Statistica software (version 7.0, StatSoft, Tulsa, Oklahoma) was further applied to provide quantitative pairwise pathology comparisons.29 The diagnostic significances (-values) analysis results summarized in Table 1 showed remarkable alterations of all the tissue architectural and cellular/subcellular morphologic parameters associated with precancerous tissue transformation. Therefore, it is evident all tissue architectural and cellular/subcellular morphologic parameters derived from multimodal NLO imagesin the epithelial (4 features) and stroma layer (2 features) contain significant diagnostic utilities (). They can be used for differentiation among the various pathologies in association with premalignancy progression. Fig. 3Mean standard error (SE) of the tissue architecture and cellular/subcellular morphologic parameters for normal, mild dysplasia, moderate dysplasia, and severe dysplasia/CIS [i.e., normal (), mild dysplasia (), moderate dysplasia (), and severe dysplasia/CIS ()]: (a) stratum corneum (SC) layer thickness; (b) stratum granulosum–stratum basale (SG-SB) layer thickness; (c) SG-SB nucleus density gradient; (d) SG-SB cell nucleus area gradient; (e) texture analysis of stroma matrix collagen architecture; and (f) spatial frequency content () of stroma matrix collagen architecture. Note: 745 nm excitation light can generate various diagnostic parameters from SC to stroma layer, while the 600 nm excitation wavelength can yield features from SC to SG-SB epithelia sublayer. 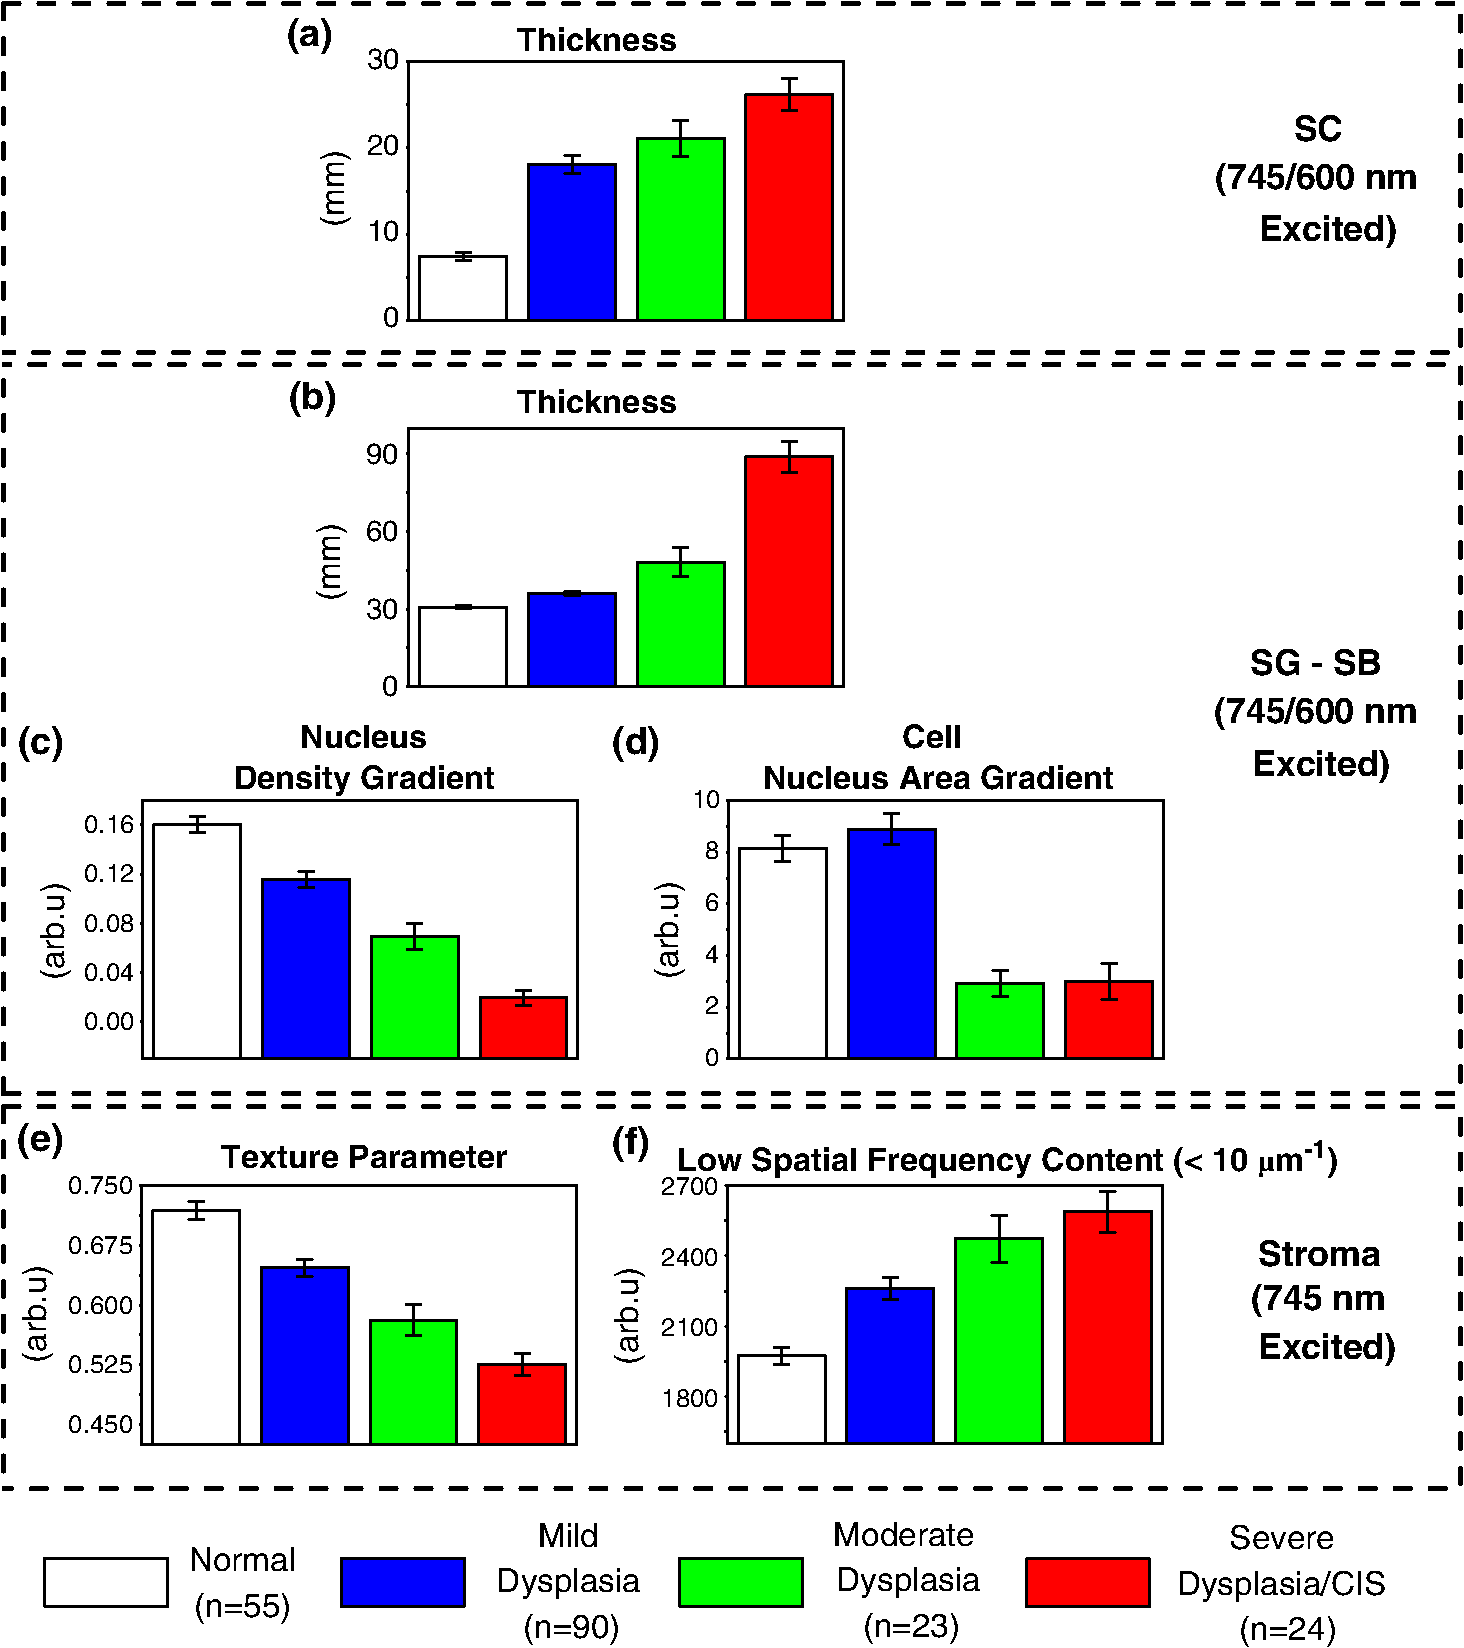 Table 1Diagnostic significance (p-value) based on Kruskal-Wallis post hoc mean ranking test for the various tissue architectural and cellular/subcellular morphologic parameters in association with different pathologies at disparate tissue layers.
Note: SC denotes stratum corneum; SG-SB represents stratum granulosum–stratum basale. p-values that are underlined denote statistical significance at p<0.05. As the multimodal imaging system was equipped with the ability to collect multiple NLO signals in spectral and time domains simultaneously, a variety of TPEF signals related to tissue biochemistry (i.e., collagen, NADH, keratin, and tryptophan) measured at different tissue layers can be analyzed. The mean SE of , , and values belonging to lifetime decay of 745 nm excited TPEF signals in SC and SG-SB layers, and TPEF/SHG intensity ratios in stromal layer are shown in Fig. 4(a) to 4(g); whereas, the lifetime parameters (i.e., , , and ) excited by 600 nm in SC and SG-SB layers are presented in Fig. 5(a) to 5(f). The corresponding statistical significances parameters (Kruskal-Wallis post hoc test derived -values) of the 745 and 600 nm excited biochemical parameters between pairwise pathology comparisons are displayed in Table 2. Clearly, in the SC layer, the 600 nm excited tryptophan signals were found to contain remarkable diagnostic information. Specifically, the lifetime ( and ) of tryptophan fluorescence signals were observed to increase notably with the development of precancers, whereas the values were shown to decrease significantly. In SG-SB layer, the lifetime of NADH and tryptophan TPEF signals excited at 745 and 600 nm were found to considerably decrease and increase, respectively. Probing deeper into the tissue where the stroma matrix was situated, the intensity ratio of TPEF/SHG from collagen using 745 nm excitation was observed to increase significantly with preneoplastic progression. Overall, three and four parameters from 745 and 600 nm excitation wavelengths, respectively, related to the tissue intrinsic biochemistry, are found to be diagnostically significant towards squamous precancers differentiation () (Table 2). Fig. 4Analysis of lifetime decay of 745 nm excited TPEF signals (NADH, keratin, and collagen). Mean SE of , , and values for various pathologies during progression of premalignancy [i.e., normal (), mild dysplasia (), moderate dysplasia (), and severe dysplasia/CIS ()] in the distinct squamous mucosa tissue layers.(a), (b), and (c):, , and in stratum corneum (SC); (d), (e), and (f): stratum granulosum–stratum basale (SG-SB) epithelia layers; and (g) intensity ratio of TPEF/SHG belonging to collagen in the stroma.  Fig. 5Analysis of lifetime decay of 600 nm excited TPEF tryptophan signals [i.e., normal (), mild dysplasia (), moderate dysplasia (), and severe dysplasia/CIS ()].(a), (b), and (c): mean SE of , , and values instratum corneum (SC); and (d), (e), and (f): stratum granulosum–stratum basale (SG-SB) epithelia layers.  Table 2Diagnostic significance (p-value) based on Kruskal-Wallis post hoc mean ranking test for the various multimodal nonlinear optical emission signals (i.e., TPEF of keratin, NADH, tryptophan, and collagen, SHG of collagen) in association with different pathologies at disparate tissue layers.
Note: SC denotes stratum corneum; SG-SB represents stratum granulosum–stratum basale. p-values that are underlined denote statistical significance at p<0.05. 3.3.Combinations of Multiple Diagnostic Feature Parameters for Precancer DetectionTo correlate the different diagnostic features for detection of squamous epithelial precancers, multiple discriminant analysis (MDA) was employed.28 Figure 6(a) illustrates the two-dimensional plot of the linear discriminant (LD) functions generated to separate the four different pathological groups (i.e., normal, mild dysplasia, moderate dysplasia, and severe dysplasia/CIS) using all 13 diagnostically significant parameters from the multicolor excitation listed in Tables 1 and 2 (). The data point of each tissue measurement site is plotted in the two-dimensional space defined by the LD functions. The points of all the measurement data belonging to the same pathology category are used to generate one SD confidence ellipse (i.e., 1SD away from the centroid of the scatter data points belonging to each tissue type). As the confidence ellipses of moderate dysplasia, and severe dysplasia/CIS typically overlapped with each other significantly, the two pathology categories were grouped together as high-risk squamous intraepithelial neoplasia (SIN). This resulted in a single confidence ellipse denoting all SIN data points. It is evident that the confidence ellipse of mild dysplasia (low-risk SIN) overlay marginally with normal and high-risk SIN, while the confidence ellipses of normal and high-risk SIN are distinctively apart. For a quantitative analysis of the diagnostic efficacies for separation of normal, low- and high-risk SIN, a three-dimensional ROC were utilized.28 The trichotomous ROC [Fig. 6(b)] generated from the corresponding scatter plot [Fig. 6(a)] provide respective volume under the ROC surface (VUS) of 0.734 for squamous precancer tissue pathology classification. Fig. 6(a) Two-dimensional scatter plot of the two discriminant functions belonging to the different squamous epithelial pathology categories, coupled with generation of one standard deviation (SD) confidence ellipses for normal, low- and high-risk squamous intraepithelial neoplasia (SIN); circle: normal (); blue triangle: mild dysplasia (); green square: moderate dysplasia (); red square: severe dysplasia/CIS (); black line ellipse: normal; blue line ellipse: low-risk SIN; and orange line ellipse: high-risk SIN. (b) Three-dimensional receiver operating characteristic (ROC) surface to illustrate the efficacy for separation between the different squamous mucosa pathologies using through the combined employment of 745 and 600 nm. Note: a total of 13 features consisting of all image-derived features from stratum-corneum to stroma (), and biochemical parameters from TPEF of keratin, NADH in the epithelial, TPEF and SHG signals of collagen in the stroma (), and TPEF of tryptophan in the epithelial layer () were used; TPR denotes true-positive rate (i.e., sensitivity). (c) ROC volume under the surface (VUS) of using all diagnostically significant features from 745 and 600 nm wavelength alone ( and , respectively) and in combination () (color online only).  As displayed in Fig. 6(c), an analysis of the diagnostic utilities through using features from 745 nm excitation alone (six image-derived features from stratum corneum to stroma and three biochemical information from keratin, NADH, and collagen) showed VUS of 0.647, while with 600 nm excitation alone (4 image-derived features in the epithelial and 4 tryptophan biochemistry signals) VUS is 0.695. This indicated that 600 nm excited NLO signals provide considerably higher diagnostic value than 745 nm excited signals. In comparison with the results using features from both 745 and 600 nm excitation, it is confirmed that the integration of diagnostically significant features extracted from the multicolor excitation wavelengths provides improved diagnostic accuracy. To further determine the robustness of the 13 features employed for precancer diagnosis, leave-one animal-out (all data associated with the animal), cross-validation technique was also applied to the MDA algorithm.28 Predictive sensitivity and specificity of 85.4% () and 92.7% (), respectively, were achieved for squamous precancer detection from normal tissues, whilst diagnostic sensitivity of 83.0% () and specificity 80.0% () were yielded for differentiating high-risk SIN from the low-risk intraepithelial lesion (i.e., mild dysplasia). The high sensitivities and specificities demonstrate the multicolor excitation-multimodal NLO imaging to provide extensive valuable information for in vivo noninvasive diagnosis of squamous intraepithelial neoplasia. 4.Discussions4.1.NLO Signals/Images Excited at 600 nmIn this work, we discovered that new excitation light at 600 nm for TPEF imaging improved the diagnostic capability of NLO microscopy for squamous precancer diagnosis in situ. Our results determine, for the first time, the TPEF lifetime parameters of tryptophan within the keratinized or keratinizing layer (stratum corneum), and the nonkeratinized layer (stratum granulosum—stratum basale) to alter significantly with precancerous squamous tissue development in vivo. Specifically, time decay of tryptophan TPEF signal within the stratum corneum layer was unraveled to alter significantly with precancerous development in squamous epithelial tissue. As the stratum corneum layer is generally keratinized or keratinizing, the dense network of keratin, possibility of various types, is expected;30 hence, we studied TPEF from different keratin subtypes at 600 nm excitation (data not shown). We observed strong tryptophan TPEF emission peaked at 350 nm from all the keratin subtype samples. Therefore, it is highly possible that the strong TPEF tryptophan signals measured from the stratum corneum in vivo arises from keratin proteins.31 The discovery of rich diagnostic information from TPEF signals of stratum corneum is essentially in good agreement with histopathological findings, which affirmed the extent of keratinization in stratum corneum in SCC is usually altered (lower) as compared to normal tissues (i.e., dysplasia and SCC: keratinizing stratum corneum; normal: keratinized stratum corneum).32 The fluorescence lifetime of tryptophan, one of the fundamental amino acids serving as the building block of protein molecule such as keratins, can capture the subtle change of keratin expression information occurring at the molecular level within stratum corneum in vivo. On the other hand, in the supra-basal epithelia layer, we found the long lifetime component of 600 nm excited tryptophan TPEF signal to increase notably with precancerous progression. This is most likely due to changes of epithelia intracellular microenvironment with precancerous progression.33,34 For example, the modification of preferred binding sites in tumor tissue could influence the microenvironment of proteins near to the binding sites (e.g., carboxyl-terminal binding protein).35 In general, our results elucidated novel valuable diagnostic parameters in association with TPEF of tryptophan within the different tissue layers of epithelia for detection of squamous intraepithelial neoplasia. Further study is on-going to accurately determine the spectral origin of the TPEF emission at 600 nm from the different tissue layers that will change with dysplastic tissue transformation. 4.2.NLO Signals/Images Excited at 745 nmWith 745 nm excitation, we found various diagnostically significant parameters from stratum corneum to stroma. In particular, the keratin signal within stratum corneum was found to be of diagnostic significance, which is consistent with literature findings on the notable changes of NIR excited (e.g., 780 nm)-keratin fluorescence in precancerous and cancerous squamous epithelial tissues.7,14 However, the diagnostic utility is found to be less as compared to the signals excited by 600 nm in the same tissue layer (Table 2). The limited diagnostic significance of the 745 nm excitation layer most probably is due to the fact that the optimal two photon absorption wavelength band of NADH lies near 700 nm;15 therefore, with 745 nm excitation, the diagnostic utility of TPEF of keratin will be compromised due to signal contamination from TPEF of NADH at the stratum corneum and underlying epithelial layer.14 Nevertheless, within the suprabasal tissue layer, we observed a significant decrease of protein-bound NADH TPEF signal, the long lifetime component (), with squamous intraepithelial neoplasia progression. This result is consistent with literature findings of reduction in TPEF of NADH from precancerous lesions relative to normal tissues,7,10 indicating changes of distribution of NADH enzyme binding sites in preneoplastic tissues.7 On top of the premalignancy related changes occurring in the epithelial layer, we further studied the biochemical changes occurring in stroma tissue underlying the epithelial layer. Our results indicated intensities of TPEF and SHG of collagen to increase and decrease, respectively, with precancerous tissue transformation. Consequently, the TPEF/SHG index is higher for preneoplastic tissues as compared to normal. The results are in good agreement with the ex vivo study of collagen TPEF and SHG signals in normal and neoplastic tissue.36 From SHG and TPEF images excited at 745 nm, we also observed distinct changes of stroma architecture with precancerous development. Specifically, the mesh-like stoma matrix of normal tissue becomes progressively less dense and collagen fibers become more aggregated with precarcinogenesis process. Through morphological analysis using gray-level co-occurrence matrix (GLCM) and fast Fourier transform (FFT),8 it was further revealed the GLCM values to reduce with premalignancy progression, while the FFT metric representing the low spatial frequency content of stroma to increase. The decrease of GLCM index suggests the increase of dissimilar structure contents within stroma with the development of precancers. On the other hand, the rising FFT value indicates the generation of more short structure fiber assemblies in the stromal matrix during premalignancy progression. These stroma matrix aberrations strongly indicate the degradation of collagenous fibers during intraepithelial carcinomatous pathology. The findings are highly consistent with molecular findings of significant up-regulation of matrix metalloproteinase (MMP) (e.g., MMP-9) during dysplastic pathologic stage of stratified squamous epithelial tissues such as cervix and oral.37,38 Since the SHG signal is produced due to collagen of noncentrosymmetric structure, the decomposition of stromal matrix in precancerous tissue most likely results in the decrease of SHG signals. A recent in vitro study demonstrated SHG and TPEF to alter in a reverse tendency during a reduction in collagen cross-linkage.39 Hence, the observation of decrease and increase of SHG and TPEF of collagen, respectively, in this study, could also be as a result of changes in cross-linkages. Further work to elucidate the change of collagen nonlinear optical signals during preneoplasia progression is certainly warranted. 4.3.Combination of NLO Signals Excited at 600 and 745 nmGiven the great wealth of diagnostic information ranging from tissue architecture, cellular/subcellular morphologic, to biochemical information emanating from different stratified tissue depths, which can be collected with multicolor multimodal nonlinear optical microscopy system, it is pivotal to assess the diagnostic accuracy and robustness of combining these different types of features together for precancer detection.40 With sophisticated multivariate statistical techniques (i.e., MDA coupled with VUS27), we demonstrated the integration of disparate feature categories from 745 and 600 nm excitations to substantially improve (as compared to using 745 and 600 nm alone) diagnostic utility for discriminating the various intraepithelial neoplasia lesions from normal [Fig. 6(c)]. 5.ConclusionsThis work demonstrates for the first time (to our knowledge) that multicolor excitation based multimodal NLO microscopy system produced a great wealth of diagnostic information ranging from tissue architecture, cellular/subcellular morphology, to biochemical information emanating from different stratified tissue depths. In particular, our results elucidated stratum corneum to contain significant diagnostic information for identifying precancers in vivo. Furthermore, we showed the multitude of diagnostic information from the different tissue layers can be effectively integrated to provide high performance diagnostic algorithm for identifying squamous epithelial precancer. These results affirm the efficacy of the novel multicolor excitation to produce a wide range of TPEF and SHG signals for clinical squamous premalignancy diagnosis application in vivo. AcknowledgmentsThe authors acknowledge support from the Hong Kong Research Grants Council through grants 662711, N_HKUST631/11, and T13-706/11-1, and from the Hong Kong University of Science and Technology through grant RPC06/07.EG06. Additionally, we would also like to thank the technical supports from Mr. Wong Pak Kin, Mr. Tong Wai Man, and Mr. Chui Ying Yip at the University of Hong Kong. ReferencesM. P. Marinkovich,
“Tumour microenvironment: laminin 332 in squamous-cell carcinoma,”
Nat. Rev. Cancer, 7
(5), 370
–380
(2007). http://dx.doi.org/10.1038/nrc2089 NRCAC4 1474-175X Google Scholar
H. M. Mehannaet al.,
“Treatment and follow-up of oral dysplasia—a systematic review and meta-analysis,”
Head Neck, 31
(12), 1600
–1609
(2009). http://dx.doi.org/10.1002/hed.21131 HEANEE 1097-0347 Google Scholar
S. Fedele,
“Diagnostic aids in the screening of oral cancer,”
Head Neck Oncol., 1 5
(2009). http://dx.doi.org/10.1186/1758-3284-1-5 HNOEAE 1758-3284 Google Scholar
M. Arbynet al.,
“Pooled analysis of the accuracy of five cervical cancer screening tests assessed in eleven studies in Africa and India,”
Int. J. Cancer, 123
(1), 153
–160
(2008). http://dx.doi.org/10.1002/ijc.23489 IJCNAW 0020-7136 Google Scholar
W. R. ZipfelR. M. WilliamsW. W. Webb,
“Nonlinear magic: multiphoton microscopy in the biosciences,”
Nat. Biotechnol., 21
(11), 1369
–1377
(2003). http://dx.doi.org/10.1038/nbt899 NABIF9 1087-0156 Google Scholar
F. HelmchenandW. Denk,
“Deep tissue two-photon microscopy,”
Nat. Methods, 2
(12), 932
–940
(2005). http://dx.doi.org/10.1038/nmeth818 1548-7091 Google Scholar
M. C. Skalaet al.,
“In vivo multiphoton microscopy of NADH and FAD redox states, fluorescence lifetimes, and cellular morphology in precancerous epithelia,”
Proc. Nat. Acad. Sci. U. S. A., 104
(49), 19494
–19499
(2007). http://dx.doi.org/10.1073/pnas.0708425104 PNASA6 0027-8424 Google Scholar
W. Zhenget al.,
“Diagnostic value of nonlinear optical signals from collagen matrix in the detection of epithelial precancer,”
Opt. Lett., 36
(18), 3620
–3622
(2011). http://dx.doi.org/10.1364/OL.36.003620 OPLEDP 0146-9592 Google Scholar
R. Cicchiet al.,
“Time- and spectral-resolved two-photon imaging of healthy bladder mucosa and carcinoma in situ.,”
Opt. Express, 18
(4), 3840
–3849
(2010). http://dx.doi.org/10.1364/OE.18.003840 OPEXFF 1094-4087 Google Scholar
M. C. Skalaet al.,
“Multiphoton microscopy of endogenous fluorescence differentiates normal, precancerous, and cancerous squamous epithelial tissues,”
Cancer Res., 65
(4), 1180
–1186
(2005). http://dx.doi.org/10.1158/0008-5472.CAN-04-3031 CNREA8 0008-5472 Google Scholar
R. M. Williamset al.,
“Strategies for high-resolution imaging of epithelial ovarian cancer by laparoscopic nonlinear microscopy,”
Transl. Oncol., 3
(3), 181
–194
(2010). Google Scholar
M. C. Skalaet al.,
“In vivo multiphoton fluorescence lifetime imaging of protein-bound and free nicotinamide adenine dinucleotide in normal and precancerous epithelia,”
J. Biomed. Opt., 12
(2), 024014
(2007). http://dx.doi.org/10.1117/1.2717503 JBOPFO 1083-3668 Google Scholar
E. Dimitrowet al.,
“Sensitivity and specificity of multiphoton laser tomography for in vivo and ex vivo diagnosis of malignant melanoma,”
J. Invest. Dermatol., 129
(7), 1752
–1759
(2009). http://dx.doi.org/10.1038/jid.2008.439 JIDEAE 0022-202X Google Scholar
J. M. Levittet al.,
“Automated biochemical, morphological, and organizational assessment of precancerous changes from endogenous two-photon fluorescence images,”
PLoS One, 6
(9), e24765
(2011). http://dx.doi.org/10.1371/journal.pone.0024765 1932-6203 Google Scholar
S. HuangA. A. HeikalW. W. Webb,
“Two-photon fluorescence spectroscopy and microscopy of NAD(P)H and flavoprotein,”
Biophys. J., 82
(5), 2811
–2825
(2002). http://dx.doi.org/10.1016/S0006-3495(02)75621-X BIOJAU 0006-3495 Google Scholar
W. Zhenget al.,
“Autofluorescence of epithelial tissue: single-photon versus two-photon excitation,”
J. Biomed. Opt., 13
(5), 054010
(2008). http://dx.doi.org/10.1117/1.2975866 JBOPFO 1083-3668 Google Scholar
A. A. RehmsandP. R. Callis,
“Two-photon fluorescence excitation spectra of aromatic amino acids,”
Chem. Phys. Lett., 208
(3–4), 276
–282
(1993). http://dx.doi.org/10.1016/0009-2614(93)89075-S CHPLBC 0009-2614 Google Scholar
W. Zhenget al.,
“Optimal excitation-emission wavelengths for autofluorescence diagnosis of bladder tumors,”
Int. J. Cancer, 104
(4), 477
–481
(2003). http://dx.doi.org/10.1002/ijc.10959 IJCNAW 1097-0215 Google Scholar
C. K. Brookneret al.,
“Autofluorescence patterns in short-term cultures of normal cervical tissue,”
Photochem. Photobiol., 71
(6), 730
–736
(2000). http://dx.doi.org/10.1562/0031-8655(2000)0710730APISTC2.0.CO2 PHCBAP 0031-8655 Google Scholar
L. Brancaleonet al.,
“In vivo fluorescence spectroscopy of nonmelano maskin cancer,”
Photochem. Photobiol., 73
(2), 178
–183
(2001). http://dx.doi.org/10.1562/0031-8655(2001)0730178IVFSON2.0.CO2 PHCBAP 0031-8655 Google Scholar
D. LiW. ZhengJ. Y. Qu,
“Imaging of epithelial tissue in vivo based on excitation of multiple endogenous nonlinear optical signals,”
Opt. Lett., 34
(18), 2853
–2855
(2009). http://dx.doi.org/10.1364/OL.34.002853 OPLEDP 0146-9592 Google Scholar
D. LiW. ZhengJ. Y. Qu,
“Two-photon autofluorescence microscopy of multicolor excitation,”
Opt. Lett., 34
(2), 202
–204
(2009). http://dx.doi.org/10.1364/OL.34.000202 OPLEDP 0146-9592 Google Scholar
J. J. Salley,
“Experimental carcinogenesis in the cheekpouch of the Syrian hamster,”
J. Dent. Res., 33
(2), 253
–262
(1954). http://dx.doi.org/10.1177/00220345540330021201 JDREAF 0022-0345 Google Scholar
Y. WuJ. Y. Qu,
“Combined depth- and time-resolved autofluorescence spectroscopy of epithelial tissue,”
Opt. Lett., 31
(12), 1833
–1835
(2006). http://dx.doi.org/10.1364/OL.31.001833 OPLEDP 0146-9592 Google Scholar
K. T. BradleyS. D. BudnickS. Logani,
“Immunohistochemical detection of p16INK4a in dysplastic lesions of the oral cavity,”
Mod. Pathol., 19
(10), 1310
–1316
(2006). http://dx.doi.org/10.1038/modpathol.3800649 MODPEO 0893-3952 Google Scholar
R. Cicchiet al.,
“Scoring of collagen organization in healthy and diseased human dermis by multiphoton microscopy,”
J. Biophoton., 3
(1–2), 34
–43
(2010). http://dx.doi.org/10.1002/jbio.200910062 JBOIBX 1864-063X Google Scholar
W. ZhengD. LiJ. Y. Qu,
“Monitoring changes of cellular metabolism and microviscosity in vitro based on time-resolved endogenous fluorescence and its anisotropy decaydynamics,”
J. Biomed. Opt., 15
(3), 037013
(2010). http://dx.doi.org/10.1117/1.3449577 JBOPFO 1083-3668 Google Scholar
S. K. Tehet al.,
“Near-infrared Raman spectroscopy for optical diagnosis in the stomach: identification of Helicobacter-pylori infection and intestinal metaplasia,”
Int. J. Cancer, 126
(8), 1920
–1927
(2010). http://dx.doi.org/10.1002/ijc.24935 IJCNAW 1097-0215 Google Scholar
W. H. Kruskalet al.,
“Use of ranks in one-criterion variance analysis,”
J. Am. Stat. Assoc., 47
(260), 583
–621
(1952). http://dx.doi.org/10.2307/2280779 JSTNAL 0003-1291 Google Scholar
H. H. BragullaD. G. Homberger,
“Structure and functions of keratin proteins in simple, stratified, keratinized and cornified epithelia,”
J. Anat., 214
(4), 516
–559
(2009). http://dx.doi.org/10.1111/j.1469-7580.2009.01066.x JOANAY 0021-8782 Google Scholar
G. J. Smithet al.,
“Fluorescence of tryptophan in keratin,”
J. Photoch. Photobio., 32
(6), 715
–718
(1980). http://dx.doi.org/10.1111/j.1751-1097.1980.tb04047.x 1389-5567 Google Scholar
J. W. Saidet al.,
“Involucrin in squamous and basal cell carcinomas of the skin: an immuno histochemical study,”
J. Invest. Dermatol., 82
(5), 449
–452
(1984). http://dx.doi.org/10.1111/1523-1747.ep12260937 JIDEAE 0022-202X Google Scholar
D. LiW. ZhengJ. Y. Qu,
“Time-resolved spectroscopic imaging reveals the fundamentals of cellular NADH fluorescence,”
Opt. Lett., 33
(20), 2365
–2367
(2008). http://dx.doi.org/10.1364/OL.33.002365 OPLEDP 0146-9592 Google Scholar
D. K. Birdet al.,
“Metabolic mapping of MCF10A human breast cells via multiphoton fluorescence lifetime imaging of the coenzyme NADH,”
Cancer Res., 65
(19), 8766
–8773
(2005). http://dx.doi.org/10.1158/0008-5472.CAN-04-3922 CNREA8 0008-5472 Google Scholar
C. C. FjeldW. T. BirdsongR. H. Goodman,
“Differential binding of NAD+ and NADH allows the transcriptional corepress or carboxyl-terminal binding protein to serve as a metabolic sensor,”
Proc. Nat. Acad. Sci. U. S. A., 100
(16), 9202
–9207
(2003). http://dx.doi.org/10.1073/pnas.1633591100 PNASA6 0027-8424 Google Scholar
S. J. Linet al.,
“Discrimination of basal cell carcinoma from normal dermal stroma by quantitative multiphoton imaging,”
Opt. Lett., 31
(18), 2756
–2758
(2006). http://dx.doi.org/10.1364/OL.31.002756 OPLEDP 0146-9592 Google Scholar
R. C. Jordanet al.,
“Overexpression of matrix metalloproteinase-1 and -9mRNA is associated with progression of oral dysplasia to cancer,”
Clin. Cancer Res., 10 6460
–6465
(2004). http://dx.doi.org/10.1158/1078-0432.CCR-04-0656 CCREF4 1078-0432 Google Scholar
N. Schröeret al.,
“Molecular pathobiology of human cervical high-grade lesions: paracrine STAT3 activation in tumor-instructed myeloid cells drives local MMP-9 expression,”
Cancer Res., 71
(1), 87
–97
(2011). http://dx.doi.org/10.1158/0008-5472.CAN-10-2193 CNREA8 0008-5472 Google Scholar
V. Lutzet al.,
“Impact of collagen cross linking on the second harmonic generation signal and the fluorescence lifetime of collagen autofluorescence,”
Skin Res. Technol., 18
(2), 168
–179
(2012). http://dx.doi.org/10.1111/j.1600-0846.2011.00549.x 0909-752X Google Scholar
S. K. Tehet al.,
“Label-free multicolor excitation-multimodal nonlinear optical microscopy for early diagnosis of squamous intraepithelial neoplasia in vivo,”
in Conf. Proc. Biomedical Optics and 3D Imaging,
(2012). Google Scholar
|
|||||||||||||||||||||||||||||||||||||||||||||||||||||||||||||||||||||||||||||||||||||||||||||||||||||||||||||||||||||||||||||||||||||||||||||||||||||||||||||||||||||||||||||||||||||||||||||


