|
|
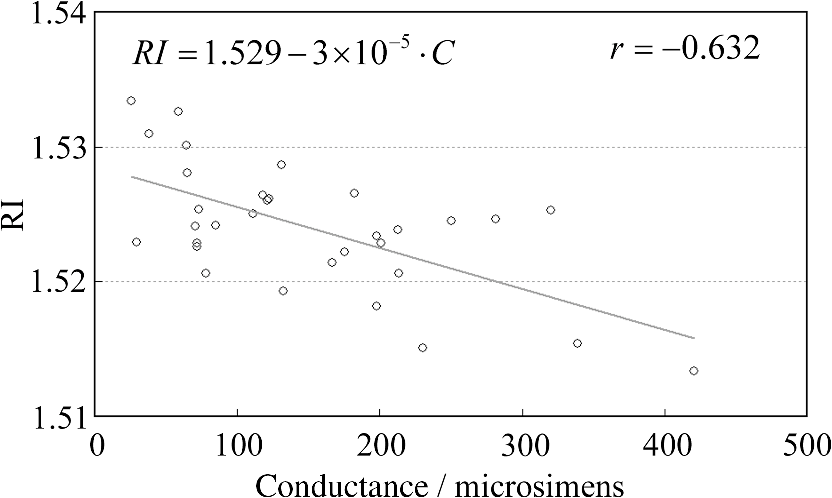
1.IntroductionThe refractive index (RI) of skin is an important parameter that indicates the condition of skin. It also defines the characteristics of light reflection from skin. Therefore, it has been recognized as an important parameter in applications such as laser therapy1 and cosmetics.2 Various methods have been developed for measuring RI. Methods for measuring skin RI can be broadly categorized into two kinds based on their measurement area and depth. One class of methods measure the average RI between two interfaces (e.g., the upper and lower surfaces of the epidermis); they utilize the difference between the physical and optical distances between the interfaces.3–5 The other class of measurements measures the RI of an area close to a surface and utilizes the relationship between the incident angle and the reflectance.6–12 In the case of in vivo measurements of skin, the measurement depth is important because the amount of water varies dramatically with depth, and it generates a gradient in the RI with depth.13,14 In evaluating the behavior of light at the air-skin interface, the latter class of measurements is more appropriate since those measurements are considered to be sensitive to the ratio of surface reflection to interior reflection.1,2,15 The ultimate goal of our research is to measure in vivo the RI of a superficial area of a cornified layer. However, since this is difficult, most studies have performed ex vivo measurements of slices of skin.10–12 The main source of difficulty of in vivo measurements is undulations in the skin surface.16 RI measurements generally require precise measurement of the reflectance as a function of the incident angle at the interface between a prism and a sample. Consequently, a flat sample surface is needed to ensure good contact between the prism and the sample. Hence, some modification is required to apply this method to samples with rough surfaces. In some studies, the sample was pressed against the prism with great pressure so as to achieve good contact.11,12 However, this method is not suitable for in vivo measurements. Another significant problem of in vivo measurements is their long acquisition time, which is inconvenient for the subject. Furthermore, skin conditions will change over time since the water content varies due to occlusions. Due to these difficulties, almost all previous studies performed ex vivo measurements of skin slices. but doing this causes other problems. First, this method is destructive. In addition, after being cut off, skin will dry out since its water supply is disrupted, and that changes its RI.1,17 To make the conditions of samples close to those of living skin and to increase the contact area, other studies have used saline10–12 or high-RI immersion oil.17 However, various kinds and amounts of liquid are applied, and these factors will affect the RI. Therefore, in vivo measurements are desirable for evaluating the RI under different conditions and for different individuals. In this report, we modify the critical angle method for partial contact to realize in vivo measurements of the RI of skin. We then evaluate the feasibility of this method by performing in vivo measurements of silicone samples and human skin. We also discuss the effect of absorption, which is disregarded in the proposed method. 2.Materials and Methods2.1.Critical Angle Method for Partial ContactThe critical angle method is commonly used to take an accurate measurement of the RIs of liquids, but it assumes that no absorption occurs and that there is total contact between the probe and sample.7,18 Assuming that light is incident on the interface from a medium with an RI of to a medium with an RI of , the reflectance will be 1 for incident angles larger than or equal to the critical angle: where .6,8,9 On the other hand, the reflectance decreases rapidly as the incident angle decreases from the critical angle. This allows the critical angle to be determined easily and precisely, especially for -waves. In the critical angle method, the RI of a sample is determined from Eq. (1) using a prism with a known RI of and measuring . This method is not usually used for solid materials with rough surfaces since partial contact makes indistinct.Here, we assume that the reflection for a prism can be expressed as a simple sum of reflections from areas that are in contact and reflections from areas that are not in contact. In this case, the variation of the reflectance near the critical angle will be indistinct due to mixing of light reflected from areas in contact and from areas that are not in contact. However, the critical angle still exists. Since the RI of air () is much smaller than that of skin (),1 the reflectance from a noncontact area will be 1 when the incident angle is near the critical angle of skin. Based on the above assumption, the reflectance can be expressed as a function of the incident angle as Here, is the incident angle, is the reflectance of an area where there is contact, and is the ratio of the contact area to the total area. The first and second terms in Eq. (2) correspond to areas in contact and areas not in contact, respectively. The Fresnel equation can be substituted for . According to Eq. (2), even when there is partial contact between the prism and the sample, the critical angle can still be determined provided that is sufficiently high. Since human skin is flexible, this condition is achievable.2.2.Measurements and Data AnalysisThe instrument shown in Fig. 1 was used for RI measurements. Light from the light source (LA-180Me, Hayashi Watch-Works, Tokyo, Japan) passes through a bandpass filter (43178-H, Edmund Optics, Barrington, New Jersey; center wavelength: 550 nm; full width at half maximum: 10 nm) and an aperture. Then it is spread out by a diffuser, and is collimated by two convex lenses before it strikes the equilateral-triangular prism (SFL11, Edmund Optics; RI at 550 nm: 1.791). It illuminates a sample after passing through the prism. The light spot on the sample was about 5 mm in diameter. A polarizer was inserted between two convex lenses to generate a -wave. The reflected light was recorded by a camera (D200, Nikon, Tokyo, Japan) with an attached lens (Ai Nikkor, Nikon; 50 mm f/1.2S). The focal point of the lens was set at infinity, so each position of the acquired image can be associated with each incident angle. The exposure time was set to , and the aperture was set to f/1.2. The prism and the camera could be rotated independently about the center of the prism to allow for variations in RI; their positions varied according to the sample used (i.e., silicone or skin). From the images taken with the system shown in Fig. 1, the correlation between the reflectance and the incident angle was obtained. Below, the protocol is explained using data from Experiment 1. First, images without a sample (when the prism is contact with air) and images with a sample were obtained. They were saved as raw data () and then converted to Tagged Image File Format (TIFF) images () whose pixel values vary linearly with the light intensity (Fig. 2). The difference between adjacent pixels was approximately 0.004 deg in incident angle. The pixel values along the horizontal center line (see Fig. 2) were extracted. Next, the reflectance was derived by dividing the pixel values by the corresponding pixel values in the image obtained without a sample (i.e., pixel values when the reflectance is unity). The repeatability error of the pixel value was evaluated from duplicate measurements of air [the condition shown in Fig. 2(a)], and the standard deviation (SD) of the reflectance was found to be 0.15%. Fig. 2Representative examples of linear images (i.e., the intensity is linear) of the green channel for Experiment 1. Each point on the broken lines in the images is correlated with each incident angle. (a) No sample, (b) sample with flat surface, (c) sample with rough surface. The reflectance of each incident angle was obtained along the broken lines. 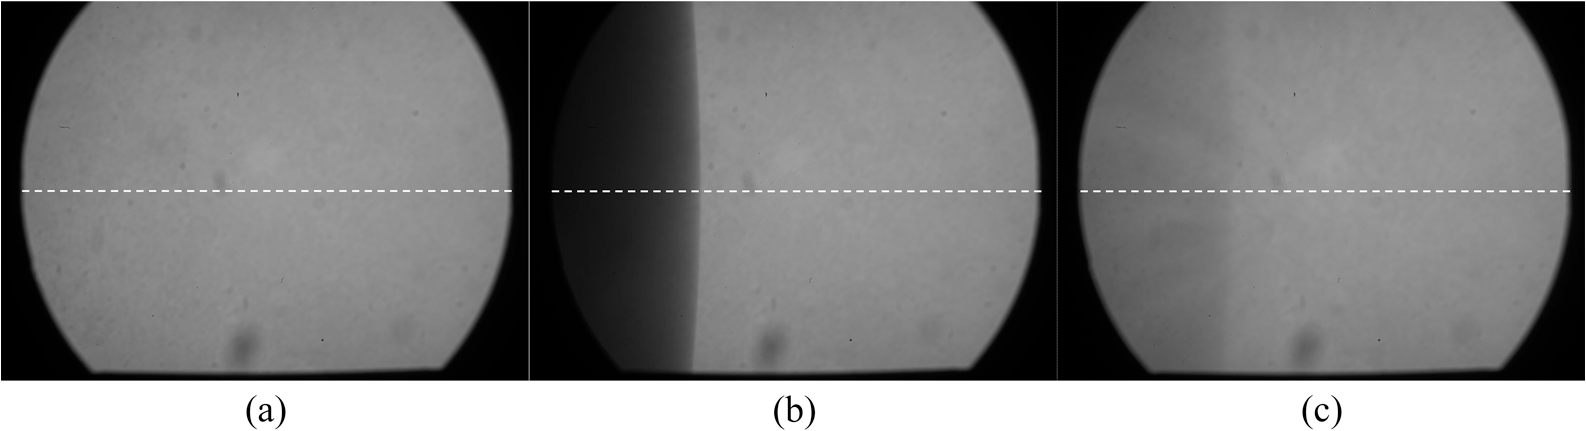 Using the relationship between the incident angle and the pixel position, a plot of reflectance against incident angle was obtained [Fig. 3(a)]. The relationship between the incident angle and the position in the image was determined from data obtained in advance by performing measurements using an RI-matching liquid (Cargille Laboratories, Cedar Grove, New Jersey). From the position of the critical angle of liquids, the incident angle was correlated with the horizontal axis in the images by making a linear approximation. Fig. 3Reflectance as a function of incident angle for flat and rough surfaces: (a) reflectance and (b) fitting results. Gray line: flat surface; black line: rough surface. The broken line indicates the fitting results. For clarity, the area near the critical angle was enlarged and the -axis of each sample was shifted in (b). The profiles are the averages of multiple measurements of each sample.  A profile of reflectance against incident angle was approximated by two lines [Fig. 3(b)] with tangents of and that are connected at the point : was taken to be the critical angle. The four parameters , , , and were calculated from the profile as an optimization problem. Specifically, the “fminsearch” function in MATLAB software (Mathworks, Natick, Massachusetts) that implements the Nelder-Mead simplex method was used. The area to be fixed was defined visually. Although Eq. (2), in which the Fresnel equation is substituted for , is theoretically rigorous, the optimization problem did not converge well. This is probably due to several errors and the degrees of freedom of , which make the prediction ambiguous. In the approximation, the estimation of will not be affected by , which can be confirmed by substituting Eq. (3) for in Eq. (2). Furthermore, will not be affected by fluctuations in the light source intensity, provided the fluctuation percentage is constant.2.3.Silicone SamplesSilicone samples with flat and rough surfaces were prepared using a transparent, room-temperature-curing silicone resin [KE-108 (condensed); Shin-Etsu Silicones, Tokyo, Japan] as a base. A catalyst (CAT-108, Shin-Etsu Silicones) was added to KE-108, and the mixture was poured into a mold. Rough surfaces were formed by taking the topography of the surface of the forearm of a 38-year-old male using polyether impression material (Impregum Soft, Sumitomo 3M, Tokyo, Japan) and using it as a part of the mold to imitate the topography of actual skin. The RI obtained by the dipping method was . 2.4.Conductance (Water Content) MeasurementsThe conductance, which is expected to reflect the water content,19,20 was measured using a Skicon 200 EX instrument (IBS, Shizuoka, Japan) along with RI. In addition to the conductance method, capacitance measurements are considered to be a straightforward method for evaluating moisture content.19,20 However, conductance measurements are more suitable than capacitance measurements in the present case since conductance depends more on the water content of shallower regions than does capacitance.19,20 2.5.Experiment 1: Silicone SamplesThe RIs of silicone samples with flat and rough surfaces were measured to verify the assumption stated in Sec. 2.1. Each area was measured several times, and the average was taken. 2.6.Experiment 2: In Vivo Measurements of Human Skin (Cheek)The left and right cheeks of Japanese adult females () in their 20 to 40 s were measured. After removing makeup and washing her face, each subject remained in a controlled room (temperature: 20°C; relative humidity: 40%) for over 20 min. The conductance and RI of the left and right cheeks were then measured. Each site was measured five times, and the average was taken. 3.Results3.1.Experiment 1: Silicone SamplesFrom the acquired images (Fig. 2), the intensity of the reflected light was derived as a function of the incident angle. Then it was converted to reflectance [Fig. 3(a)] and fitted using Eq. (3) [Fig. 3(b)]. The profile shown in Fig. 3 represents the average of multiple measurements. The number of measurements performed for flat and rough surfaces are 10 and 37, respectively. The RIs of the flat and rough surfaces were calculated to be 1.407 () and 1.408 (), respectively (Fig. 4). These average values are very similar, while the SD of the rough surface is larger than that of the flat surface. 3.2.Experiment 2: In Vivo Measurements of Human Skin (Cheek)Figure 5 shows a representative example of the profile of human skin (cheek) and the result of fitting. This representative profile was compared to Eq. (2), obtained using the Fresnel equation with complex RIs () and varying [Fig. 6(a)]. Here, was set to the estimated RI, and was visually selected to make the range of the theoretical profile fit the range of the measured profile. The value of that gave the closest profile to the measured profile (in terms of sharpness of the shoulder) was 0.004. A representative profile was compared to Eq. (2), with varying [Fig. 6(b)]. The value of for the closest profile to the measured profile near the shoulder was 1.513. Fig. 5Representative example of skin reflectance as a function of the incident angle and fitting results. The RI of this measurement was . The fitting range for this profile was set to 56.8 deg to 59.7 deg (indicated by the two vertical broken lines).  Fig. 6Theoretical profiles of reflectance as a function of incident angle from Eq. (2), with the Fresnel equation varying complex RI () with the measured profile (as in Fig. 5, ). . (a) With constant of 1.521, was set to 0, 0.002, 0.004, 0.01, and 0.02. (b) With constant of 0.004, was set to 1.521, 1.513, and 1.505 (interval of 0.008).  RI was plotted against the conductance at each site (i.e., two points on the left and right cheek of each subject) (Fig. 7). There is a significant correlation between the conductance and RI, at a 99.9% confidence level. 4.Discussion and ConclusionsThe critical angle of the rough surface is indistinct due to partial contact [Fig. 2(c)], but it was still recognizable (Fig. 3). From the profiles, RIs were derived for partial contact with the rough surfaces, although the SD was greater than that for the flat surface, which had better contact (Fig. 4). This result indicates that the critical angle method can be used for rough silicone surfaces, provided that a sufficiently high proportion of the area is in contact and that the material has a low absorption. As shown in Fig. 5, in the in vivo measurements of cheek skin, the RIs were measured in the same manner as for the silicone samples. In other words, a sufficiently high contact area for the RI measurement was achieved by getting each subject to press the measurement site against the prism. A short acquisition time was realized, which reduces problems associated with time-varying conditions such as skin surface deformation and water content variation due to occlusions. From Fig. 7, the RI range was about 1.51 to 1.53, which is relatively higher than those of previous studies (which are less than 1.5).10–12,17 This is probably due to the skin surfaces being relatively dry in our experiment. Although the present experiments were performed using a -wave, a previous study indicated that the anisotropy is small.11 Assuming the discrepancy between the theoretical and measured profiles is only due to absorption, we estimated the effect of absorption by extending RI to complex RI. The imaginary part of complex RI is visually estimated to be about 0.004 from the sharpness of the shoulder in the profiles shown in Fig. 6(a). Although the sharpness of the shoulder can be changed by varying in Eq. (2), this will also alter the reflectance range so that the profile will not be close to the measured profiles. For the measured site in Fig. 6(b), the RI value is possibly overestimated by about 0.008. Although earlier studies found that the epidermis has a higher absorption (),11,12 the actual value may be smaller than that determined from plots of the actual reflectance against the incident angle, which are sharper than the fitting results shown in the studies.11,12 Since other causes may smooth the profile of the reflectance against the incident angle, our estimate may represent an upper limit for . The RI is significantly correlated with the conductance, which depends on the water content19,20 (Fig. 7). The water content is expected to affect the RI greatly because the RI of water (1.33) differs significantly from that of dry tissue ().1 The water content is known to vary between sites and individuals.21 Although the sebum is also a variable factor, it is not expected to affect the RI measurements greatly because the sebum at the measurement sites is expected to be washed away by washing the skin. To the best of our knowledge, this is the first time that a correlation between these two parameters has been observed above the natural variation, although the relationship has been theoretically predicted in previous studies.1,17 From this result, we estimate the RI from conductance (μS) using the formula , without considering systematic errors. Alternatively, we can use by assuming that the offset of 0.008 from the results of the above discussion can be applied to all subjects. This formula for the conductance varies between measurement devices; the above formula is unique to Skicon 200 EX. Despite being a straightforward and well-studied method for estimating the water content in skin,19,20 the conductance method has some problems, the most serious of which is the contact resistance between the skin and the probe, which affects the conductance. An increase in the contact area will reduce the contact resistance and hence increase the measured value. In future studies, the relationship between RI and the water content should be determined by direct methods that are insensitive to the contact ratio, such as confocal Raman microspectroscopy.13,21 Other factors such as temperature and dielectric substances are considered to be suppressed since the room temperature was controlled and the measurement sites were cleaned prior to the measurements. This method can be applied to other wavelengths by using bandpass filters for different wavelengths. However, we used a single wavelength in the present study for the stable measurement because replacing the filter prolongs the measurement time and makes it difficult to perform quick measurements. This problem can be overcome by improving the system design. The derivation of from these profiles has the potential to be improved in future studies. Theoretically, the profile should be fitted by the Fresnel equation with a complex RI.6,7,10–12 RIs have been measured in this manner in recent studies.10–12 We also tried this method but found that it did not work well, which is probably due to errors from other sources. An alternative method has been proposed that involves detecting the maximum of the first derivative.22 Although detection is difficult, this method is worth considering since it seems to be more robust against absorption than our method.22 There are some other probable causes of errors in the present measurement method. First, there may be multiple reflections in the prism and in the skin, which would reduce the angular resolution. In most previous studies, the effect of stray light from other incident angles was nullified by performing successive measurements at different incident angles.8,9,11,12 Simultaneous measurements in the present method are essential for realizing a short measurement time, but they adversely affect the angular resolution. A second potential source of errors is intermediate regions between contact and noncontact areas. Although we assumed a binary condition in Eq. (2), the gap between the prism and the sample changes varies continuously between contact and noncontact areas. In intermediate regions, the light behavior will differ from that of either contact or noncontact areas due to the effect of evanescent waves.23 In addition to these errors, the RI may vary on the surface because the stratum corneum is composed of materials with different RIs, including lipid, water, and cell membrane. As Fig. 5 shows, the profiles of some subjects exhibit a plateau (about 57 deg for this figure), which implies such a composition. This method assumes that deformation of the skin will provide a sufficiently high contact area to enable the critical angle to be determined. However, skin deformability and topography varies between sites, individuals, and conditions (e.g., water content). Consequently, the method will not always give valid results. As a preliminary study, we show a representative profile of the inner side of a forearm along with that of a cheek (Fig. 8). The folding point of the forearm gives more ambiguous results than the cheek; this is probably due to the smaller contact area and the stronger absorption. In fact, the estimation for the forearm profile performed in the same manner as the cheek profile indicated and , which is smaller and larger than the values for cheek, respectively. The cheek is more measurable than the forearm due to its greater deformability and lower absorption, making detection of the folding point easier. We found that the critical angle method is applicable to cheek skin, provided that there is a high contact ratio and low absorption. In addition, we explained the variation in the RIs of individuals in terms of water content using the critical angle method, which suggests that the method is sufficiently accurate for detecting the variation under normal conditions (at least relatively). Although measurable sites are currently limited to the cheek, it is anticipated that the application range of this method can be extended by improving the method. AcknowledgmentsWe wish to express our gratitude to Kotatsu Bito, for providing the RI measurement of silicone samples with the dipping method, and to the staff of Lightwave Technology Lab in Faculty of Systems Engineering, Wakayama University, including Dr. Eiji Nitanai, for demonstrating their equipment to us, which provided useful insights for developing our system. ReferencesG. Ackermannet al.,
“Correlations between light penetration into skin and the therapeutic outcome following laser therapy of port-wine stains,”
Lasers. Med. Sci., 17
(2), 70
–78
(2002). http://dx.doi.org/10.1007/s101030200013 LMSCEZ 1435-604X Google Scholar
J. L. SolanK. Laden,
“Factors affecting the penetration of light through stratum corneum,”
J. Soc. Cosmet. Chem., 28
(3), 125
–137
(1977). JSCCA5 Google Scholar
T. Sandet al.,
“Evaluation of the epidermal refractive index measured by optical coherence tomography,”
Skin. Res. Technol., 12
(2), 114
–118
(2006). http://dx.doi.org/10.1111/srt.2006.12.issue-2 0909-752X Google Scholar
G. J. Tearneyet al.,
“Determination of the refractive index of highly scattering human tissue by optical coherence tomography,”
Opt. Lett., 20
(21), 2258
–2260
(1995). http://dx.doi.org/10.1364/OL.20.002258 OPLEDP 0146-9592 Google Scholar
J. J. J. DirckxL. C. KuypersW. F. Decraemer,
“Refractive index of tissue measured with confocal microscopy,”
J. Biomed. Opt., 10
(4), 044014
(2005). http://dx.doi.org/10.1117/1.1993487 JBOPFO 1083-3668 Google Scholar
Q. W. Songet al.,
“Modified critical angle method for measuring the refractive index of bio-optical materials and its application to bacteriorhodopsin,”
J. Opt. Soc. Am. B., 12
(5), 797
–803
(1995). http://dx.doi.org/10.1364/JOSAB.12.000797 JOBPDE 0740-3224 Google Scholar
W. LeupacherA. Penzkofer,
“Refractive-index measurement of absorbing condensed media,”
Appl. Opt., 23
(10), 1554
–1558
(1984). http://dx.doi.org/10.1364/AO.23.001554 APOPAI 0003-6935 Google Scholar
H. LiS. Xie,
“Measurement method of the refractive index of biotissue by total internal reflection,”
Appl. Opt., 35
(10), 1793
–1795
(1996). http://dx.doi.org/10.1364/AO.35.001793 APOPAI 0003-6935 Google Scholar
J. Laiet al.,
“Experimental measurement of the refractive index of biological tissues by total internal reflection,”
Appl. Opt., 44
(10), 1845
–1849
(2005). http://dx.doi.org/10.1364/AO.44.001845 APOPAI 0003-6935 Google Scholar
J.-C. Laiet al.,
“Complex refractive index measurement of biological tissues by attenuated total reflection ellipsometry,”
Appl. Opt., 49
(16), 3235
–3238
(2010). http://dx.doi.org/10.1364/AO.49.003235 APOPAI 0003-6935 Google Scholar
H. Dinget al.,
“Determination of refractive indices of porcine skin tissues and Intralipid at eight wavelengths between 325 and 1557 nm,”
J. Opt. Soc. Am. A., 22
(6), 1151
–1157
(2005). http://dx.doi.org/10.1364/JOSAA.22.001151 JOAOD6 0740-3232 Google Scholar
H. Dinget al.,
“Refractive indices of human skin tissues at eight wavelengths and estimated dispersion relations between 300 and 1,600 nm,”
Phys. Med. Biol., 51
(6), 1479
–1489
(2006). http://dx.doi.org/10.1088/0031-9155/51/6/008 PHMBA7 0031-9155 Google Scholar
P. J. Casperset al.,
“In vivo confocal Raman microspectroscopy of the skin: noninvasive determination of molecular concentration profiles,”
J. Invest. Dermatol., 116
(3), 434
–442
(2001). http://dx.doi.org/10.1046/j.1523-1747.2001.01258.x JIDEAE 0022-202X Google Scholar
T. Richteret al.,
“Dead but highly dynamic—The stratum corneum is divided into three hydration zones,”
Skin. Pharmacol. Physiol., 17
(5), 246
–257
(2004). http://dx.doi.org/10.1159/000080218 SPPKE6 1660-5527 Google Scholar
R. R. AndersonJ. A. Parrish,
“The optics of human skin,”
J. Invest. Dermatol., 77
(1), 13
–19
(1981). http://dx.doi.org/10.1111/jid.1981.77.issue-1 JIDEAE 0022-202X Google Scholar
K. Hashimoto,
“New methods for surface ultrastructure: comparative studies of scanning electron microscopy, transmission electron microscopy and replica method,”
Int. J. Dermatol., 13
(6), 357
–381
(1974). http://dx.doi.org/10.1111/j.1365-4362.1974.tb05068.x Google Scholar
V. TsenovaE. Stoykova,
“Refractive index measurement in human tissue samples,”
Proc. SPIE, 5226 413
–417
(2003). http://dx.doi.org/10.1117/12.519584 PSISDG 0277-786X Google Scholar
G. H. Meeten,
“Refractive index measurement,”
The Measurement, Instrumentation, and Sensors Handbook, CRC Press, Boca Raton, FL
(1999). Google Scholar
C. W. BlichmannJ. Serup,
“Assessment of skin moisture. Measurement of electrical conductance, capacitance and transepidermal water loss,”
Acta. Derm. Venereol., 68
(4), 284
–290
(1988). ADVEA4 0001-5555 Google Scholar
A. O. BarelP. Clarys,
“In vitro calibration of the capacitance method (Corneometer CM 825) and conductance method (Skicon-200) for the evaluation of the hydration state of the skin,”
Skin. Res. Technol., 3
(2), 107
–113
(1997). http://dx.doi.org/10.1111/srt.1997.3.issue-2 0909-752X Google Scholar
M. EgawaH. Tagami,
“Comparison of the depth profiles of water and water-binding substances in the stratum corneum determined in vivo by Raman spectroscopy between the cheek and volar forearm skin: effects of age, seasonal changes, and artificial forced hydration,”
Br. J. Dermatol., 158
(2), 251
–260
(2008). http://dx.doi.org/10.1111/(ISSN)1365-2133 BJDEAZ 1365-2133 Google Scholar
G. H. Meeten,
“Refractive index errors in the critical-angle and the Brewster-angle methods applied to absorbing and heterogeneous materials,”
Meas. Sci. Technol., 8
(7), 728
–733
(1997). http://dx.doi.org/10.1088/0957-0233/8/7/006 MSTCEP 0957-0233 Google Scholar
L. SalomonF. De FornelJ. P. Goudonnet,
“Sample-tip coupling efficiencies of the photon-scanning tunneling microscope,”
J. Opt. Soc. Am. A., 8
(12), 2009
–2015
(1991). http://dx.doi.org/10.1364/JOSAA.8.002009 JOAOD6 0740-3232 Google Scholar
|