|
|
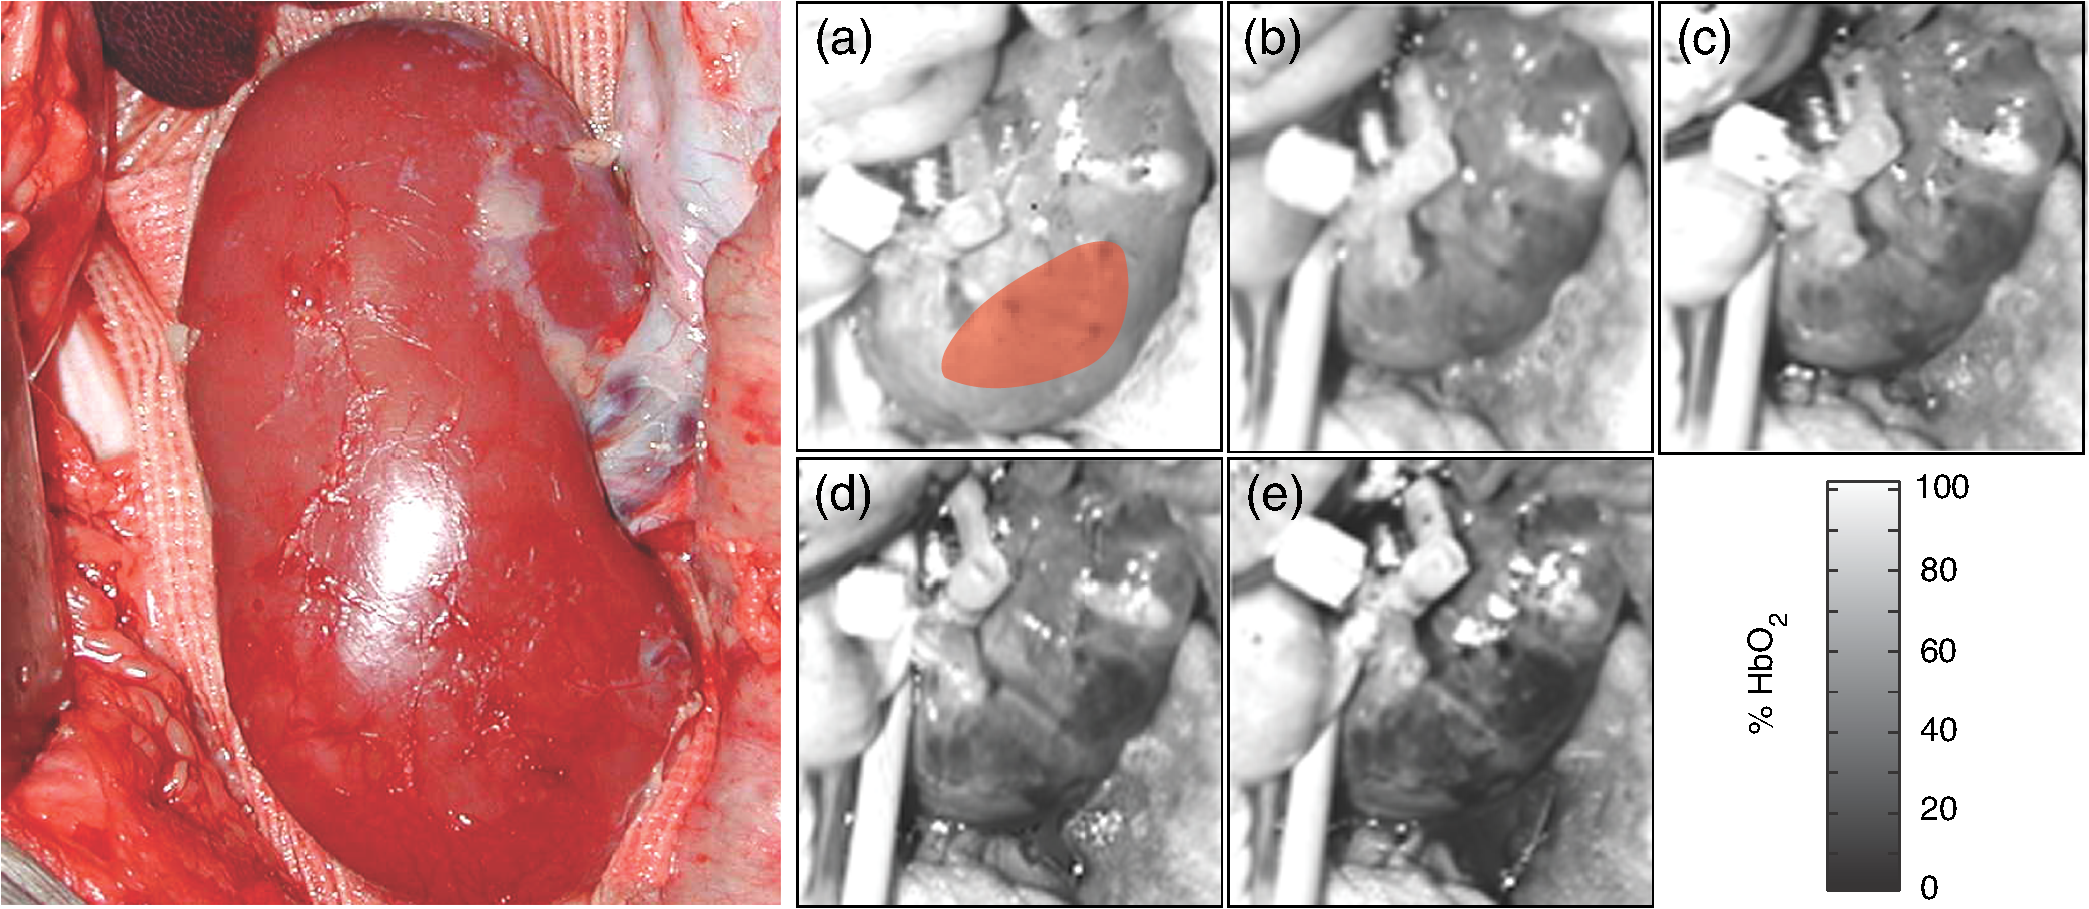
1.IntroductionRenal ischemia that occurs intraoperatively during procedures requiring clamping of the renal artery (such as renal procurement for transplantation and partial nephrectomy for renal cancer) is known to have a significant impact on the viability of that kidney.1–5 Two major modifiable intraoperative variables known to affect renal function during ischemia are the length of ischemic time and the temperature of the kidney at which ischemia occurred. Greater length of renal ischemia is associated with subsequent worse recovery of renal function, whereas cooling of the kidney allows for longer exposure to ischemia.6–12 There remains much controversy as to the specific duration of ischemia that results in renal injury and at what point cold ischemia should be employed. Measurement of direct renal oxygenation intraoperatively during renal artery clamping has been explored to a small extent, with promising results in determining subsequent renal function.13,14 By exploiting the different spectral properties of oxygenated and de-oxygenated hemoglobin, it is possible to quantify the level of oxygenation in the blood by measuring the wavelengths reflected off the kidney. To better understand the dynamics of intraoperative renal ischemia and recovery of renal oxygenation during reperfusion, a visible reflectance imaging system (VRIS) was developed to measure renal oxygenation during renal artery clamping in both cooled and warm kidneys. 2.Materials and Methods2.1.Large Animal Model for Ischemia/Reperfusion Injury2.1.1.Porcine modelPorcine laparotomies, as part of an animal protocol approved by National Institutes of Health, National Cancer Institute, the Institutional Animal Care and Use Committee, were used to assess the extent of ischemic injury (i.e., decreased tissue oxygenation) incurred during surgery. A midline abdominal incision was made in each animal (), and the left kidney was exposed. Intravenous mannitol () and heparin () were administered before vessel occlusion (via vessel loops). Pigs were subjected to normothermic (33°C, ) and hypothermic (5°C, ) ischemia. For hypothermic ischemia, the abdomen was filled with sterile ice slush; before reperfusion, the ice slush was removed from the abdominal cavity. Hyperspectral images of the kidneys were collected noninvasively at regular intervals for up to 30 min of renal ischemia. After the vessel loops were released, images of the kidneys were acquired at regular intervals for up to 30 min after reperfusion. All animals were euthanized immediately after the operation. 2.1.2.Canine modelThe canine experiment () was performed as a validation of the correlation of visible reflectance imaging measurements with actual blood oxygenation. The canine laparotomy, as part of an animal protocol approved by the Institutional Animal Care and Use Committee, was used to assess the extent of ischemic injury (i.e., decreased tissue oxygenation) incurred during surgery. Standard open surgical techniques were employed to expose the kidney and renal hilum. The renal artery and vein were cross-clamped with Satinsky clamps. An angiocatheter was inserted into the renal vein for subsequent blood draws directly from the kidney. Mean region of interest (ROI) values were calculated from the hyperspectral images of the surgery collected using the VRIS and compared to measured venous oxygen saturation values ( and ). Hyperspectral images of the kidneys were collected noninvasively at 5, 10, 20, and 30 min of normothermic renal ischemia. The animal was euthanized immediately after the operation. 2.2.Visible Reflectance Imaging SystemThe VRIS comprised of several components (Fig. 1): light source, mirror, filter system, charge-coupled device (CCD), and personal computer. The light source is a 30 W quartz-halogen lamp (Oriel, Irvine, California) which is reflected onto the area of interest via adjustable fiber-optic rings. The diffusely reflected light from the surgical field is then reflected to a liquid crystal tunable filter (LCTF) (Cambridge Research Instruments, Woburn, Massachusetts) by a mirror angled at 45 deg incident to the surgical plane. The CCD (; Photometrics, Tuscon, Arizona) acquires images (100 ms per image) as the LCTF adjusts to each desired wavelength. The LCTF transmits light from 420 to 700 nm. To improve the signal-to-noise ratio of the spectra contained in the data set, the image is binned by 3 pixels. This ultimately results in a image plane. Each image cube contains 126 image planes, with a single image plane collected at single spectral increments of 1 nm from 520 to 645 nm. For background measurements, a 99% diffuse reflectance standard was used (Labsphere, North Sutton, New Hampshire). Fig. 1Schematic of visible reflectance imaging system (VRIS). The light is generated by a broadband quartz tungsten halogen lamp (200 to 1100 nm) and delivered to the operating plane (indicated by the kidney) via fiber optics. A mirror directs reflected light to a tunable filter (420–700 nm), which then passes the light to a thermoelectrically cooled detector. 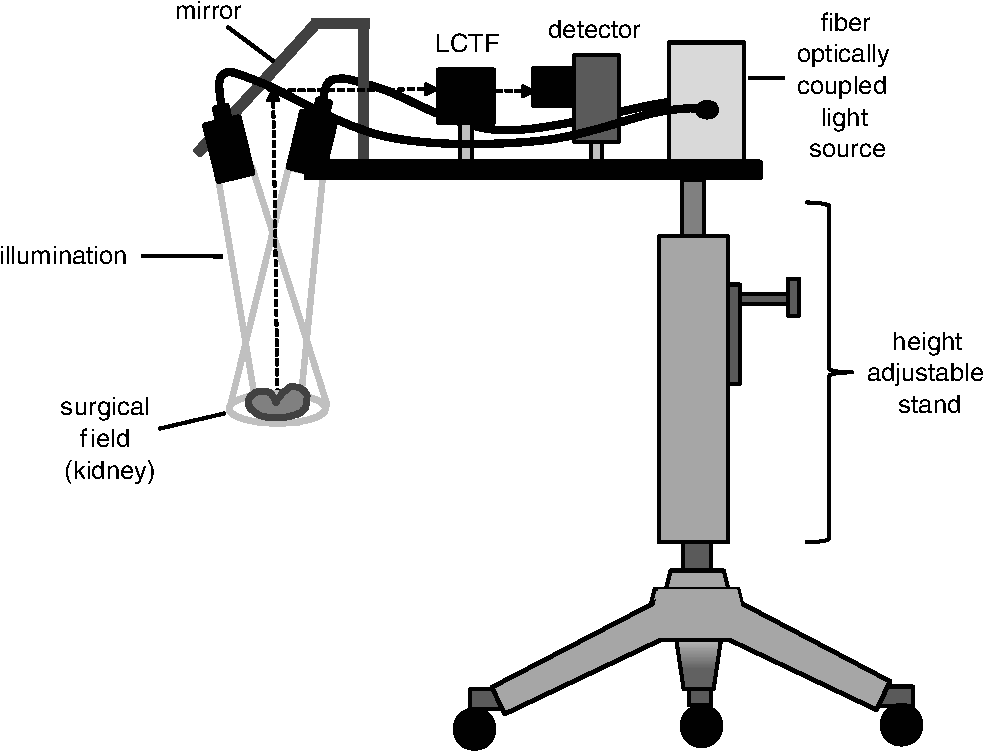 The image data sets are stored and analyzed using a personal computer (Gateway, Irvine, California). Data analyses are carried out using in-house and commercially available scripts in Matlab™ (Mathworks, Natick, Massachusetts). Briefly, the spectral response of the tissue examined is subjected to deconvolution for calculation of various tissue parameters (oxy- and deoxy-hemoglobin, water). Oxygenated hemoglobin exhibits distinct spectral bands at 537 and 567 nm, whereas deoxygenated hemoglobin exhibits a markedly different spectral band at 553 nm. 2.3.Data AnalysisAccording to the Beer–Lambert law, the absorbance of a sample () depends on three parameters: pathlength (), concentration (), and the molar absorption coefficient (). Absorbance, however, can also be defined as the logarithmic ratio between the intensity of light incident on a sample () and the intensity of light transmitted through a sample (), where . Finally, one can extrapolate concentration of the sample from the ratio of light intensity, because . Absorbance spectra were used in the prediction of oxygenated hemoglobin concentration because of the linear relationship between concentration and absorbance spectra. Absorbance image cubes were created by referencing each raw spectral cube () by the reflectance of a standard reference material (). The relative concentration units for deoxygenated hemoglobin utilized throughout this study are percentage oxygenated hemoglobin (), which is defined as the percentage of the concentration of oxygenated hemoglobin divided by the total hemoglobin concentration.15 All data analysis was performed using algorithms and software written in-house using the programming languages Matlab and IDL/ENVI (ITT Visual Information Solutions, Boulder, Colorado). The calculation of relative oxygenated hemoglobin concentration was a two-step process. The first step involves using the classic least squares method, sometimes referred to as the -matrix method,16 which is explained in detail in elsewhere.17,18 In brief, the measured absorbance spectra and concentration of pure components (oxygenated and deoxygenated hemoglobin) are linearly proportional to each other via a -matrix, , where is the absorbance spectra matrix (), is the matrix of pure components (number of components in the model × number of wavelengths), and is a concentration matrix (number of measured spectra × number of pure components in the model) with relative concentration units of . In this method, the absorptivities usually defined in univariate Beer law fitting are normalized to constant path length, resulting in being a normalized absorption coefficient matrix.18 These pure component spectra were measured external to these in vivo measurements. Also, the number of measured spectra in and number of concentrations in the matrix vary with each data set, because the number of pixels that include the kidneys varies, but in every data set is . One limitation of this -matrix method occurs when one or more spectroscopically active components are not represented in the calibration set.17–19 In the case of visible reflectance spectra of kidneys, both chemical and optical nonhemoglobin spectral contributions can limit the accuracy of the concentration prediction. The second step in the concentration determination is to overcome this limitation by applying externally obtained relative oxygenated hemoglobin concentrations to correct for these nonhemoglobin contributions using augmented classic least squares, described elsewhere.19 Statistical significance was determined with the Student -test with the degrees of freedom modified by the Greenhouse–Geisser correction.20 This correction was chosen to provide more conservative estimates of the statistical significance in this study by mitigating pixel-to-pixel spatial correlations and temporal correlations. These correlation analyses were carried out using the CAR package21 in the R statistical computing language.22 3.Results3.1.VRIS Correlates with Measured Hemoglobin OxygenationFigure 2 shows a comparison between the oxy-hemoglobin concentration predicted by visible reflectance spectroscopy and catheter-drawn kidney blood oxy-hemoglobin concentration determined externally (canine nephrectomy). These externally determined oxy-hemoglobin concentrations () are from single blood samples taken as a function of induced ischemia time (29%, 32%, 40%, and 96% , respectively). The visible reflectance–determined oxy-hemoglobin concentrations are spatially averaged concentrations (calculated for approximately 6000 individual pixels). The error bars represent one standard deviation from the spatially averaged concentrations. The predicted and the externally measured oxygenated hemoglobin concentrations () correlate quite well (Fig. 2). The dashed line demonstrates a linear regression with a slope of 1.0 for reference. The cross-validation standard error of calibration was estimated for the calibration data, and the influence of each calibration point is insignificant compared to the standard error of calibration estimated by including all calibration data within a 95% confidence interval. This analysis suggests that no point in the calibration set holds significant influence or leverage over the calibration, and therefore, the calibration is valid.18 Fig. 2Calibration plot for deconvolution of percent oxygenated hemoglobin (). Mean oxyhemoglobin concentrations calculated from the visible reflectance images are plotted versus actual oxyhemoglobin concentrations (blood gas measurements).  Figure 3, a set of images of the canine kidney during ischemia injury, illustrate the ability of the visible reflectance images to measure renal tissue oxygenation intraoperatively. The largest image (left) is a visible-color image of the kidney. The sequential images A–E are concentration images of the kidney before and during the ischemia/reperfusion injury. The intensity of the grayscale in the images (A–E) corresponds to the oxy-hemoglobin concentration scale shown in the lower right of the figure. According to the image colormap, the highest concentration of is white, and the lowest concentration of is black. These intensity values were determined using algorithms developed in-house. The red shaded area in Fig. 3(a) indicates the ROI from which mean and standard deviation oxy-hemoglobin concentrations were determined. As indicated by the visible reflectance images of the kidney during warm ischemia, the decreases with ischemia time, and the kidney is darkest after 30 min of ischemia, demonstrating significantly lowered . 3.2.Effects of Regional Perfusion on IschemiaFigure 4 shows a set of sequential oxy-hemoglobin concentration images of a left porcine kidney during ischemia/reperfusion injury. The intensity values in these images were determined using algorithms developed in-house described in the Data Analysis section and correspond to the scale on the right of the figure. In Fig. 4(a), three regions of the kidney are defined by two diagonal lines corresponding to the superior, middle, and inferior poles of the kidney. These three regions are used to calculate the mean regional oxy-hemoglobin concentration as a function of ischemia/reperfusion clamping and unclamping times (shown in Fig. 5). It is clear in Fig. 4(b)–4(h) that the superior pole of the kidney remains more oxygenated than the middle or inferior poles during ischemia. After reperfusion [Fig. 4(i)–4(o)], however, kidney oxygenation appears to be relatively homogeneous. The average concentrations have been plotted in Fig. 5. Fig. 4Sequential oxygenation images of a left kidney at baseline (a) and during cold ischemia (b–h) and reperfusion (i–o). Ischemia time points: 5, 10, 15, 20, 25, 30, and 35 min after vessel clamping. Reperfusion time points: 5, 10, 15, 20, 25, 30, and 35 min after vessel unclamping. SP, superior pole; MP, middle pole; IP, inferior pole.  Fig. 5Profiles of kidney oxygenation before vessel clamping, during ischemia, and after reperfusion. (a), Mean concentrations for the entire kidney. (b) Mean concentrations for the superior pole, middle pole, and inferior pole.  Figure 5 is the scatter plot of the oxy-hemoglobin concentrations calculated for the entire kidney [Fig. 5(a)] and each kidney segment [Fig. 5(b)] and is representative of all kidneys examined in this study. Although the regional differences in tissue oxygenation are not readily apparent in the image of the kidney itself [Fig. 4(b)], examination of the calculated values clearly demonstrate a difference in the mean oxy-hemoglobin concentrations of the superior pole and middle and inferior poles (, , and , respectively; ). This spatial difference in oxy-hemoglobin concentration persists for the duration of the ischemia, with an average of for the superior pole and and for the middle and inferior poles, respectively (). After reperfusion, statistically significant differences in oxy-hemoglobin concentrations abate and the final mean oxy-hemoglobin concentrations of the superior, middle, and inferior poles are , , and , respectively (). For Figs. 4 and 5, the means and standard deviations were calculated from ROIs (not shown for clarity) that encompass approximately 60% of the visible area in each kidney pole. 3.3.Effects of Cold Ischemia on Tissue OxygenationAdditionally, mean oxy-hemoglobin concentrations were compared for cold and warm ischemia cases. In Table 1 are means and standard deviations for baseline, ischemic, and reperfused kidney oxy-hemoglobin concentrations from all cold and warm ischemia/reperfusion injuries. The average baseline values were and for hypothermic and normothermic kidneys, respectively; note that these values were acquired before the addition of the ice slush for the hypothermic kidneys. The oxy-hemoglobin concentrations of hypothermic kidneys after 30 min of ischemia are significantly higher than those of normothermic kidneys ( versus , ). The renal oxygenation of the hypothermic kidneys after 30 min of ischemia is approximately 70% of the baseline oxy-hemoglobin concentration, whereas the normothermic kidneys retain only 30% of the baseline oxy-hemoglobin concentration after 30 min of ischemia. After approximately 30 min of reperfusion, the mean oxy-hemoglobin concentrations of hypothermic and normothermic kidneys is comparable ( versus ) and returns to within 80% of the average baseline values. Table 1Comparison of mean baseline, ischemic, and reperfused kidney HbO2 concentrations for cold and warm ischemia. For all kidneys, normothermic and hypothermic, visible reflectance imaging demonstrated a spatially distinct decrease in the oxy-hemoglobin concentration of the superior pole compared to the middle or inferior pole of the kidney. Mean oxy-hemoglobin concentrations decrease more significantly during ischemia for normothermic kidneys compared to hypothermic kidneys. 4.DiscussionIn 1999, the numbers of hospital discharges for partial nephrectomies and transplant-related complete nephrectomies in the United States were 4171 and 12,765, respectively.23,24 Over the next decade, this number increased moderately by 31.8% for transplant-related complete nephrectomies, with of the primary transplants requiring a repeat transplant. The number of hospital discharges for partial nephrectomies in 2009 was greater than 10 years prior.23 In 2009, partial nephrectomies and transplant-related complete nephrectomies (32,000 total nephrectomies) were performed in the United States. As the number of nephrectomies increases, the need to understand renal ischemia and oxygenation as it relates to kidney function also grows. Vascular occlusion and subsequent renal ischemia are necessary to provide a bloodless operating field during nephrectomies for tumor excision and after kidney extraction. Unfortunately, ischemia and corresponding reperfusion induce a cascade of inflammatory events, resulting in tissue damage and acute kidney injury as a consequence of tissue hypoxia. Techniques to minimize tissue damage include reduction of normothermic ischemia or induction of hypothermic ischemia. In healthy kidneys with good baseline glomerular filtration rates (GFRs), these events can often be reversed after a period of reperfusion (either in situ with partial nephrectomies or in the recipient with transplants) once tissue oxygenation has been restored. In patients with comorbidities and/or chronic kidney disease, however, reduced GFR directly impacts renal oxygen consumption,25 and even normal ischemia times () may compromise kidney function.4 In spite of numerous studies exploring various ischemia conditions (normothermic, hypothermic, duration, partial clamping, etc.), rigid values for determining critical ischemia have not been resolved. This is partly because animal studies may not always corroborate results from human studies, different surgical techniques are simply not utilized by all medical staff for every case, and current metrics for kidney function (serum creatinine) can be greatly affected by factors such as body mass, sex, ethnicity, age, and hydration status.1 Thus, there exists a need for technology that is able to measure renal oxygenation during renal ischemia and reperfusion independent of animal model, surgical technique, and patient demographics. Visible light spectroscopy is capable of making measurements of tissue oxygenation and even blood flow noninvasively, directly from the visible spectrum of hemoglobin. The benefits of this type of technology are that the measurements can be made noninvasively, quickly, repeatedly, and clinically.26 Several technologies have been developed that utilize visible light spectroscopy for extracting tissue oxygenation measurements. Benaron and coworkers27–29 used various probe configurations, including a hand-held wand, an endoscopic catheter, a clip-on surface probe, an oral-esophageal catheter, and a flexible rectal probe, to make tissue oxygenation measurements in animals and humans. Tissue oximeter measurements were collected concurrently and correlated well with visible light spectroscopy tissue oxygenation measurements.27,28 More recently, Scheeren et al.14 employed a fiber-optic probe design to make renal tissue oxygenation measurements in renal transplant recipients. Not surprisingly, tissue oxygenation was higher in kidneys from living donors compared with deceased donors and correlated directly with ischemia time.14 In that study, the authors noted that the tissue oxygenation measurements did not correlate with the surgeon’s observations of mottling. The disadvantage of making measurements in a probe format, however, is the loss of regional information unless multiple measurements are made across the tissue. This type of sampling becomes time consuming, and it is impossible to make simultaneous measurements of different regions. Visible light imaging offers the same advantages as visible light spectroscopy but in a global format, capable of capturing regional measurements concurrently. Rather than probing one point along the surface of the kidney, the entire kidney is examined in a single snapshot. We have used 3-CCD contrast enhancement to monitor the effects of pneumoperitoneum on renal oxygenation during partial and complete nephrectomies.13 Although renal blood flow may be depressed during minimally invasive procedures, there was no indication of significantly decreased renal oxygenation even after 4 h of pneumoperitoneum application.13 Additionally, 3-CCD contrast enhancement was used to compare renal oxygenation post-reperfusion to renal oxygenation before hilar clamping.13 Zuzak and coworkers30,31 have monitored tissue oxygenation intraoperatively with a DLP® hyperspectral imaging system, at near–video frame rates, to study the effects of artery-only clamping and ice slush application on renal oxygenation.32 Their results indicated that artery-only clamping and 7–10 min of ice slush application can help to minimize the decrease in renal oxygenation during partial nephrectomies. In this pilot study on renal ischemia, we utilized hyperspectral imaging, specifically a visible reflectance imaging system (VRIS), to examine renal parenchyma oxygenation during 30 min of normothermic and hypothermic ischemia. All calculated tissue oxygenation values were validated with blood gas measurements of the renal parenchyma. Five kidneys were subject to 30 min of normothermic or hypothermic ischemia. Data analysis revealed that the hypothermic kidneys experienced an attenuated decrease in renal oxygenation (, ) compared to normothermic kidneys (, ) after hilar clamping, but that both normothermic and hypothermic kidneys returned to renal oxygenation levels near 80% of baseline after 30 min of reperfusion. These results corroborate an earlier study performed by Holzer et al.32 Though the normothermic renal oxygenation measurements were further from baseline measurements than the hypothermic renal oxygenation measurements post-reperfusion, there was no statistical difference between the baseline renal oxygenation values and the reperfused renal oxygenation values. These findings support the clinical practice of maintaining donor kidneys on ice in the window before and during the transplant operation. Interestingly, we also observed regional differences in renal oxygenation for both normothermic and hypothermic kidneys. Throughout the duration of ischemia, the superior pole of the kidneys remained more oxygenated than the middle and inferior poles (approximately 75% versus 60% ). Almost immediately after reperfusion, all poles of the kidney exhibit similar oxygenation levels (75% to 80% ). This phenomenon has been reported previously in one study of renal arterial blood flow in a canine model; the study revealed that an autoregulatory resistance change occurred when a particular arterial segment of the renal vascular bed was altered.33 Regional oxygenation of the kidney has particular significance for the segmented clamping of vessels during partial nephrectomies. Selective control during vessel clamping may reduce the overall effects of ischemia/reperfusion injury during partial nephrectomies.34 Additionally, the observed relatively decreased lower pole oxygenation may partially account for the incidence of ureteral complication such as stricture after transplantation. We present preliminary results for a technique that has the potential to diagnose tissue ischemia in real time and in an organ-specific manner during open surgery. In addition, we demonstrate that hypothermic ischemia significantly attenuates renal oxygenation during hilar clamping and the ability to monitor regional differences in renal oxygenation. One limitation of this study is the lack of temporal correlation between images collected at different time points. Image registration methods would correct for deviations in measurements based on temporal variation. Although the calculations presented in this study were performed offline, efficient programming will allow automatic, real-time incorporation of the calculation to the VRIS. We recognize that an expanded study would allow the development of a training set by which an inflection point for critical ischemia could be determined by exploring longer renal ischemia times in a survival model. The developed training set would be the foundation for a clinical validation study. Furthermore, this technique may be broadly applicable to provide an indicator of organ ischemia during open and laparoscopic procedures. AcknowledgmentsThe authors thank Drs. Nadeem Dhanani, Marie McHenry, Ben McHone, and Peter Pinto for their surgical assistance during the experiments. This effort was supported (in part) by the Department of Defense (work unit no. 602227D.0483.01.A0518, Medical Free Electron Laser Program). We also acknowledge support from the intramural program of the National Institute of Diabetes and Digestive and Kidney Diseases, National Institutes of Health. The experiments reported herein were conducted in compliance with the Animal Welfare Act and in accordance with the principles set forth in the “Guide for the Care and Use of Laboratory Animals,” Institute of Laboratory Animals Resources, National Research Council, National Academy Press, 1996. The views expressed in this manuscript are those of the authors and do not reflect the official policy of the Department of the Army, Department of the Navy, the Department of Defense, or the U.S. government. This work was prepared as part of official government duties. Title 17 U.S.C. 105 provides that “Copyright protection under this title is not available for any work of the United States government.” Title 17 U.S.C. 101 defines a U.S. government work as a work prepared by a military service member or employee of the U.S. government as part of that person’s official duties. We certify that all individuals who qualify as authors have been listed; each has participated in the conception and design of this work, the analysis of data (when applicable), the writing of the document, and the approval of the submission of this version; that the document represents valid work; that if we used information derived from another source, we obtained all necessary approvals to use it and made appropriate acknowledgements in the document; and that each author takes public responsibility for it. ReferencesM. N. SimmonsM. J. SchreiberI. S. Gill,
“Surgical renal ischemia: a contemporary overview,”
J. Urol., 180
(1), 19
–30
(2008). http://dx.doi.org/10.1016/j.juro.2008.03.022 JOURAA 0022-5347 Google Scholar
F. Beckeret al.,
“Assessing the impact of ischaemia time during partial nephrectomy,”
Eur. Urol., 56
(4), 625
–634
(2009). http://dx.doi.org/10.1016/j.eururo.2009.07.016 EUURAV 0302-2838 Google Scholar
A. Adamyet al.,
“Recovery of renal function after open and laparoscopic partial nephrectomy,”
Eur. Urol., 58
(4), 596
–601
(2010). http://dx.doi.org/10.1016/j.eururo.2010.05.044 EUURAV 0302-2838 Google Scholar
R. H. Thompsonet al.,
“Every minute counts when the renal hilum is clamped during partial nephrectomy,”
Eur. Urol., 58
(3), 340
–345
(2010). http://dx.doi.org/10.1016/j.eururo.2010.05.047 EUURAV 0302-2838 Google Scholar
B. R. Laneet al.,
“Comparison of cold and warm ischemia during partial nephrectomy in 660 solitary kidneys reveals predominant role of nonmodifiable factors in determining ultimate renal function,”
J. Urol., 185
(2), 421
–427
(2011). http://dx.doi.org/10.1016/j.juro.2010.09.131 JOURAA 0022-5347 Google Scholar
F. Beckeret al.,
“Assessing the impact of ischaemia time during partial nephrectomy,”
Eur. Urol., 56
(4), 625
–634
(2009). http://dx.doi.org/10.1016/j.eururo.2009.07.016 EUURAV 0302-2838 Google Scholar
M. N. SimmonsM. J. SchreiberI. S. Gill,
“Surgical renal ischemia: a contemporary overview,”
J. Urol., 180
(1), 19
–30
(2008). http://dx.doi.org/10.1016/j.juro.2008.03.022 JOURAA 0022-5347 Google Scholar
M. M. Desaiet al.,
“The impact of warm ischaemia on renal function after laparoscopic partial nephrectomy,”
BJU Int., 95
(3), 377
–383
(2005). http://dx.doi.org/10.1111/bju.2005.95.issue-3 BJINFO 1464-410X Google Scholar
B. R. Laneet al.,
“Factors predicting renal functional outcome after partial nephrectomy,”
J. Urol., 180
(6), 2363
–2368 http://dx.doi.org/10.1016/j.juro.2008.08.036 JOURAA 0022-5347 Google Scholar
A. Adamyet al.,
“Recovery of renal function after open and laparoscopic partial nephrectomy,”
Eur. Urol., 58
(4), 596
–601
(2010). http://dx.doi.org/10.1016/j.eururo.2010.05.044 EUURAV 0302-2838 Google Scholar
R. H. Thompsonet al.,
“Every minute counts when the renal hilum is clamped during partial nephrectomy,”
Eur. Urol., 58
(3), 340
–345
(2010). http://dx.doi.org/10.1016/j.eururo.2010.05.047 EUURAV 0302-2838 Google Scholar
B. R. Laneet al.,
“Comparison of cold and warm ischemia during partial nephrectomy in 660 solitary kidneys reveals predominant role of nonmodifiable factors in determining ultimate renal function,”
J. Urol., 185
(2), 421
–427
(2011). http://dx.doi.org/10.1016/j.juro.2010.09.131 JOURAA 0022-5347 Google Scholar
N. J. Craneet al.,
“Non-invasive monitoring of tissue oxygenation during laparoscopic donor nephrectomy,”
BMC Surg., 8
(8),
(2008). http://dx.doi.org/10.1186/1471-2482-8-8 BSMUBM 1471-2482 Google Scholar
T. W. Scheerenet al.,
“Prognostic value of intraoperative renal tissue oxygenation measurement on early renal transplant function,”
Transplant. Int., 24
(7), 687
–696
(2011). http://dx.doi.org/10.1111/tri.2011.24.issue-7 TRINE5 0934-0874 Google Scholar
D. A. SkoogF. J. HollerS. R. Crouch, Principles of Instrumental Analysis, 302
–311 Brooks Cole, Australia
(2007). Google Scholar
D. M. HaalandR. G. Easterling,
“Improved sensitivity of infrared spectroscopy by the application of least squares methods,”
Appl. Spectrosc., 34
(5), 539
–548
(1980). http://dx.doi.org/10.1366/0003702804731258 APSPA4 0003-7028 Google Scholar
S. W. HuffmanA. SalidoD. Evanoff,
“Quantitative infrared spectroscopy in the undergraduate laboratory via multivariate mixture analysis of a simulated analgesic,”
Spectrosc. Lett., 43
(7/8), 539
–544
(2010). http://dx.doi.org/10.1080/00387010.2010.510702 SPLEBX 0038-7010 Google Scholar
O. Matthias,
“Statistic and computer applications in analytical chemistry,”
Chemometrics, 200
–203 Wiley, Weinheim
(1999). Google Scholar
D. M. HaalandD. K. Melgaard,
“New augmented classical least squares methods for improved quantitative spectral analyses,”
Vib. Spectrosc., 29
(1–2), 171
–175
(2002). http://dx.doi.org/10.1016/S0924-2031(01)00199-0 VISPEK 0924-2031 Google Scholar
A. C. Bathkeet al.,
“Greenhouse–Geisser adjustment and the ANOVA-type statistic: cousins or twins?,”
Am. Statistician, 63
(3), 239
–246
(2009). http://dx.doi.org/10.1198/tast.2009.08187 ASTAAJ 0003-1305 Google Scholar
J. FoxS. Weisberg, An R Companion to Applied Regression, SAGE, Thousand Oaks, CA
(2011). Google Scholar
“R: a language and environment for statistical computing,”
R Foundation for Statistical Computing, R. Core Team, Vienna, Austria(2011). Google Scholar
, “National and regional estimates on hospital use for all patients from the HCUP Nationwide Inpatient Sample (NIS),”
(2011) http://hcupnet.ahrq.gov/ Google Scholar
B. Redforset al.,
“Acute renal failure is NOT an ‘acute renal success’: a clinical study on the renal oxygen supply/demand relationship in acute kidney injury,”
Crit. Care Med., 38
(8), 1695
–1701
(2010). http://dx.doi.org/10.1097/CCM.0b013e3181e61911 CCMDC7 0090-3493 Google Scholar
J. Q. Brownet al.,
“Advances in quantitative UV-visible spectroscopy for clinical and pre-clinical application in cancer,”
Curr. Opin. Biotechnol., 20
(1), 119
–131
(2009). http://dx.doi.org/10.1016/j.copbio.2009.02.004 CUOBE3 0958-1669 Google Scholar
D. A. Benaronet al.,
“Design of a visible-light spectroscopy clinical tissue oximeter,”
J. Biomed. Opt., 10
(4), 044005
(2005). http://dx.doi.org/10.1117/1.1979504 JBOPFO 1083-3668 Google Scholar
D. A. Benaronet al.,
“Continuous, noninvasive, and localized microvascular tissue oximetry using visible light spectroscopy,”
Anesthesiology, 100
(6), 1469
–1475
(2004). http://dx.doi.org/10.1097/00000542-200406000-00019 ANESAV 0003-3022 Google Scholar
A. Karliczeket al.,
“Intraoperative assessment of microperfusion with visible light spectroscopy in esophageal and colorectal anastomoses,”
Eur. Surg. Res., 41
(3), 303
–311
(2008). http://dx.doi.org/10.1159/000155880 EUSRBM 0014-312X Google Scholar
S. L. Bestet al.,
“Minimal arterial in-flow protects renal oxygenation and function during porcine partial nephrectomy: confirmation by hyperspectral imaging,”
Urology, 78
(4), 961
–966
(2011). http://dx.doi.org/10.1016/j.urology.2011.06.029 0090-4295 Google Scholar
C. R. Tracyet al.,
“Characterization of renal ischemia using DLP hyperspectral imaging: a pilot study comparing artery-only occlusion versus artery and vein occlusion,”
J. Endourol., 24
(3), 321
–325
(2010). http://dx.doi.org/10.1089/end.2009.0184 JENDE3 0892-7790 Google Scholar
M. S. Holzeret al.,
“Assessment of renal oxygenation during partial nephrectomy using hyperspectral imaging,”
J. Urol., 186
(2), 400
–404
(2011). http://dx.doi.org/10.1016/j.juro.2011.03.162 JOURAA 0022-5347 Google Scholar
R. B. Harvey,
“Characteristics of blood flow in branches of the renal artery,”
Am. J. Physiol., 205
(5), 977
–981
(1963). AJPHAP 0002-9513 Google Scholar
K. J. Weldet al.,
“Extrarenal vascular anatomy of kidney: assessment of variations and their relevance to partial nephrectomy,”
Urology, 66
(5), 985
–989
(2005). http://dx.doi.org/10.1016/j.urology.2005.05.023 0090-4295 Google Scholar
|