|
|
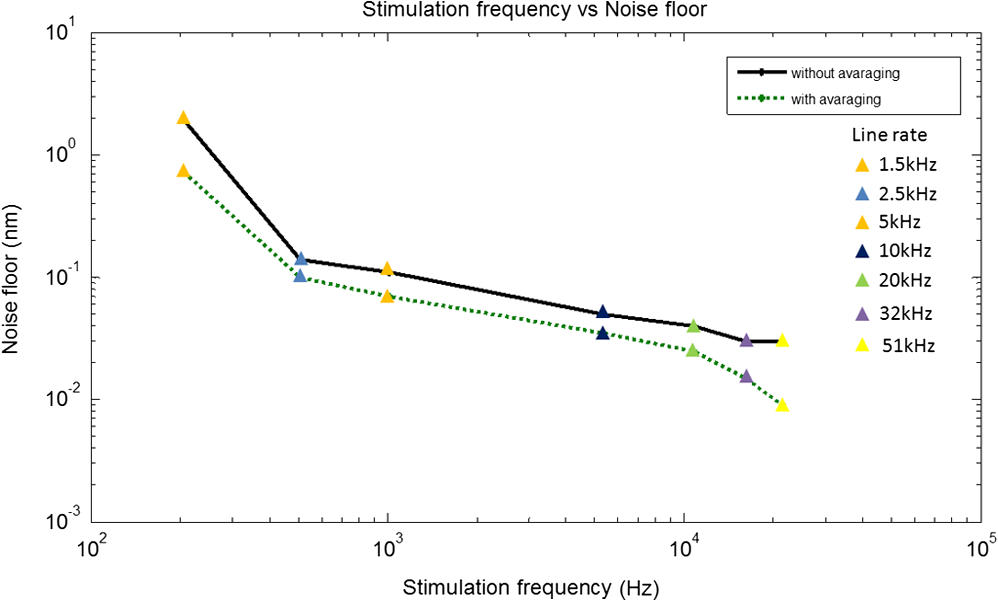
1.IntroductionLaser Doppler vibrometry (LDV) techniques have a series of undoubted advantages, such as high-sensitivity, non-contact nature of the probe, and the unparalleled characteristics offered by the use of coherent monochromatic laser light. These features offer the techniques as an indispensable method for studying the structural dynamics of physical and biological systems in many areas of research including biology and medicine. In medical research, they have been used for measurements on medical implants, for monitoring surgical procedures, for physiological measurements and various other biomechanical researches. Further applications in medical technology include quality assessment of medical devices such as dental and surgical instruments, medical imaging systems, as well as many safety and health-care systems. Moreover, LDV is firmly established as the gold standard method in non-contact vibration measurement analysis in the hearing research community for dynamic measurement of temporal bones, hearing aids, middle ear prostheses, and cochlear microstructures in the inner ear. 1,2 However, there are a couple of issues with using LDV techniques to measure inner-ear tissue vibration. First, the LDV does not provide a high-resolution depth-resolved cross-sectional map of structural and vibrational information because the long coherence length of the laser attributes interference over a long range and yields a complex signal that is not assigned to various microstructures within the inner ear. The second issue is that LDV requires reflected light from the surface of interest, and traditional LDV systems use visible light, which degrades the depth of penetration. Additionally, the microstructures of the organ of Corti (OC) has a relatively low level of reflectivity due to its close refractive index with the inner-ear fluids. To enhance the signal-to-noise ratio, LDV measurements require reflective microbeads that adhere to the OC surface, which face to the scala tympani.2 Since it is not practical to place reflective objects for the measurement of vibration at different cellular compartments in two and three dimensions, there is a pressing need for an optical sectioning method to perform structural and vibrational imaging of various microstructures of the organ of Corti. Recently, there has been a growing interest in the field of hearing research to adopt optical coherence tomography (OCT) as a tool for the studies of cochlear mechanics.3–5 We demonstrated OCT homodyne interferometry4 and have used this method to obtain a first “glimpse” at the in vivo action of cellular mechanics in the sensitive and high-frequency region of the cochlea.6 We are the first to develop phase-sensitive Fourier domain OCT (PSFDOCT) for vibration of tissue at a sub-nanometer scale.7 However, the proposed PSFDOCT was based on traditional single-beam interferometric technique and is capable of measuring vibration vector components only parallel to the optical axis of the imaging beam, and they do not offer the motion scenario along the transverse direction, which is required to address the hypothesis of the cochlear amplification. In this study, in order to overcome this limitation, we implemented a dual-angle delay-encoded sample beam (dual beam) approach into our PDFDOCT system, which is capable of measuring the radial and transverse motion without angular ambiguity in a single 2D plane. 2.Materials and Methods2.1.Delay-Encoded Dual-Beamlet FDOCT SystemFigure 1 illustrates the schematic of the dual-beamlet delay-encoded PSFDOCT system. The concept of delay optics is similar to that described in Ref. 8. The illumination source is a superluminecent diode (Superlum, Russia) with a central wavelength of 840 nm and a spectral bandwidth of 45 nm, which provided an axial imaging resolution of in air. The light source is coupled into the fiber-based Michelson interferometer with a coupling ratio of . In the sample arm, the beam is expanded to 7 mm diameter and incorporated a , 0.26 NA microscope objective (Mitutoyo, United States) with an effective focal length of 20 mm and a working distance of 30.5 mm, which yield a measured lateral resolution of in air. The dualangle delay encoding is implemented by inserting a glass slide of thickness 2 mm into the sample path (shown in Fig. 1). The glass slide is inserted midway into the collimated sample path such that half the sample light passes through the glass, which subdivides the probing beam into two beamlets with different optical delay and incident angle on the sample specimen as shown in the inset of Fig. 1. The light emerging at the output of interferometer was sent to a custom-built high-speed spectrometer, which consists of a 30-mm-focal-length collimator, a transmitting grating, an achromatic lens with a 100-mm focal length, and a 12-bit, 1024-pixels CCD line scan camera (ATMEL AVIIVA SM2, United States). This spectrometer setup had a designed imaging depth of on each side of the zero-delay line with a maximum line-scan rate of . The introduction of the glass plate divides the back-reflected sample arm signal into four different optical paths: air-air (AA), glass-air (GA), air-glass (AG), and glass-glass (GG). Since the optical path of AG and GA has the same optical path distance, the resultant OCT signal with the delay-encoded optics generates a set of three OCT images [, , and as shown in Fig. 2(c)] within the total imaging range of the designed spectrometer with a delay separation of (where and are the thickness and refractive index of the glass plate, respectively). Among these delay-encoded images, the vibration components of the OCT images corresponding to and were used for the calculation of the vibration vector as illustrated in Fig. 2(c). The measured sensitivity of these channels were each. Fig. 1(a) Experimental set-up of SD-PS OCT system. L1 to L5: lenses, MO: microscopic objective, GP: glass plate, B1: beamlet-1 (through glass), B2: beamlet-2 (through air), : separation angle b/w beamlets, v1 and v2: vibration vectors, : angles of incidence, PC: polarization controller, FC: fiber coupler, DG: diffraction grating, OC: optical circulator, RM: reference mirror, SLD: superluminescent diode, COMP: computer. (b) Angle calibration setup with positioning goniometer. : goniometetric stage, : radius, MT: test mirror.  Fig. 2(a) Structural image of the apical turn of a guinea pig cochlea (Video 1, MPG, 2.8 MB) [URL: http://dx.doi.org/10.1117/1.JBO.18.3.036003.1]. (b) structural image with delay-encoded optics, and (c) corresponding vibrational image with magnitude in nm (nanometer).  The estimated beam separation angle between the two beamlets is with an OCT sample beam of diameter 7 mm and a microscope objective (, 0.26 NA) with a focal length of 20 mm. In order to experimentally verify the estimated separation angle, we mounted a mirror on a goniometer stage as show in Fig. 1(b) at the sample plane of the OCT system. The optical axis of the sample beam was set normal to the mirror surface, and a 2 mm thick glass plate was introduced halfway into the sample beam to obtain two beamlets. Then the goniometer was scanned over a set of angles at which the back-reflected signal from each of the two beamlets experienced maximum, and the difference of these angles was taken to be the effective separation angle. 2.2.Image Acquisition and Vibration AnalysisFor measuring the vibration amplitude a MB-mode scanning protocol is employed to acquire data during acoustic stimulation. M-scans where acquired over a B-frame at 200 measurement points with a lateral scan range of 500 µm. Each M-scan consists of 1000 A-lines at fixed lateral position on the sample, and 10 M-scans were averaged at each lateral positions of the B-scan to improve the noise floor of the system. The system requires for capturing a set of MB-mode OCT data at an A-line rate of 2.5 kHz. A custom processing algorithm was used to analyze the MB-mode OCT data.7,9 First, the reference background OCT image was subtracted from the data sets, and fast Fourier transformations were taken for each column of the M-mode data sets to calculate the complex OCT signals from the spectral data. The phase was calculated for each corresponding pixel of the M-mode image. Then the phase difference between adjacent A-lines was computed, which was proportional to modulation of the optical path difference induced by the acoustic stimulation. The phase difference between adjacent A-scans, and , can be calculated as where * denotes the complex conjugate. Then the Fourier transformations of this measured phase differences can be taken as , where is the frequency variable of interest for the vibration signal, and and are the magnitude and phase of the signal at frequency .The “signal” in this measurement is defined as the peak magnitude of FFT within a window of the modulation frequency, and “noise” is defined as the peak FFT amplitude within the same window without any acoustic stimulation. The minimum noise floor of the system measured without averaging was at an A-scan rate of 51 kHz and at an A-scan rate of 1.5 kHz; With averaging 10 measurements, the system noise floor was at 51 kHz and 0.7 nm at 1.5 kHz, respectively. Figure 3 shows the noise floor measurements of the system at seven different A-line rates. As the A-line rate of the system increased, the vibration detection sensitivity of the system also increased by providing a better noise floor as shown in Fig. 3. This trend is due to the fact that the power spectrum of pink noise is inversely proportional to frequency. However, at a higher line rate, the short exposure time of the line detector limits the system performance for imaging highly scattering tissue specimens. In order to overcome this tradeoff between the available optical power and the short exposure time of the line detector, we operate the camera at an optimal line rate of 2.5 kHz for tissue imaging. 2.3.System CalibrationTo test the feasibility of the delay-encoded PSFDOCT system to measure absolute vibration and Doppler angle, a calibrated vibrating piezostack (AE0505D08F, Thorlabs Inc., United States) with a stimulation frequency of 300 Hz (400 mV driving volt) was used as sample. The piezostack was mounted on a goniometer stage as shown in Fig. 1(b), and measurements were carried out at various incident angles ( to 35 deg) with a step incremental angle of 5 deg. Then the vibration amplitudes were extracted from the two delay-encoded channels by using the above-mentioned method7 with averaging five measurements at a single scan point on the surface of the piezostack. Figure 4(a) shows the measured vibration amplitudes and corresponding simulated vibration amplitude for the two channels of the delay-encoded PSFDOCT system. Once the vibration components (, ) from the two delay-encoded channels were extracted, the Doppler angle and the corresponding absolute vibration can be calculated using Eqs. (2) and (3).8,10 Figure 4(a) shows the estimated vibration amplitudes and corresponding simulated results for beamlet-1(air) and beamlet-2 (glass) for a scan angle range of to 35 deg. where and denote the Doppler angles, denotes the separation angle between the two beamlets, and , corresponds to components of vibration magnitude measured from each beamlet of the delay-encoded optics. Then the magnitude of the absolute motion vector is simplyFig. 4(a) Simulated and measured vibration amplitude plot with the dual beam delay-encoded optics and the corresponding absolute vibration amplitude at preset tilt angles. (b) Set and the measured Doppler angle. 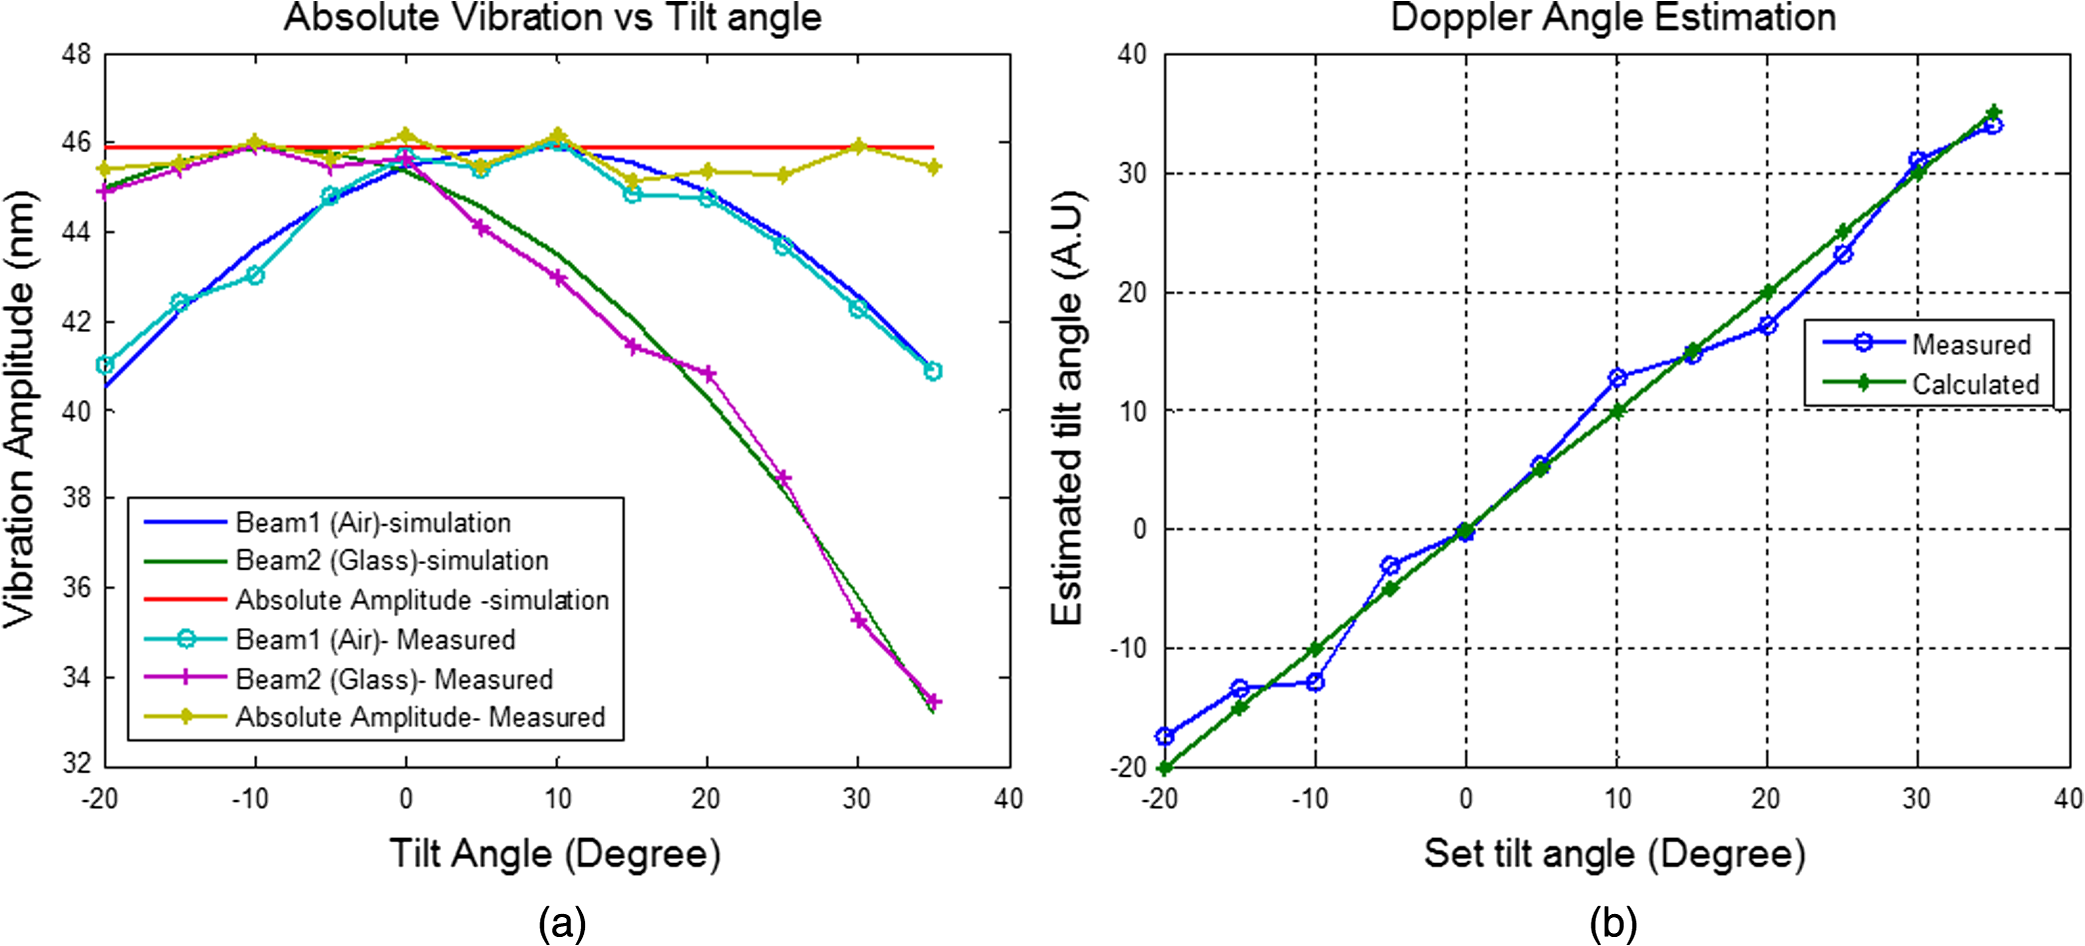 Figure 4(b) shows the set value of the Doppler angle and the corresponding estimated Doppler angles using the measured vibration vectors from the delay-encoded optics. Table 1 shows the estimated RMS error of absolute vibration for 10 measurements at each scan angle. The correlation between the measured and calculated result was excellent with an averaged RMS error of vibration magnitude of 0.68 nm. Table 1RMS errors for estimation of absolute vibration amplitude for each scan.
3.Results and DiscussionIn order to demonstrate the ability of this proposed system to measure absolute vibration and the Doppler angle, an in vitro experiment was performed at the apical turn of a guinea pig cochlea in response to sinusoidal acoustic stimulation. The surgically removed temporal bone from a deeply anesthetized guinea pig was used in this in vitro experiment. A hollow tube for delivering the acoustic stimulation was fixed to the ear canal near to the tympanic membrane and the distal side of the hollow tube was connected to a speaker as shown in Fig. 1. An opening was made on the apical end of the cochlea to probe the imaging beam, and the whole preparation was then submerged into a physiological solution media to keep the specimen fresh. The frequency of the acoustic stimulation was 300 Hz at 45 dB SPL. The set A-scan rate of the system was 2.5 KHz. We chose this low frequency acoustic stimulation because it provides meaningful response characteristics at the apical turn of OC. The mechanical response characteristics of the apical region of OC is only sensitive to the low-frequency components of acoustic stimulation. Figure 2(a) (Video 1) shows a cross-sectional structural OCT image of a portion of the apical turn through the surgically prepared hole. The important anatomical features of the inner ear microstructures and OC are clearly demarcated, which include the three fluid chambers and structural features of OC, such as basilar membrane (BM), tectorial membrane (TM), Reisnner’s membrane (RM), cells of Hensen (CH), outer hair cell (OHC), internal spiral tunnel (IST), and tunnel of Corti (TC). Figure 2(b) and 2(c) shows the corresponding delay-encoded structural and vibrational images, respectively. Figure 5(a) shows a close-up view of the OC structural image obtained with the delay-encoded optics. Figure 5(b) and 5(c) corresponds to the calculated absolute vibration amplitude and Doppler angle using Eqs. (2) and (3) with the delay-encoded vibration images and [shown in Fig. 2(c)]. Figure 5(d) shows the vector plot of the vibration map that comprises both vibration amplitude and direction of the dotted rectangle region of Fig. 5(b) and 5(c). The angle is calibrated with respect to the optical axis of the sample arm in the vertical direction. Fig. 5(a) Close-up view of cross-sectional structural OCT image of the organ of Corti with the delay-encoded channel (b) Cross-section map of absolute vibrational amplitude (nm). (c) Corresponding Doppler angle map (Degree). (d) Cross-sectional vector plot showing both amplitude (arrow length) and direction (arrow head) of tissue motion corresponds to the dotted rectangle area in Fig. 5(b) and 5(c).  4.SummaryIn summary, we have developed and demonstrated a dual-beam absolute vibrometer based on delay-encoded Fourier-domain low-coherence interferometry to study the cellular structure motions within the tissue with high sensitivity and resolution. We described the system performance, high resolution structural imaging, and preliminary absolute vibrometry of cellular structures within the apical turns of a guinea pig cochlea in vitro. At the development stage for this study, we did not attempt to interpret these images. AcknowledgmentsThe authors wish to thank Dr. Yuan Zhang for surgical preparation of the guinea pig temporal bone. This work was supported by research grants from the National Institute of Deafness and other Communication Disorders (Grants R01DC005983, R01DC000141 and R01DC010399). The content is solely the responsibility of the authors and does not necessarily represent the official views of grant giving bodies. ReferencesA. L. NuttallD. F. DolanG. Avinash,
“Laser doppler velocimetry of basilar membrane vibration,”
Hear. Res., 51
(2), 203
–213
(1991). http://dx.doi.org/10.1016/0378-5955(91)90037-A HERED3 0378-5955 Google Scholar
S. M. Khanna,
“Homodyne interferometer for basilar membrane vibration measurements,”
Hear. Res., 23
(1), 9
–26
(1986). http://dx.doi.org/10.1016/0378-5955(86)90172-3 HERED3 0378-5955 Google Scholar
S. S. HongD. M. Freeman,
“Doppler optical coherence microscopy for studies of cochlear mechanics,”
J. Biomed. Opt., 11
(5), 054014
(2006). http://dx.doi.org/10.1117/1.2358702 JBOPFO 1083-3668 Google Scholar
F. Chenet al.,
“In vivo imaging and low-coherence interferometry of organ of Corti vibration,”
J. Biomed. Opt., 12
(2), 021006
(2007). http://dx.doi.org/10.1117/1.2717134 JBOPFO 1083-3668 Google Scholar
S. S. Gaoet al.,
“Methodology for assessment of structural vibrations by spectral domain optical coherence tomography,”
Proc. SPIE, 8207 82072B
(2012). http://dx.doi.org/10.1117/12.920798 PSISDG 0277-786X Google Scholar
F. Chen,
“A differentially amplified motion in the ear for near-threshold sound detection,”
Nat. Neurosci., 14 770
–774
(2011). http://dx.doi.org/10.1038/nn.2827 NANEFN 1097-6256 Google Scholar
R. K. WangA. L. Nuttall,
“Phase-sensitive optical coherence tomography imaging of the tissue motion within the organ of Corti at a subnanometer scale: a preliminary study,”
J. Biomed. Opt., 15
(5), 056005
(2010). http://dx.doi.org/10.1117/1.3486543 JBOPFO 1083-3668 Google Scholar
C. J. Pedersenet al.,
“Measurement of absolute flow velocity vector using dual-angle, delay-encoded Doppler optical coherence tomography,”
Opt. Lett., 32
(5), 506
–508
(2007). http://dx.doi.org/10.1364/OL.32.000506 OPLEDP 0146-9592 Google Scholar
H. M. Subhashet al.,
“Feasibility of spectral-domain phase-sensitive optical coherence tomography for middle ear vibrometry,”
J. Biomed. Opt., 17
(6), 060505
(2012). http://dx.doi.org/10.1117/1.JBO.17.6.060505 JBOPFO 1083-3668 Google Scholar
D. P. DavéT. E. Milner,
“Doppler-angle measurement in highly scattering media,”
Opt. Lett., 25
(20), 1523
–1525
(2000). http://dx.doi.org/10.1364/OL.25.001523 OPLEDP 0146-9592 Google Scholar
|