|
|
1.IntroductionInfrared neural stimulation (INS) is a novel technique in which neurons are stimulated through the use of short pulses of infrared light, rather than the more conventional electrical stimulation.1 There is interest in using INS to replace or complement electrical stimulation2 in bionic devices, with particular interest for use in cochlear implants.3 A significant potential advantage of optical stimulation over more traditional electrical stimulation is higher spatial selectivity.1,4 Additionally, it does not create an artifact on electrical recording devices or require direct contact between the stimulation source (e.g., optical fiber) and nerves.1 The mechanism behind INS had been the subject of some discussion in the literature.1,5–8 Recent work suggests that INS is primarily mediated by water absorption and that a rapid increase in temperature from short laser pulses reversibly changes the membrane capacitance.6 This finding is in agreement with that of Wells et al.,5 who concluded that a strong temporal thermal gradient is necessary to achieve INS. Additionally, Albert et al.8 have shown that temperature-induced activation of TRPV4 channels plays a prominent role in the response of some sensory neurons (retinal and vestibular ganglion cells from rats) to infrared illumination. It remains unclear how the two effects contribute to the overall response and how these in vitro results relate to in vivo experimentation, given the different thresholds required in each case. Nevertheless, it is clear that transient heating plays a critical role in INS, and therefore it is important to consider the effects of heat flow during and after laser exposure. When different parts of a body are at different temperatures, heat flows from the hotter to cooler parts.9 There are three distinct mechanisms in which this can occur: heat conduction, where the heat is transmitted by the vibrational energy of atoms being passed on; convection, where heat is transmitted by the motion of heated gas or liquid to a cooler region; and radiation, where heat is transmitted directly by electromagnetic radiation.9 In the case of laser-tissue interactions, usually only heat conduction needs to be considered. As radiative heat transfer depends on (Stefan-Boltzmann law),10 its contribution is usually negligible at room temperature. Rates of convection depend on the tissue’s perfusivity, and since most tissues have a low perfusivity,10 this is also negligible and can be ignored. Heat conduction in a homogeneous, isotropic solid is described by the heat equation partial differential equation (PDE): where is the material’s thermal diffusivity, with the thermal conductivity, the density, and the specific heat capacity of the material.To describe the rate at which heat added to the material by absorption of light from a laser, a new term is introduced: General analytical solutions of the heat equation are possible for simple geometries,9,11–13 but in more complex geometries a finite element modeling (FEM) approach is generally more straightforward.14 Solutions for the heat equation have been used to better understand light-tissue interactions in processes such as laser ablation15 and heating during infrared spectrosopy.16 The duration of laser pulses that have been used for INS range from 5 μs17 to 10 ms.6 For pulse durations where the thermal penetration depth () is comparable with the size of the target neurons, heat conduction in principle can be ignored. For the spiral ganglion neurons, which have a 10 μm diameter of the cell body,18 in water (thermal diffusivity ) this gives a time of 175 μs. Therefore for pulses of this duration or shorter, the peak temperature should only depend on the pulse energy. On the other hand, for pulses longer in duration, the peak temperature and temperature distribution will also depend on the conduction of heat in the media interacting with the laser and the duration of the laser pulse. While it is convenient to approximate the thermal properties of tissues as homogeneous at the cellular scale, there is some evidence that the temperature rise can be inhomogeneous for a uniform heat source.19 In that case, heat conduction may be important on length scales comparable with the size of the target cells. Additionally, a previous investigation of INS in the cochlea has suggested that stimulation using pulse lengths with a thermal penetration depth on the order of target cell size may require less energy than longer pulse duration.17 Theoretical calculations of temperature rises during INS usually do not account for heat being conducted away during the laser pulse.2,17,20 For short pulses (), this is a reasonable approximation due to the small thermal penetration depth . However, there has not been a thorough investigation of the effects of thermal conduction during and after the laser pulse. Nor have the effects of fiber design and experimental geometry on the thermal decay rate been considered. Additionally, the temperature distribution across the boundaries of media with greatly different absorption coefficients, such as that of glass () and water or tissue (), cannot be accurately predicted without taking into account conduction of heat into the glass. This is of particular importance for in vitro work, where cells are frequently attached to a glass coverslip.6 The spatial dependence of light absorption and resulting temperature changes during INS have previously been investigated through the use of Monte Carlo simulations.21 However the temporal behavior of the heat generated and the effects of fiber geometry and wavelength selection on temperature decay have not been investigated. Here we report on extensions to the model of Ref. 21, taking into account thermal conduction through use of finite element analysis to solve the heat equation. The effects of heat conduction are investigated for laser pulse durations in the microsecond to millisecond range. 2.Finite Element Analysis of Heat ConductionFor this work, a finite element analysis approach to the heat equation was implemented, using the Monte Carlo simulations from Thompson et al.21 to provide the the laser irradiation patterns that give the initial heat distribution . Optical constants for absorption (), scattering (), anisotropy (), and refractive index () are the same as used in Ref. 21 and are summarised in Table 1 for a wavelength of 1850 nm. For other wavelengths, the absorption coefficient () follows water absorption22 as a first approximation due to the lack of information regarding light absorption in tissue at these wavelengths. For fused quartz, a nominal absorption coefficient of was used, with a scattering of . Thermal diffusivity of water () was used for tissue and perilymph, as reductions in thermal conductivity due to a reduced water content are usually compensated by a similar reduction in heat capacity.23 For simplicity tissue was given the same heat capacity as water. The thermal diffusivity of fused quartz was taken as (Ref. 24). For thermal diffusivity of air at room temperature, a value of was used.24 Table 1Parameters used for simulations when λ=1850 nm.
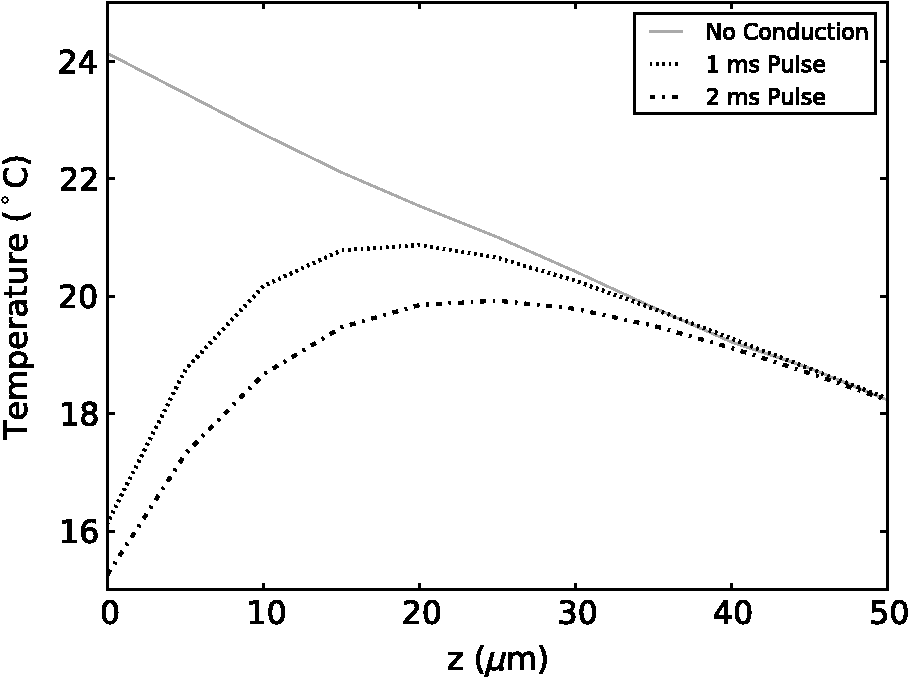
The simulation was implemented in OpenCL, a hardware-agnostic application programming interface for general purpose computing on CPUs and GPUs. This approach takes advantage of the high-performance computing power of modern CPUs and GPUs to reduce computation time.25–27 A voxel size of 5 μm was used in a voxel three-dimensional (3-D) grid, with the initial heat distribution provided in a 3-D grid from the Monte Carlo simulation. This gives buffers of 28 voxels or 140 μm on each edge of the simulation. Beyond the grid the temperature was held constant at a reference temperature of 21ºC (room temperature). As this boundary condition could provide an artificially high rate of temperature decay, a comparison was made against a 780 μm buffer. Using a 1-ms pulse of 1850-nm light from a 200 μm core fiber, the temperature at a point 500 μm from the fiber rises to 3.63ºC at the end of the pulse in both cases. After , the small buffer was 1% lower than the 780 μm buffer. By 500 ms, the temperature with the small was 6% lower at a temperature of 0.121ºC compared with 0.129ºC for the 780 μm buffer. This suggests that the buffer size is not a significant factor for . In this study a forward difference finite element approximation was implemented. This approach is stable provided that the time step is less than the maximum time step (), which for the 3-D heat conduction PDE is given by (Ref. 14). For a simulation with a thermal diffusivity of () and a voxel size of , this gives . Generally a time step of was used here. 3.Heating During Millisecond Duration PulsesDue to the thermal diffusivity of water and tissue, it is reasonable to expect that a significant amount of heat conduction will occur during millisecond duration pulses. This may affect the resulting peak temperature and temperature distribution. To assess the effect of heat conduction on pulses of various length, the output from a continuous wave laser is considered. Figure 1 shows (a) the temperature and (b) the instantaneous rate of change of temperature (henceforth referred to as the temperature gradient) when the laser is turned on at . These results were based on a 10 mW laser beam with wavelengths of 1850 and 1870 nm, measured in a nerve layer 500 μm from a fiber with a 200 μm core and 0.22 NA. For 1850 nm, the temperature has increased by 0.36ºC, after 10 ms, compared with 0.45ºC for no conduction, a reduction of 20%. The temperature gradient shows an even greater reduction, falling from an initial value of to by 10 ms, a change of 35%. A wavelength of 1870 nm shows similar trends to the 1850 nm. Therefore, for millisecond duration pulses, thermal conductivity has a significant effect on the final temperature and estimations of the temperature rise due to an instantaneous pulse are not representative of the actual temperature. Extrapolating from the results, the temperature may reach equilibrium after , where any further heat added by the laser is conducted away the same rate. Fig. 1(a) Temperature rise generated by a 10 mW laser running CW over 100 ms: solid lines show the temperature with conduction taken into account; dashed lines show the temperature if there was no conduction; (b) temperature gradient from a 10 mW laser running CW over 100 ms.  While short laser pulses () have been shown to be most effective for INS in the cochlea, there are also many examples in the literature of millisecond duration pulses being used for INS.5–8 Figure 2 shows the normalized change in temperature from a single pulse of 1 ms, with various wavelengths. Water is used as the transmission, absorption, scatter, and conduction medium as it has similar properties to tissue23 and simplifies comparisons between different wavelengths and distances from the fiber to the target position. For , the temperature is reported 500 μm from the fiber, while for , the temperature is taken 55 μm from the fiber. The different distances are due to the significantly higher absorption for compared with 1850 nm and corresponds to a distance between the fiber and nerve used in experimental work.17 For purposes of comparison, 1870 nm is provided at both distances. For a 1 ms pulse at , the change of temperature over time is illustrated in Fig. 3, showing snapshots at 0.5, 1, 10, and 20 ms. Fig. 2Change in temperature from a 1 ms pulse: (a) To allow for easier comparison, pulse energies have been scaled to give the same temperature increase. 1850 nm: ; 1870 nm: (at 500 μm); 1870 nm: (at 55 μm) and 1937 nm: ; (b) All pulse energies have been kept constant at 25 μJ. Temperatures achieved are: 1850 nm: (at 500 μm); 1870 nm: (at 500 μm); 1870 nm: (at 55 μm) and 1870 nm: (at 55 μm).  Figure 2(a) shows the temperature profile, with the full 1 ms pulse and first 4 ms of thermal evolution highlighted in the insert, using wavelengths of 1850, 1870, and 1937 nm with pulse energies () selected to give the same peak temperature. With excitation 500 μm away from the nerve, both 1850 and 1870 nm display an immediate decrease in temperature; however, when the excitation is shifted to just 55 μm from the nerve the 1870 nm has a slower decay in temperature while the 1937 nm pulse displays an increase in temperature for around 1 ms after the pulse has finished and before starting to decay. Over longer time periods, both wavelengths at 500 μm from the fiber display similar decay rates. At 55 μm, the decay is initially slower than that of 500 μm, but after 10 ms, it overtakes the temperature decay at 500 μm. The 1937 nm pulse also has a more rapid decay than 1870 nm. The faster decay to baseline temperature with more strongly absorbing wavelengths is expected as the heating is more localized at the fiber tip.5,28 Figure 2(b) shows when a pulse energy of 25 μJ is used for all wavelengths. A temperature of 0.11ºC is achieved for 1850 nm at 500 μm, 0.14ºC for 1870 nm at 500 μm, 0.34ºC for 1870 nm at 55 μm, and 1.16ºC for 1937 nm at 55 μm. During temperature decay, the pulses with the higher initial temperature remain higher than the other pulses, even 250 ms after the pulse. It is also worth noting that the spatial localization of light, driven by the fiber parameters and absorption coefficient at the wavelength selected, is the most significant factor driving changes in thermal relaxation times. At 500 μm from the fiber with a wavelength of 1850 and 1870 nm, there is minimal difference in the temperature after 250 μs, while at 55 μm there is a larger difference between the two wavelengths (1870 and 1937 nm). If a single exponential curve [] is fitted to the decay, it does not agree well with the model results, but returns to the baseline level faster than predicted. A sum of exponentials [] provides a closer fit than a single exponential. However, an analytical solution (not presented here) for the temperature decay on-axis from a collimated beam of light in a material of uniform absorption () and thermal diffusivity () suggests that as , the decay is best represented by , which has a longer decay time than either an exponential or sum of two exponentials. This slower decay may limit the frequency of repeated pulses that can be used before the tissue heats beyond a damage inducing threshold. To check the accuracy of the model and provide further information about the temporal behavior of heating during INS, the geometry for the model was arranged to match the experimental arrangement used by Shapiro et al.6 for oocyte stimulation. Oocyte stimulation was performed with a 1889-nm laser coupled to a 400 μm core fiber. During stimulation, the fiber was positioned below a 100 μm thick quartz coverslip and aimed up towards the oocyte. When performing temperature measurements, the oocyte was removed and temperature measurements were made using pipette resistance with the pipette positioned in the centre of the beam, within 100 μm of the coverslip. Peak temperature changes of 15.2ºC and 27.2ºC were observed for pulses of (2.8 mJ) 1 ms and (5.6 mJ) 2 ms, respectively. The model was configured with the fiber positioned 500 μm behind the 100 μm quartz cover slip, aimed at the oocyte on the other side. The oocyte was given the same optical and thermal properties as water for simplicity. As the temperatures6 were measured within 100 μm of the coverslip along the centre of the fiber, readings presented here were taken over a range from the coverslip surface for both pulse lengths considered. Figure 4 shows the distribution of heat at the end of 1 and 2 ms pulses of the same energy () compared with the temperature distribution if heat conduction is ignored. A substantial difference in temperature at the interface of the glass coverslip is present between the two cases with conduction and the case without. When conduction is not considered, the temperature reaches 24.1°C, while the 1 and 2 ms pulses reach 16.2°C and 15.3°C, respectively. Beyond the distance (, ), the heat conduction pulses agree closely with the no conduction case. The heat conduction clearly shows the effect of locating cells on a glass slide, which is not strongly absorbing at the wavelength of light used for stimulation. This may have a more significant effect on smaller cells, such as spiral ganglion neurons.18 Figure 5(a) shows the change in temperature at positions 0, 25, and 100 μm above the glass surface. The peak temperatures summarised in Table 2. The two cases where the temperature measured is close to the glass slide both show a much more rapid decrease in temperature than the 100 μm case, which displays a slight increase in temperature for after the pulse. Additionally, the temperature decay for the 0 and 25 μm cases closely match the behavior observed in the experimental figures. The temperature gradient displayed in Fig. 5(b) also shows a similar trend, with a reduction in the gradient, over the first 200 μs of the pulse, when the temperature is measured on the glass. Moving the fiber so it is touching the coverslip increases the temperatures by 20% to 30% due to a reduction in the spread of the beam. The model compares well with the experimental measurements of temperature and shows a decrease in the ratio of temperature to pulse energy similar to that observed in Ref. 6. It also highlights the difference in peak temperature when cells are located on a nonabsorbing medium and may partially explain the differences seen between in vivo and in vitro work. Fig. 5Change in temperature during INS pulse and the resulting decay using the geometry used by Shapiro et al.6  Table 2Summary of simulated temperatures compared with results from Ref. 6.
4.Heating During Submillisecond PulsesHeat conduction during submillisecond pulses is likely to have negligible effect on INS and the temperature gradient during the pulse, as the thermal penetration depth () is smaller than the laser beam spot size typically used to irradiate the nerves. Nevertheless, it is still useful to confirm the heating properties of pulses under 1 ms and to consider the thermal decay from different pulse lengths. It also allows results to be compared between experiments more easily and also against theoretical calculations. A comparison can be made between pulses with a fixed energy, but variable duration (i.e., laser power is proportional to pulse duration) and a fixed power (i.e., energy dependent on pulse length). Figure 6(a) shows the temperature change during pulses of 35 μs, 100 μs, 350 μs, and 1 ms with a constant energy of 2 μJ (, , while Fig. 6(b) shows the temperature gradient during the same pulses. Figure 7 shows pulses using the same parameters in Fig. 6 (35 μs, 100 μs, 350 μs, and 1 ms) with a constant laser power of 20 mW for the duration of the pulse, with (a) displaying temperature and (b) temperature gradient. The pulse energy and power were selected to provide representative levels of the thresholds for 100 μs duration pulses with wavelengths and geometry similar to that in the literature. Figure 6(a) shows that the increase in temperature is slightly less for longer pulses with the same total energy, due to heat dissipation during the laser pulse. This is confirmed by the temperature gradient for the constant power case [Fig. 7(b)], which shows that the gradient decreases slightly over the duration of the 1 ms pulse. Additionally, the decay of heat after the pulse, is over a much greater timescale than the increase of heat from the laser pulse. After the 2 μJ pulse, the temperature gradient reduces to: . Fig. 6(a) Change in temperature during 35 μs, 100 μs, 350 μs and 1 ms pulses, all with an energy of 2 μJ; (b) temperature gradient during 2 μJ pulses.  Fig. 7(a) Change in temperature during 35 μs, 100 μs, 350 μs and 1 ms pulses, all with laser power of 20 mW; (b) temperature gradient during 20 mW pulses.  The maximum temperature and average temperature gradient can be more easily compared when plotted against the pulse length. The curves in Fig. 8 show the peak temperature and temperature gradient with different pulse lengths resulting from constant energy pulses (2 μJ) and constant power pulses (20 mW and 100 mW). Other model parameters are , , , . The data points in Fig. 8 show the calculated peak temperatures and temperature gradients corresponding to the stimulation threshold results for CAP recordings in gerbil cochleae from Izzo et al.20 and Richter et al.29 These calculated values use the model described in this paper with the geometry and laser parameters provided described in the relevant references. When plotted in this way, the Izzo et al.20 and Richter et al.29 control and acutely deafened results [Fig. 8(a) and 8(b)] visually suggests two regimes: for pulse length stimulation requires a minimum temperature gradient (i.e., energy over time or laser power) to achieve stimulation and below , where they suggest a minimum temperature (i.e., minimum pulse energy) is required. However, linear curve fitting based on two separate regimes does not provide a statistically significant improvement in the fit compared with a single line for either a constant power or constant pulse energy. The chronically deafened results from Richter et al.29 do not follow the same trend as the other data, showing no clear dependence on a temperature gradient or laser power. This may be due to the significant reduction () in spiral ganglion neurons due to the deafening process,29 requiring a larger volume of tissue to be stimulation to achieve the same level of neural stimulation. Fig. 8(a) Simulated peak temperature changes and (b) average temperature gradient resulting from INS at a wavelength of 1850 nm, for pulse lengths between 10 μs and 2000 μs. Experimental stimulation thresholds from Izzo et al.20 and Richter et al.29 are included for comparison.  A further comparison is made in Fig. 9 with data from Izzo et al.,17 where a more strongly absorbed wavelength of 1937 nm was used to stimulate auditory neurons in a gerbil. Here the model used a distance of 55 μm between the fiber and nerve similar to the distance reported by Ref. 17. We note that these results are more sensitive to the model parameters, especially the fiber distance and absorption, due to the higher absorption level at this wavelength. This accounts for the larger temperature increases and gradient. The trend of two regimes on either side of 100 μs remains suggestive, as seen in Fig 8, although firm conclusions cannot be drawn as there is only one point above 100 μs. Fig. 9(a) Simulated temperature changes and (b) temperature gradient resulting from INS at a wavelength of 1937 nm, for pulse lengths between 10 μs and 1000 μs. Data from Izzo et al.17 is included for comparison.  5.DiscussionModeling of heat conduction during INS allows for a more detailed comparison among different pulse parameters, wavelengths, and geometries. Analysis of pulses with a duration greater than 1 ms, shows that heat conduction is a significant factor in determining the final temperature and the temperature gradient. To minimize the thermal relaxation time, the emitter design and wavelength selection should aim to localize the light, as this is the dominant factor in thermal relaxation. It is possible that convection, through fluid perfusion in tissue or, in the case of cochlear stimulation, movement of perilymph, may provide an additional heat transfer mechanism. However, due to the low perfusion rates of most tissues () (Ref. 10), this is unlikely to have a strong affect on final temperatures, or the thermal decay. The results of the model, when compared with experimental results, suggest that there may be at least two regimes determining the response to an optical stimulus. Therefore, while existing publications do not provide sufficient data to draw a statistically sound conclusion, it is possible that the energy required to stimulate nerves by INS does not scale linearly with pulse length, as multiple biophysical processes appear to underly the mechanism of INS.6,8 Further experimentation is required to determine whether this is the case. Furthermore, detailed characterization of the energy dependence of INS will benefit the development of implants, allowing the total energy delivered to the tissue to be minimized while also reducing laser peak power requirements. Radiant exposures required for a threshold response during INS of in vitro cultures6–8,30 are typically higher than those for INS of peripheral nerves in vivo,2,5,31,32 which are again higher than those reported in the cochlea.1,17,20,29 Although it has been demonstrated that auditory hair cells are excitable through an opto-acoustic mechanism during INS in normal hearing animals,33 results with acutely deafened animals do not show a significant difference in radiant exposures,29 leaving this anomaly still requiring further explanation. Some of the difference between in vitro and in vivo work may be due to the cells being located upon a nonabsorbing medium, which does not heat up directly during exposure to the lasers typically used in INS. The model suggests that temperature is around 40% lower on the interface between water and glass, than if heat conduction were not a factor in cases where the cell is completely surrounded by light absorbing media. 6.ConclusionModeling of heat conduction during INS provides further insight into the temporal behavior of INS and improves the ability to compare different geometries and wavelengths. Pulses in the millisecond regime show significant differences in temperatures reached and temperature gradients over the duration of a pulse compared to when conduction is not considered. Analysis of experimental data with the model suggests the possibility of two broad regimes of INS: a pulse energy limited regime below approximately 100 μs and a temperature gradient limited regime for longer pulses. Further use of modeling combined with experimental work will allow the the detailed process behind INS to become better understood. AcknowledgmentsThis work was supported by the Australian Research Council under Linkage Project grant LP120100264. ReferencesC.-P. Richteret al.,
“Neural stimulation with optical radiation,”
Laser Photon. Rev., 5
(1), 68
–80
(2011). http://dx.doi.org/10.1002/lpor.200900044 1863-8880 Google Scholar
A. R. Dukeet al.,
“Spatial and temporal variability in response to hybrid electro-optical stimulation,”
J. Neural Eng., 9
(3), 036003
(2012). http://dx.doi.org/10.1088/1741-2560/9/3/036003 1741-2560 Google Scholar
L. E. Morenoet al.,
“Infrared neural stimulation: beam path in the guinea pig cochlea,”
Hearing Res., 282
(1–2), 289
–302
(2011). http://dx.doi.org/10.1016/j.heares.2011.06.006 HERED3 0378-5955 Google Scholar
C.-P. Richteret al.,
“Spread of cochlear excitation during stimulation with pulsed infrared radiation: inferior colliculus measurements,”
J. Neural Eng., 8
(5), 056006
(2011). http://dx.doi.org/10.1088/1741-2560/8/5/056006 1741-2560 Google Scholar
J. Wellset al.,
“Biophysical mechanisms of transient optical stimulation of peripheral nerve,”
Biophys. J., 93
(7), 2567
–2580
(2007). http://dx.doi.org/10.1529/biophysj.107.104786 BIOJAU 0006-3495 Google Scholar
M. G. Shapiroet al.,
“Infrared light excites cells by changing their electrical capacitance,”
Nat. Commun., 3 736
(2012). http://dx.doi.org/10.1038/ncomms1742 NCAOBW 2041-1723 Google Scholar
E. J. Katzet al.,
“Excitation of primary afferent neurons by near-infrared light in vitro,”
Neuroreport, 21
(9), 662
–666
(2010). http://dx.doi.org/10.1097/WNR.0b013e32833add3a NERPEZ 0959-4965 Google Scholar
E. S. Albertet al.,
“TRPV4 channels mediate the infrared laser evoked response in sensory neurons,”
J. Neurophysiol., 107
(12), 3227
–3234
(2012). http://dx.doi.org/10.1152/jn.00424.2011 JONEA4 0022-3077 Google Scholar
H. S. CarslawJ. C. Jaeger, Conduction of Heat in Solids, 2nd ed.Clarendon Press, New York
(1986). Google Scholar
M. Niemz, Laser-tissue Interactions: Fundamentals and Applications, Springer Verlag, Berlin
(2007). Google Scholar
H. H. Pennes,
“Analysis of tissue and arterial blood temperatures in the resting human forearm,”
J. Appl. Physiol., 1
(2), 93
–122
(1948). JAPYAA 0021-8987 Google Scholar
J. Unsworth,
“Heat diffusion in a solid sphere and Fourier theory: an elementary practical example,”
Am. J. Phys., 47
(11), 981
–983
(1979). http://dx.doi.org/10.1119/1.11601 AJPIAS 0002-9505 Google Scholar
T. HalldrssonJ. Langerholc,
“Thermodynamic analysis of laser irradiation of biological tissue,”
Appl. Opt., 17
(24), 3948
–3958
(1978). http://dx.doi.org/10.1364/AO.17.003948 APOPAI 0003-6935 Google Scholar
Parviz Moin, Fundamentals of Engineering Numerical Analysis, 2nd ed.Cambridge University Press, New York
(2010). Google Scholar
B. Chenet al.,
“Modeling thermal damage in skin from 2000-nm laser irradiation,”
J. Biomed. Opt., 11
(6), 064028
(2006). http://dx.doi.org/10.1117/1.2402114 JBOPFO 1083-3668 Google Scholar
Y. Itoet al.,
“Assessment of heating effects in skin during continuous wave near infrared spectroscopy,”
J. Biomed. Opt., 5
(4), 383
–390
(2000). http://dx.doi.org/10.1117/1.1287730 JBOPFO 1083-3668 Google Scholar
A. D. Izzoet al.,
“Laser stimulation of auditory neurons: effect of shorter pulse duration and penetration depth,”
Biophys. J., 94
(8), 3159
–3166
(2008). http://dx.doi.org/10.1529/biophysj.107.117150 BIOJAU 0006-3495 Google Scholar
K. Needhamet al.,
“Combined application of brain-derived neurotrophic factor and neurotrophin-3 and its impact on spiral ganglion neuron firing properties and hyperpolarization-activated currents,”
Hearing Res., 291
(1–2), 1
–14
(2012). http://dx.doi.org/10.1016/j.heares.2012.07.002 HERED3 0378-5955 Google Scholar
Y. Y. ChenA. W. Wood,
“Application of a temperature-dependent fluorescent dye (Rhodamine B) to the measurement of radiofrequency radiation-induced temperature changes in biological samples,”
Bioelectromagnetics, 30
(7), 583
–590
(2009). http://dx.doi.org/10.1002/bem.v30:7 BLCTDO 0197-8462 Google Scholar
A. Izzoet al.,
“Optical parameter variability in laser nerve stimulation: a study of pulse duration, repetition rate, and wavelength,”
IEEE Trans. Biomed. Eng., 54
(6), 1108
–1114
(2007). http://dx.doi.org/10.1109/TBME.2007.892925 IEBEAX 0018-9294 Google Scholar
A. C. Thompsonet al.,
“Modeling of light absorption in tissue during infrared neural stimulation,”
J. Biomed. Opt., 17
(7), 075002
(2012). http://dx.doi.org/10.1117/1.JBO.17.7.075002 JBOPFO 1083-3668 Google Scholar
J. A. CurcioC. C. Petty,
“The near infrared absorption spectrum of liquid water,”
J. Opt. Soc. Am., 41
(5), 302
(1951). http://dx.doi.org/10.1364/JOSA.41.000302 JOAOD6 1084-7529 Google Scholar
J.-L. Boulnois,
“Photophysical processes in recent medical laser developments: a review,”
Lasers Med. Sci., 1
(1), 47
–66
(1986). http://dx.doi.org/10.1007/BF02030737 LMSCEZ 1435-604X Google Scholar
T. L. BergmanF. P. Incropera, Fundamentals of Heat and Mass Transfer., Wiley, Hoboken, New Jersey
(2011). Google Scholar
J. D. Owenset al.,
“GPU computing,”
Proc. IEEE, 96
(5), 879
–899
(2008). http://dx.doi.org/10.1109/JPROC.2008.917757 IEEPAD 0018-9219 Google Scholar
D. Goddekeet al.,
“GPU acceleration of an unmodified parallel finite element navier-stokes solver,”
in Proc. IEEE Int. Conf. on High Performance Computing Simulation,
12
–21
(2009). Google Scholar
A. C. Thompsonet al.,
“Teraflop per second gravitational lensing ray-shooting using graphics processing units,”
New Astron., 15
(1), 16
–23
(2010). http://dx.doi.org/10.1016/j.newast.2009.05.010 NEASFS 1384-1076 Google Scholar
A. Izzoet al.,
“Laser stimulation of auditory neurons at high repetition rate,”
Proc. SPIE, 6435 64350R
(2007). http://dx.doi.org/10.1117/12.700846 PSISDG 0277-786X Google Scholar
C.-P. Richteret al.,
“Optical stimulation of auditory neurons: effects of acute and chronic deafening,”
Hearing Res., 242
(1–2), 42
–51
(2008). http://dx.doi.org/10.1016/j.heares.2008.01.011 HERED3 0378-5955 Google Scholar
G. M. Dittamiet al.,
“Intracellular calcium transients evoked by pulsed infrared radiation in neonatal cardiomyocytes,”
J. Physiol., 589
(6), 1295
–1306
(2011). http://dx.doi.org/10.1113/jphysiol.2010.198804 JOPHAN 0021-7948 Google Scholar
J. Wellset al.,
“Optically mediated nerve stimulation: identification of injury thresholds,”
Lasers Surg. Med., 39
(6), 513
–526
(2007). http://dx.doi.org/10.1002/(ISSN)1096-9101 LSMEDI 0196-8092 Google Scholar
N. M. Friedet al.,
“Noncontact stimulation of the cavernous nerves in the rat prostate using a tunable-wavelength thulium fiber laser,”
J. Endourol., 22
(3), 409
–413
(2008). http://dx.doi.org/10.1089/end.2008.9996 JENDE3 0892-7790 Google Scholar
I. Teudtet al.,
“Acoustic events and ’Optophonic’ cochlear responses induced by pulsed near-infrared LASER,”
IEEE Trans. Biomed. Eng., 58
(6), 1648
–1655
(2011). http://dx.doi.org/10.1109/TBME.2011.2108297 IEBEAX 0018-9294 Google Scholar
|
|||||||||||||||||||||||||||||||||||||||||||||||||||||||||||||||