|
|
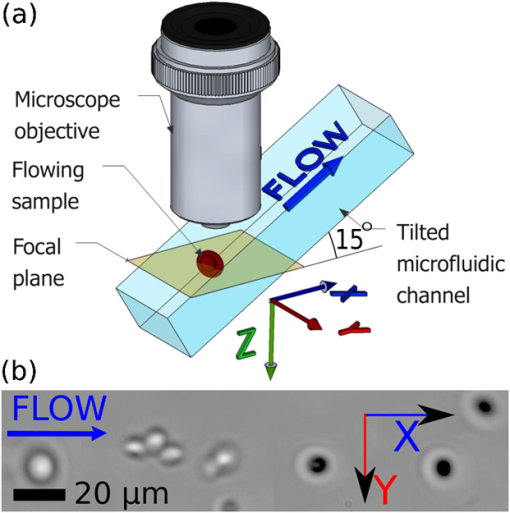
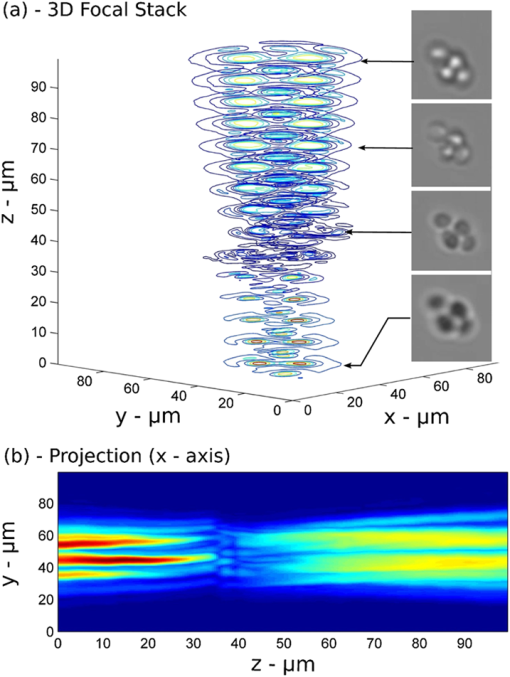
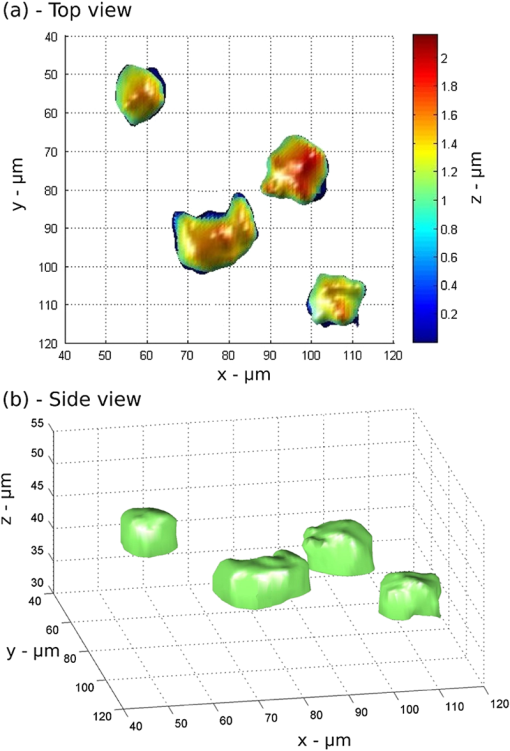
1.IntroductionMicrofluidic microscopy is a relatively new imaging technique based on guiding samples under the observation window by flowing them through a microfluidic channel. This includes conventional microscopes (e.g., objectives) with modified slide stages as well as lensless optofluidic microscopes.1–3 The fluid displacement increases sample throughput, provides control over sample sorting,4 and gives an additional degree of freedom for imaging. To date, in-plane flow has been used to generate two-dimensional (2-D) images by displacing the target over a one-dimensional (1-D) array of detectors,1 or to slightly displace the sample and generate subpixel-resolution images2 and holograms.3 Three-dimensional (3-D) imaging microfluidic devices have also been explored, but they have relied on multiple observation axes3,5 or multiple illumination angles.6 Here, we keep the well-known configuration for white light microscopy, with a single illumination source and objective lens, and reduce the experimental device to a straight microfluidic channel tilted along the optical axis (a lensless device is possible, but using an objective simplifies the design, facilitates integration with existing systems, and significantly improves image quality7). By taking successive images as the sample flows along the channel axis, we collect a set of intensity measurements at different propagation planes. There are two complementary uses for such data: phase retrieval in the focal plane via a transport-of-intensity equation8,9 and volume imaging by assembly of the optical slices.10,11 In the former case, the tilt should be shallow, to reduce large variations in the phase and better approximate the diffraction derivatives using two spatially separated images. In the latter case, a steeper tilt is necessary, so that the bulk of the sample falls within the focal region. 2.Experimental SetupThe experimental setup is shown in Fig. 1. A 500-μm-wide, 50-μm-deep microfluidic channel is etched on a glass slide and located at the focal plane of a standard wide-field microscope. The slide is tilted at a 15-deg angle, , with respect to the optical axis of the microscope objective, chosen to represent a good compromise between magnification and axial defocusing. The channel is illuminated with incoherent white light, and a magnified image is recorded by a video camera operating at a constant frame rate of . As a test case, a suspension of 15 μm yeast cells in glycerol is flowed through the microfluidic channel. Fig. 1(a) Experimental setup. A microfluidic channel is located under the objective of a wide field microscope and tilted along the optical axis by an angle of 15 deg. The sample flows into the channel at a constant velocity. Multiple images are recorded by a camera operating at a constant frame rate. (b) Samples are observed as they flow along the channel axis and pass across the focal plane.  The frame rate and flow speed are adjusted so that each sample will be recorded in 100 consecutive frames as it passes from one end of the window of observation to the other. A constant flow is maintained using a fixed pressure difference (a 50-cm hydrostatic water column) between the channel input and output, and the exposure time is adjusted to reduce the flow-induced blur below the resolution limit of the imaging system. Narrow channel depth and high fluid viscosity guarantee a Hagen–Poiseuille type laminar flow.12 In addition, the concentration of particles is lower than for easy separation and to reduce interactions between flowing particles. 3.Principles of OperationThe parabolic velocity flow ensures that particles flow at a constant velocity () along the channel axis but experience a shear-induced rotation at other points. As the acquisition of accurate focal stacks relies on the absence of rotation (or its compensation), the setup has been designed to minimize the effects of shear in all directions. Along the channel axis , the absence of shear, , is a property of the laminar flow. Along the axis, shear-induced rotation effects are minimized by observing samples flowing in the middle part of a wide channel. Similarly, along the axis, rotating objects are excluded by considering only particles flowing at the highest velocity in the middle of the channel, where the shear effects cancel. We note, however, that object rotation may be useful in other contexts, e.g., for multiple viewpoints, and is easily accessible by changing the injection point or imaging different parts of the flow. Focal stacks are generated by tracking samples flowing into the channel, as shown in Fig. 2. The background noise is subtracted from the signal, and the zero value of the signal (in gray) corresponds to the nominal transparency of the free-running fluid. Let be the frame recording period, and the object displacement along the channel axis between two frames. Let be the intensity of frame . The focal stack, , is given by Fig. 2Focal stacks are generated by observing samples as they flow in the tilted microfluidic channel. Constant flow velocity and frame rate enable the accumulation of frames progressively defocused along the axis. An object-tracking algorithm based on defocusing invariant properties of the center of gravity of the image is used for better accuracy. (a) Measured iso-intensity contours of yeast cells through focus (). Insets show direct images of cells. (b) Normalized intensity of focal stack with background subtracted.  The extraction of focal stacks is based not only on the estimated position of the sample but also on the point spread function of the imaging system, . In general, the function can depend on position, which may vary due to fluctuations in the flow. We compensate for this by using a simple method of particle tracking. Assuming that satisfies the symmetry condition , the first moment of the recorded image, becomes a defocusing invariant.13 In our reconstruction algorithm, we compute the center of mass for each frame in the focal stack. In the (, ) plane, the position of allows an accurate alignment of frames onto each other. Along the optical axis, the relation allows a precise determination of the amount of defocusing.The reconstruction of the volume absorption distribution of the object, , relies on solving the well-known deconvolution problem using the experimentally measured focal stack, , and point spread function, , in 3-D space. satisfies the volume integral where . In the ideal treatment of this problem, the optical transfer function, , has only nonzero terms, so that the solution of Eq. (3) is given byUnfortunately, this solution is known to be extremely sensitive to experimental noise.14 A variety of noise-reducing techniques have been developed to recover the object if the point spread function is not known, e.g., maximum likelihood estimation15 and blind deconvolution.16 In these methods, which in general can be quite complex, the point spread function is guessed instead of measured. Adaptive measures,17 which are particularly suited to flowing objects, or engineered point spread functions18 can be used as well. In the experiment here, we directly measure the point spread function of the microscope by acquiring the focal stack of sub-micron-based reference particles. For this calibration, we use a suspension of 800 nm dyed polystyrene beads in glycerol, with flow velocity, frame rate, and exposure conditions identical to those of the samples. We record a focal stack as we track one of the flowing reference particles, align the defocused images using the defocusing invariant , and check that the field of observation is clear of other flowing objects. The resulting stack, centered in the window of computation and normalized to unitary absorption, represents the point spread function of the microfluidic microscope for this particular tilt angle. Although not done here, these particles can be embedded in the flow with the samples themselves, acting as real-time reference points for changing conditions and/or shear compensation. Even with a known point spread function, the inversion (4) is sensitive to zeros and noise in the measurement. To compensate for this, we use a Wiener deconvolution filter.19 To implement the filter, we return to Eq. (3) and consider explicitly an additive noise term, , which we assume to be independent from the signal. Equation (3) becomes: The principle of the Wiener filter is to find the best deconvolution operator, , so that the retrieved object minimizes the RMS reconstruction error .The Wiener solution, representing an optimal compromise between noise and resolution, is given by where is a regularization constant corresponding to the inverse value of the signal-to-noise ratio. To implement this regularization, the signal intensity is normalized to 1 and the root-mean-square value of the noise (background intensity) is measured in an empty area near the flowing object.4.ResultsExperimental results on flowing yeast cells are shown in Fig. 3. The focal stack, , and the point spread function, , are each processed using Eq. (6). 3-D data is retrieved, enabling the construction of iso-level surface contours. Figure 3(a) shows a projection of these contours along the optical axis, revealing small-scale surface features () which are clearly resolved (though smoothed somewhat by the regularization process). Most likely, they are due to early-stage budding, though many other factors can contribute to their morphology.20 Figure 3(b) gives contours from the side, showing that all the cells lie in the same vertical plane (a result of the controlled injection) and that each cell has flat side walls. Such deformation is common in flowing cells21 and is often used as a diagnostic.22 As stated above, both the observed shapes and surface profiles are minimally affected by noise in the deconvolution process, as Wiener regularization optimally smooths the reconstructed profiles. We emphasize that many details that are hidden in standard imaging using 2-D projections, such as cell orientation, 3-D shape, and surface roughness, are readily apparent in the volume images here. Fig. 3The three-dimensional (3-D) structure of flowing yeast cells is reconstructed digitally using Eq. (6). (a) An iso-level surface shows subcellular structures at the surface of the cellular membrane. (b) A three-quarter view of the samples, showing smooth structure of the cell walls and relative height in the channel.  5.ConclusionsIn conclusion, we have introduced a new 3-D imaging technique based on recording a focal stack from samples flowing through a tilted microfluidic channel. As an example, we presented in-flow volume imaging of aggregated yeast cells, showing their size, position, orientation, and subcellular surface features. The method can be implemented on any existing microfluidic microscope and is ideally suited for 3-D profiling in flow cytometers. AcknowledgmentsThe authors are grateful to their collaborators from the Complex Fluids Group at Princeton University. ReferencesX. Henget al.,
“Optofluidic microscopy: a method for implementing a high resolution optical microscope on a chip,”
Lab Chip, 6
(10), 1274
–1276
(2006). http://dx.doi.org/10.1039/b604676b LCAHAM 1473-0197 Google Scholar
G. Zhenget al.,
“Sub-pixel resolving optofluidic microscope for on-chip cell imaging,”
Lab Chip, 10
(22), 3125
–3129
(2010). http://dx.doi.org/10.1039/c0lc00213e LCAHAM 1473-0197 Google Scholar
W. BisharaH. ZhuA. Ozcan,
“Holographic optofluidic microscopy,”
Opt. Express, 18
(26), 27499
–27510
(2010). http://dx.doi.org/10.1364/OE.18.027499 OPEXFF 1094-4087 Google Scholar
S. S. H. TsaiI. M. GriffithsH. A. Stone,
“Microfluidic immunomagnetic multi-target sorting—a model for controlling deflection of paramagnetic beads,”
Lab Chip, 11
(15), 2577
–2582
(2011). http://dx.doi.org/10.1039/c1lc20153k LCAHAM 1473-0197 Google Scholar
S. Yanget al.,
“Stereoscopic optofluidic on-chip microscope,”
in Proc. IEEE Winter Topicals,
91
–92
(2011). Google Scholar
S. Isikmanet al.,
“Lens-free optical tomographic microscope with a large imaging volume on a chip,”
Proc. Natl. Acad. Sci. U. S. A., 108
(18), 7296
–7301
(2011). http://dx.doi.org/10.1073/pnas.1015638108 PNASA6 0027-8424 Google Scholar
N. PégardJ. Fleischer,
“Optimizing holographic data storage using a fractional Fourier transform,”
Opt. Lett., 36
(13), 2551
–2553
(2011). http://dx.doi.org/10.1364/OL.36.002551 OPLEDP 0146-9592 Google Scholar
M. R. Teague,
“Deterministic phase retrieval: a Greens function solution,”
J. Opt. Soc. Am., 73
(11), 1434
–1441
(1983). http://dx.doi.org/10.1364/JOSA.73.001434 JOSAAH 0030-3941 Google Scholar
S. GorthiE. Schonbrun,
“Phase imaging flow cytometry using a focus-stack collecting microscope,”
Opt. Lett., 37
(4), 707
–709
(2012). http://dx.doi.org/10.1364/OL.37.000707 OPLEDP 0146-9592 Google Scholar
A. Erhardtet al.,
“Reconstructing 3-D light-microscopic images by digital image processing,”
Appl. Opt., 24
(2), 194
–200
(1985). http://dx.doi.org/10.1364/AO.24.000194 APOPAI 0003-6935 Google Scholar
N. PégardJ. Fleischer,
“3D microfluidic microscopy using a tilted channel,”
Biomedical Optics, Optical Society of America, Miami, Florida
(2012). Google Scholar
H. StoneS. Kim,
“Microfluidics: basic issues, applications, and challenges,”
AIChE J., 47
(6), 1250
–1254
(2001). http://dx.doi.org/10.1002/aic.690470602 AICEAC 0001-1541 Google Scholar
M. R. Teague,
“Irradiance moments: their propagation and use for unique retrieval of phase,”
J. Opt. Soc. Am., 72
(9), 1199
–1209
(1982). http://dx.doi.org/10.1364/JOSA.72.001199 JOSAAH 0030-3941 Google Scholar
A. Tikhonovet al., Numerical Methods for the Solution of Ill-Posed Problems, Springer, New York
(1995). Google Scholar
W. Richardson,
“Bayesian-based iterative method of image restoration,”
J. Opt. Soc. Am., 62
(1), 55
–59
(1972). http://dx.doi.org/10.1364/JOSA.62.000055 JOSAAH 0030-3941 Google Scholar
T. ChanC.-K. Wong,
“Total variation blind deconvolution,”
IEEE Trans. Image Process., 7
(3), 370
–375
(1998). http://dx.doi.org/10.1109/83.661187 IIPRE4 1057-7149 Google Scholar
W. Donget al.,
“Image deblurring and super-resolution by adaptive sparse domain selection and adaptive regularization,”
IEEE Trans. Image Process., 20
(7), 1838
–1857
(2011). http://dx.doi.org/10.1109/TIP.2011.2108306 IIPRE4 1057-7149 Google Scholar
S. Pavaniet al.,
“Three-dimensional, single-molecule fluorescence imaging beyond the diffraction limit by using a double-helix point spread function,”
Proc. Natl. Acad. Sci. U. S. A., 106
(9), 2995
–2999
(2009). http://dx.doi.org/10.1073/pnas.0900245106 PNASA6 0027-8424 Google Scholar
C. ChatwinR. Wang, Frequency Domain Filtering Strategies for Hybrid Optical Information Processing, Research Studies Press, Baldock, United Kingdom
(1996). Google Scholar
Y. Ohyaet al.,
“High-dimensional and large-scale phenotyping of yeast mutants,”
Proc. Natl. Acad. Sci. U. S. A., 102
(52), 19015
–19020
(2005). http://dx.doi.org/10.1073/pnas.0509436102 PNASA6 0027-8424 Google Scholar
M. Abkarianet al.,
“Cellular-scale hydrodynamics,”
Biomed. Mater., 3
(3), 034011
(2008). http://dx.doi.org/10.1088/1748-6041/3/3/034011 BMATEM 1748-6041 Google Scholar
C. Westendorfet al.,
“Live cell flattening—traditional and novel approaches,”
BMC Biophys., 3
(1), 9
(2010). http://dx.doi.org/10.1186/1757-5036-3-9 Google Scholar
|

