
|
|
1.IntroductionDental caries is a multi-factorial disease process that results in localized dissolution and destruction of the calcified dental tissues. An incipient lesion or subsurface lesion is a type of caries that has an intact enamel surface with no cavitation.1,2 Developing of an enamel lesion without breakdown of the outer surface is more common in case of early lesions. The surface layer covering the lesion is usually a mineral rich area with less dissolution susceptibility, which is unlike the subsurface area where the dissolution takes place and has less mineral content.1 Once the lesion reaches the dentin, it will spread eventually causing progression of the lesion with intact enamel, at which stage a surgical intervention to remove the caries is inevitable.3 On the other hand, the demineralization process can be reversed, especially at early stages, in the presence of bioavailable calcium and phosphate ions in the environment. It is believed that remineralization would also be accelerated or enhanced by the effect of fluoride.4 For instance, the addition of calcium and phosphate in the form of phosphoryl oligosaccharide of calcium (POs-Ca) or that with fluoride (POs-Ca+F) to a chewing gum (Ezaki Glico, Osaka, Japan) enhanced enamel remineralization of subsurface enamel lesions in a clinical study.5,6 Early detection of these incipient caries followed by objective monitoring in the course efforts to arrest or remineralize them is critical to concerns in the modern dentistry. Visual inspection is one of the most common diagnostic methods in lesion assessment. Although the International Caries Detection and Assessment System (now ICDAS-II), based on visual examination, has been introduced as a novel system to diagnose dental caries,7 the subjectivity of this method could affect its usage. Conventional radiography is suitable for cavitated lesions but not early incipient lesions, due to low resolution and superimposition of structures that could impede the correct diagnosis of the exact lesion.8 Other diagnostic methods based on light-induced or laser-stimulated fluorescence and electric conductivity have been developed.9–11 Nevertheless, these systems do not provide cross-sectional images of the dental structure, and their effectiveness to track the minimal changes in enamel subsurface lesion has been moderate. Therefore, the development of a user-friendly technology to assist real-time characterization of early lesions is among research priorities recommended by expert work groups.12 Optical coherence tomography (OCT) is a noninvasive, cross-sectional imaging system that can visualize the internal structures nondestructively.13 OCT was developed on the concept of low-coherence interferometry where the light is projected over a sample, and the backscattered signal intensity from the scattering medium reveals depth-resolved information about scattering and reflection of the light in the sample. It performs cross-sectional images generated by performing multiple axial measurements of echo time delay (axial scans or A-scans) and scanning the incident optical beam transversely. This generates a two-dimensional data set, which represents the optical backscattering in a cross-sectional plane through the tissue. Images or B-scans can be displayed in a false color or gray scale to visualize tissue changes. The conventional OCT imaging system was based on the principles of time-domain OCT (TD-OCT), where a mirror mechanically scans a distance at the reference arm to enable resolving of the depth information. More recently, spectral-domain OCT systems have been developed, in which the mechanical scanning at the reference mirror has been eliminated and the images are obtained in a shorter time.14 Simplification of this system by encoding the spectral components (wavenumber) in time, generated the swept-source OCT (SS-OCT). In this technology, the laser source sweeps near-infrared wavelength within milliseconds of scan delays at kilohertz rates in order to achieve real-time imaging. SS-OCT is the latest implementation of imaging technology with a promising prospect as a chair-side diagnostic modality in dentistry, due to its enhanced two-dimensional (2-D) and three-dimensional (3-D) scanning speed and image resolution. This modality has been validated to score carious lesion extent and detect cracks and dental restoration defects.15–18 OCT has been widely used in assessment of demineralization based on two main principles; increased light scattering in the porous demineralized tissue, and depolarization of the incident light by the demineralized tissue. The latter necessitates a polarization-sensitive OCT (PS-OCT) or cross-polarization OCT setup,19–21 but the former phenomenon can be observed as increased signal intensity by both conventional and polarized-sensitive OCT systems. Image analysis techniques in correlative OCT studies have been mainly based on the increased signal intensity values to quantify parameters such as depth (as a cut-off point) and mineral loss (dB values integrated over depth) in demineralized lesions.22 however, there are fewer studies on the assessment of remineralization by conventional OCT. Quantitative measurement of other optical properties that are based on light propagation in tissue may potentially provide a repeatable means of the tissue characterization. Among those properties, the attenuation coefficient has shown promising results in discriminating between healthy and diseased states of various tissues including the epithelial tissues, arteries, skin, and lymph nodes.23,24 This parameter was noted in relation to enamel demineralization and remineralization,25,26 however, few studies have investigated the parameter at the 1300-nm OCT wavelength range against mechanical properties of enamel in a wide range of lesion conditions. The aim of this study was to evaluate the optical changes and attenuation coefficient in the remineralized enamel subsurface lesion by POs-Ca with or without fluoride, and to correlate these findings with their mechanical hardness using nanoindentation test. Two null hypotheses were established in this study; (1) the attenuation coefficient derived from the OCT signal did not depend on enamel mineral condition, and (2) there was no correlation between the OCT parameter and nanoindentation hardness. 2.Materials and Methods2.1.Preparation of the SamplesFresh bovine incisors were obtained from a local slaughter house (Yokohama, Japan). After cleaning the bovine teeth of debris and soft tissue, enamel blocks () () were cut from the incisors using a low speed diamond saw (Isomet; Buehler, Lake Bluff, Illinois) under running water, and embedded in acrylic resin (Unifast Trad; GC, Tokyo, Japan). The outer enamel surface was polished to a mirror finish using wet polishing papers (800, 1000, 1200, 1500, and 2000 grit lapping papers; 3M, St. Paul, Minnesota). Three areas, namely sound (SND), demineralized (DEM), and remineralized (REM), were assigned on the polished enamel surface of each block as follows; first, one-third of the surface on each block was covered with a nail varnish (nail POP; Chamon, Gyeonggi, South Korea), which served as the SND portion. Second, subsurface lesions were then formed on the remaining surface using the two-layer demineralization method with 8% methylcellulose gel (Methocel MC; Fluka, Everett, Washington) and 0.1 M lactate buffer (pH 4.6) at 37°C for 14 days.27 The ratio of gel to lactate buffer was 3:5, respectively. After demineralization, the blocks were sterilized by ethylene oxide gas sterilizer (Steri-Gas; 3M, St. Paul, Minnesota). Third, the middle-third of the surface was kept as a DEM area, and the remaining third of enamel surface, which was cut away by low speed saw, served as REM area as described below. 2.2.Immersion in Remineralizing SolutionEight demineralized specimens () were immersed in 10 ml of one of the three differently prepared solutions for up to 14 days; the deionized water group was used as a control group (), the POs-Ca remineralizing solution group, which contains 100 mM KCl, 3.6 mM , 1.5 mM , 20 mM HEPES, plus 0.36% of POs-Ca () was the second group, and the POs-Ca+F remineralizing solution group, that was similar in composition to POs-Ca group, but with the addition of 1 ppm of fluoride extracted from green tea (POs-Ca+F) was the third group. The specimens were stored in incubator at 37°C and the pH of the solutions was monitored and refreshed daily. 2.3.OCT SystemThe SS-OCT system (OCT-2000, Santec, Komaki, Japan) that incorporates a high-speed frequency, swept the external cavity laser, and the wavelength ranged from 1260 to 1360 nm (centered at 1310 nm) at a 20-kHz sweep rate. Backscattered light from the subject is coupled back to the OCT system, in which the interference signal is digitized in time scale, and then analyzed in the Fourier domain to reveal the depth information of the subject. The axial and lateral resolutions of the system in air were 11 and 17 μm, respectively. The system acquired the image data (B-scan) in 0.3 s, including the processing time. The imaging range in this study was 5 mm (width) by 6.6 mm (height), forming a image. The sensitivity of this system and the shot-noise limited sensitivity were 106 and 119 dB, respectively. 2.4.OCT Imaging of the SpecimensThe hand-held scanning probe connected to the OCT system was set at 5-cm distance from the specimen surface, with the scanning beam oriented about 90 deg to the surface. A custom-made jig was mounted on a micrometer stage to keep each specimen surface parallel to the probe plane. For each specimen, the cross-sectional images were acquired from SND and DEM areas as well as REM area after 4, 7, and 14 days of remineralization at the center of the window. The specimens were removed from the solutions, cleaned with ultrasonic to remove any precipitants on the surface and washed by distilled water, and then OCT images were scanned in controlled hydrated condition after blot drying of the surface with no visible water droplets.28 In order to ensure the repeatability of the OCT scan during remineralization, the specimens were placed at the same orientation as accurately as possible every time, and the B-scan was performed along a line between two points marked by a marker pen on the specimen surface. 2.5.OCT Image AnalysisFor image analysis, a custom code in the image analysis software (ImageJ version 1.45S; Wayne Rasband, NIH, Bethesda, Maryland) was used to read the raw data of the OCT. The obtained OCT image was rotated to compensate for the tilting during the scan to reach a horizontal surface. A noise reducing median filter (size 2) was applied to the data. A region of interest (ROI, width 400 μm) from the surface of enamel to deeper levels was selected and converted to a signal-intensity depth profile. The OCT-attenuation coefficient () was calculated on each average signal-intensity profile based on the exponential decay of irradiance from the surface of the specimen using the equation derived from Beer-Lambert law, in the following function:29 where is the reflectivity signal intensity in (dB) and is the depth variable in mm. was calculated using linear least-squares regression to fit the natural log of average OCT profiles obtained from the ROI.2.6.Nanohardness TestSections from the SND, DEM and 14-day REM areas used for OCT and were then embedded in epoxy resin (EpoxiCure; Buehler, Lake Bluff, Illinois). In order to produce smooth, cross-sectional surfaces suitable for the nanoindentation test, each sample was sequentially trimmed and polished by silicon-carbide papers in an ascending order starting from #600 and up to #2000, followed by diamond slurries with particle sizes of ranging from 6 to 0.25 μm by using an automatic lapping machine (Maruto, Tokyo, Japan). The nanohardness profiles of the DEM and REM areas were measured with a nanoindentation device (ENT-1100a; Elionix, Tokyo, Japan) down to 220 μm in depth. On each area across the polished cross-section, a minimum of 400 indentations were performed along 40 rows each with 10 points with a spacing of 10 μm between each two neighboring points; the first 200 indentation points were programmed on 20 lines with a 1-μm distance between each two adjacent lines (first 20 μm) in the axial direction. The first row was with resin approximately right above the visible enamel border. Second, the next 200 points started 10 μm below the last row of indentations with 10 μm spacing in the axial direction (final depth of 220 μm). For all indentations, the maximum load was 2 mN with loading rate of , using a Berkovich diamond tip. The nanoindentation was performed on three samples in each group. In sum, over 10,000 indentations were performed in this study. To calculate Martens hardness (H) in MPa, the load was divided over the projected area under maximum load, which would include both elastic and plastic deformation: In addition to the hardness profile for each area, integrated nanohardness (INH) values were calculated for the whole lesion, as the area under the hardness-depth curved up to the average lesion depth (140 μm). 2.7.Statistical AnalysisPearson’s correlation was used to examine the relationship between and INH for each specimen, including SND, REM, and DEM areas. Kolmogorov Smirnoff tests were used to determine normal distribution of the data and to select proper analyses. Repeated measures of ANOVA were used to compare among groups with time series as the factor. In order to compare at different times within each remineralizing solution, one-way ANOVA with Tukey’s post-hoc test were used. Similarly, INH values were analyzed by one-way ANOVA with Tukey’s post-hoc test between the groups. All statistical analyses were performed with 95% level of confidence with the Statistical Package for Medical Science (SPSS Ver.11 for Windows, SPSS, Chicago, Illinois) (). 3.ResultsOCT images of SND, DEM and REM enamel in each group are presented in Fig. 1. There was a conspicuous prominence of the enamel lesion shown in the OCT image of DEM area, with a high reflectivity from the lesion and a sudden drop of the reflectivity just beneath the lesion, which revealed a lesion boundary. The optical lesion depth (from the surface to the boundary) was . The real depth can be calculated by dividing the optical depth over the approximate refractive index of enamel (1.6) which was equal to . With remineralization in both POs-Ca groups, the intensity of the optical boundary declined and visual changes were observed in the OCT image. Figure 2(a) represents OCT signal intensity profiles obtained from the ROI, with the fitted lines to calculate in Fig. 2(b). Fig. 1B-scan images of SS-OCT of Control, POs-Ca and POs-Ca+F groups, arrows indicate the lesion boundary and the vertical scale bar represents 400 μm optical axial distance (a) Sound enamel, (b) DEM, (c) after 4-day remineralization, (d) after 7-day remineralization, and (e) after 14-day remineralization.  Fig. 2(a) Signal intensity profile of POs-Ca showing sound, DEM, 4, 7, and 14 days remineralization. Remineralization resulted in higher signal levels from deeper areas. (b) An OCT attenuation coefficient () was calculated using linear least-squares regression to fit the natural log of average OCT profiles obtained from the ROI. The sound enamel has the lowest attenuation coefficient while the DEM has the highest. With remineralization, a decrease in the parameter values was evident. Note that the Beer-Lambert law takes a depth factor of 2.  Nanoindentation confirmed that both POs-Ca+F and POs-Ca resulted in remineralization of the whole lesion. Figure 3(a) demonstrates a stereo microscopic image of a representative sample after nanoindentation. The mean hardness profiles of all groups are shown in Fig. 3(b). As confirmed by INH, REM areas showed remarkable improvement compared to the corresponding DEM areas, except for the control group. While the hardness of the surface layer (superficial 10 μm) appeared to be higher in POs-Ca+F group, there was no significant difference in INH between POs-Ca+F () and POs-Ca () (), [Fig. 3(c)]. None of the treatments resulted in recovering of the INH of SND enamel () (). Fig. 3(a) Optical microscopic image of polished enamel surface after nanoindentation. (b) Mean hardness profile for SND, DEM, control, POs-Ca and POs-Ca+F areas. (c) A bar graph showing INH of all groups; asterisk (*) shows significant difference with DEM (). Horizontal bar indicates no significant difference among time subgroups ().  There was a good correlation between the optical and mechanical parameters, and INH. With remineralization, decreased and INH increased (Pearson’s correlation , , 95% CI for to ). A linear regression was established between the two parameters (, Fig. 4), validating the parameter. Fig. 4and INH correlation (, 95% CI: to ), the best regression was established with a linear fit (). 95% CIs of the fit line are displayed. 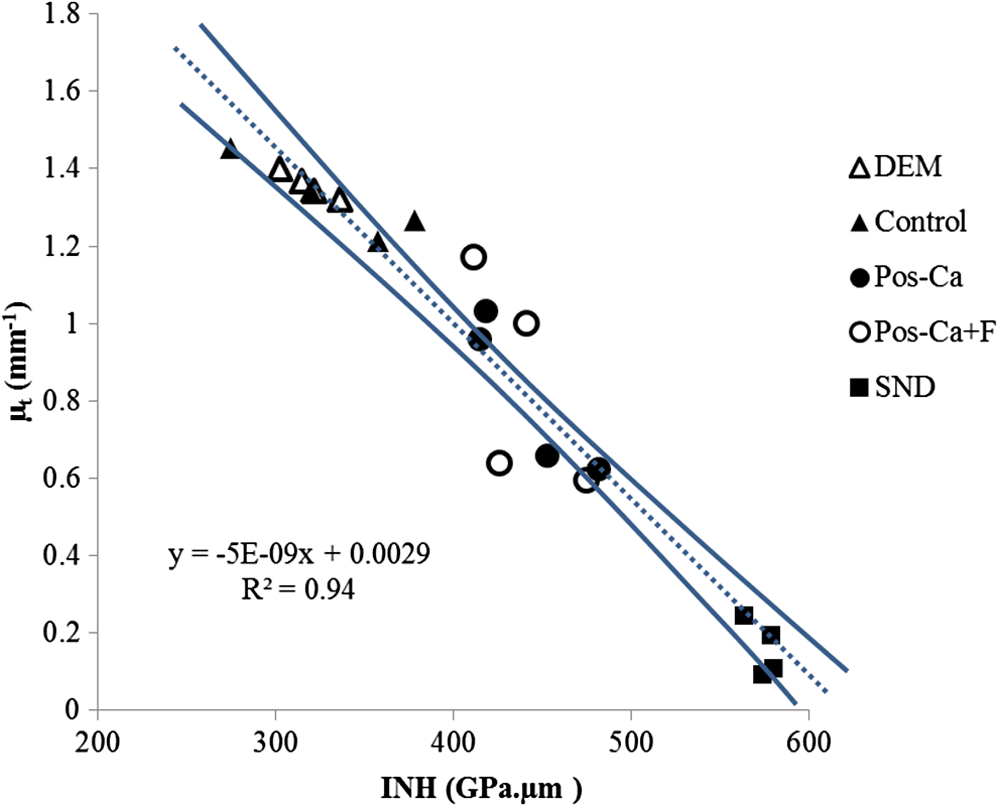 The average data of all groups are summarized in a chart (Fig. 5). Repeated measures ANOVA showed that the within subject factor (remineralization time) significantly affected (, ). Similarly, the between-subject factor (remineralization solution) and the interaction of the factors were significant (). The of SND area showed the smallest reading (range 0.08 to ) which meant that the fitting line had the lowest slope, On the other hand, DEM areas showed the highest values which ranged between 1.34 and , This indicated rapid loss of signals in deeper areas. With remineralization, values were significantly recovered in POs-Ca and PO-Ca+F groups (), reaching up to mean values of 0.81 and respectively. Meanwhile, there was no noticeable change in the control group (). POs-Ca+F showed a rapid and significant drop in at day 4 (), but no further decrease took place after that. On the other hand, POs-Ca group showed a gradual decrease in the attenuation coefficient up to seven days of remineralization (), but no significant difference was detected after that. values of PO-Ca+F and POs-Ca were close to each other at the end of a 14-day remineralization. 4.DiscussionIn this study, we examined the capability of OCT to detect changes induced by de/remineralization in enamel subsurface lesion. The B-scan images obtained from both treatment groups displayed a decrease in the reflectivity of the lesion body, with a decreased contrast at the lesion boundary. In a previous study, it was shown that OCT had the potential for quantitative estimation of lesion depth and mineral loss in a demineralized dentin lesion, which revealed a definite boundary suggesting the lesion front.22 The appearance of an enamel lesion boundary was also shown in another study.28 In fact, this appearance has been the basis for scoring the extent of natural caries using OCT.16,30 These studies suggest that backscatter signal intensity increases with demineralization due to scattering at the numerous microinterfaces created in the hard tissue by the dissolution process of mineral.22,30 On the other hand, it was expected that the signal intensity would decrease when porosities were filled by mineral aggregation during remineralization. Nevertheless, in the current study, some remineralized samples showed a slight change or increase in the signal intensity from the surface zone [Fig. 2(a)], which made it difficult to perform objective comparisons using the integrated or mean intensity parameters commonly known for PS-OCT.31,32 Attenuation can be regarded as another parameter for analysis of OCT backscatter signal. Sound enamel strongly attenuates light in the visible range, but the magnitude of scattering at higher wavelengths is lower than in the visible range. OCT imaging of early lesions at 850 nm showed that signal patterns and attenuation were different between sound enamel and early enamel lesion.25,33 It is noteworthy that in the near infra-red region around the 1300 nm wavelength sound enamel becomes highly transparent,34,35 while at a smaller wavelength (e.g., 850 nm), sound enamel attenuates the signal and there is an effective imaging depth of around 100 μm.33 A previous study suggested that at this wavelength, the OCT signal slope of human enamel surface at a few hundred micrometers from the surface did not greatly depend on the prismatic orientation, and was much smaller than that of dentin,36 confirming that the magnitude of light scattering in sound enamel is prominently less than dentin.37 Moreover, OCT images of enamel carious lesions predominantly show a very low signal intensity from the structure immediately beneath the demineralized lesion, and it may be difficult to detect the location of the dentino-enamel junction (DEJ) at these locations.30 Therefore, in the current work, the potential of an attenuation parameter for assessment of lesion was investigated. The Beer-Lambert law equation employed in this study is based on a simple and well-established model assuming only a single back-scattering event during light propagation in the tissue at low optical depths.13,29 The factor of two in the exponent of Eq. (1) corresponds to the double distance of the backscatter light in OCT imaging. In order to validate the attenuation parameter , nanoindentation hardness was used to objectively measure an actual physical property of enamel structure. Hardness has for a time long been accepted as a measure of mineral density of the hard tissue derived from transverse microradiography,38 and nanoindentation at short depth increments, made possible by a precise specimen displacement stage, has shown promising results in characterization of enamel nanostructure at large depths.6 The outcome of nanohardness testing validated the OCT findings over a wide range of INH values in the current study. The sound enamel showed the smallest , while the DEM revealed the highest value, indicating a strong attenuation through the lesion. In REM area of the test groups, values consistently decreased. These findings confirmed that remineralization within the lesion decreased the OCT signal attenuation. Although remineralization had occurred in the test groups, the INH and were significantly different from those of sound enamel. This could be attributed to the composition of enamel structure. The apatite crystals require a prolonged period to complete re-crystallization in an environment supersaturated with regard to apatite crystals.5 Moreover, mineral aggregation at the superficial zone may result in a decreased rate of mineral deposition at the deeper areas due to blockage of diffusion pathways. Such hampering effect would depend on several factors, including the pH and molecular size of the remineralizing compound, surface zone characteristics, pore sizes throughout the lesion and demineralized depth.20 Permeability of the surface layer has an influence on infiltration39 and may affect remineralization of the enamel lesion.40 Nevertheless, the top-down remineralization phenomenon of subsurface lesions would still be clinically desirable over a situation where the early enamel lesion progresses towards cavitation or dentin involvement. Under the clinical conditions, mineral deposition over the surface is less likely, due to the presence of calcium phosphate precipitation inhibitors, salivary proteins, and plaque, acting as a fine membrane reducing mineral gains at the surface layer, and cyclic fluctuations in the plaque pH.41,42 In the current study, the surface layer thickness, which represented the changes from the surface to the subsurface lesion, was around 10 μm in thickness.43 It appeared that the addition of fluoride in the remineralizing solution had improved the outcome by enhancing a rapid remineralization, which was apparent from results at four days. It was previously found that the increased hardness at the superficial zone of enamel lesions remineralize in situ was a result of better crystalline structure and formation of more acid-resistant and denser fluoridated-apatite crystals, in the presence of slightly elevated salivary fluoride levels, bioavailable calcium and organic phosphate.6 Within the limitations of this in vitro study, the first and second hypotheses of this study were rejected. The SS-OCT was able to detect small enamel remineralization changes, and there was a significant correlation between optical and mechanical findings. In order to adopt such an optical parameter for clinical image analysis, it is also important to control the factors that can nonuniformly affect signal patterns and attenuation. Under conventional OCT, the reflection from surface results in a strong signal peak that may interfere with signal analysis.22 It has been shown that the hydration state affects the OCT signal intensity from enamel lesions in proportion to the demineralization extent.28 In the current study, imaging was performed under controlled hydrated conditions to minimize the effects of hydration factor and resemble the humid oral environment. Clinically, blot drying or gentle air drying of the surface would be necessary to remove excessive amounts of saliva or water over the area of interest. Also, cleaning the surface before imaging is essential as plaque and calculus could interfere with the light propagation through the lesion. Likewise, a protective cover placed over the OCT intraoral imaging probe for infection control purposes may refract and attenuate nonuniformly, therefore an autoclavable dental OCT intraoral probe that requires no disposable cover is desirable. It is also noteworthy that the depth of field is restricted in the current OCT systems; therefore, controlling the object-probe distance is important to maintain the image focused and avoid signal loss. Finally, monitoring of an enamel lesion based on the OCT signal attenuation over time appears to be a promising approach. However, the method should be tested for a larger range of lesions with various shapes, structures, and depths in the future studies. 5.ConclusionAlthough POs-Ca+F demonstrated a rapid remineralizing effect, similar outcome were obtained from both remineralizing solutions. Attenuation coefficient calculated from the OCT signal revealed its potential in assessment of the early enamel lesions as well as the remineralization process, which can be implemented clinically to monitor lesion mineralization progress. AcknowledgmentsThis work was supported by a grant from Japanese Ministry of education, Global Center of Excellence Program (GCOE), International Research Center for Molecular Science in Tooth and Bone Diseases; the Research Grant for Longevity Sciences (21A-8) from Ministry of Health, Labor, and Welfare; and Grant-in-Aid for Scientific Research (Nos. 23659886 and 24792019) from the Japan Society for the Promotion of Science (JSPS). Authors are also grateful to Drs. Ilnaz Hariri and Sahar Khunkar for their assistance. POs-Ca was donated by Ezaki Glico company for this research. ReferencesJ. ArendsJ. Christoffersen,
“The nature of early caries lesions in enamel,”
J. Dent. Res., 65
(1), 2
–11
(1986). http://dx.doi.org/10.1177/00220345860650010201 JDREAF 0022-0345 Google Scholar
M. J. LarsenO. Fejerskov,
“Chemical and structural challenges in remineralization of dental enamel lesions,”
Scand. J. Dent. Res., 97
(4), 285
–296
(1989). http://dx.doi.org/10.1111/j.1600-0722.1989.tb01615.x SJDRAN 0029-845X Google Scholar
M. G. Torreset al.,
“Assessment of enamel-dentin caries lesions detection using bitewing PSP digital images,”
J. Appl. Oral Sci., 19
(5), 462
–468
(2011). JAOSBM 1678-7765 Google Scholar
B. R. Schemehornet al.,
“Remineralization by fluoride enhanced with calcium and phosphate ingredients,”
J. Clin. Dent., 10
(1 Spec No), 13
–16
(1999). JCLDED Google Scholar
Y. Kitasakoet al.,
“Effects of a chewing gum containing phosphoryl oligosaccharides of calcium (POs-Ca) and fluoride on remineralization and crystallization of enamel subsurface lesions in situ,”
J. Dent., 39
(11), 771
–779
(2011). http://dx.doi.org/10.1016/j.jdent.2011.08.009 JDENAB 0300-5712 Google Scholar
Y. Kitasakoet al.,
“Gum containing calcium fluoride reinforces enamel subsurface lesions in situ,”
J. Dent. Res., 91
(4), 370
–375
(2012). http://dx.doi.org/10.1177/0022034512439716 JDREAF 0022-0345 Google Scholar
A. Jablonski-Momeniet al.,
“Reproducibility and accuracy of the ICDAS-II for detection of occlusal caries in vitro,”
Caries Res., 42
(2), 79
–87
(2008). http://dx.doi.org/10.1159/000113160 CAREBK 0008-6568 Google Scholar
R. HaakM. J. WichtM. J. Noack,
“Conventional, digital and contrast-enhanced bitewing radiographs in the decision to restore approximal carious lesions,”
Caries Res., 35
(3), 193
–199
(2001). http://dx.doi.org/10.1159/000047455 CAREBK 0008-6568 Google Scholar
P. RechmannB. M. RechmannJ. D. Featherstone,
“Caries detection using light-based diagnostic tools,”
Compend. Contin. Educ. Dent., 33
(8), 582
–584
(2012). Google Scholar
I. A. Pretty,
“Caries detection and diagnosis: novel technologies,”
J. Dent., 34
(10), 727
–739
(2006). http://dx.doi.org/10.1016/j.jdent.2006.06.001 JDENAB 0300-5712 Google Scholar
L. Karlsson,
“Caries detection methods based on changes in optical properties between healthy and carious tissue,”
Int. J. Dent., 2010 270729
(2010). http://dx.doi.org/10.1155/2010/270729 IJDNB4 1687-8736 Google Scholar
P. Mitropouloset al.,
“The impact of magnification on occlusal caries diagnosis with implementation of the ICDAS II criteria,”
Caries Res., 46
(1), 82
–86
(2012). http://dx.doi.org/10.1159/000335988 CAREBK 0008-6568 Google Scholar
D. Huanget al.,
“Optical coherence tomography,”
Science, 254
(5035), 1178
–1181
(1991). http://dx.doi.org/10.1126/science.1957169 SCIEAS 0036-8075 Google Scholar
M. Yamanariet al.,
“Visualization of phase retardation of deep posterior eye by polarization-sensitive swept-source optical coherence tomography with 1-mu m probe,”
Opt. Express, 17
(15), 12385
–12396
(2009). http://dx.doi.org/10.1364/OE.17.012385 OPEXFF 1094-4087 Google Scholar
T. A. Bakhshet al.,
“Non-invasive quantification of resin-dentin interfacial gaps using optical coherence tomography: validation against confocal microscopy,”
Dent. Mater., 27
(9), 915
–925
(2011). http://dx.doi.org/10.1016/j.dental.2011.05.003 DEMAEP 0109-5641 Google Scholar
Y. Shimadaet al.,
“Validation of swept-source optical coherence tomography (SS-OCT) for the diagnosis of occlusal caries,”
J. Dent., 38
(8), 655
–665
(2010). http://dx.doi.org/10.1016/j.jdent.2010.05.004 JDENAB 0300-5712 Google Scholar
P. Makishiet al.,
“Non-destructive 3D imaging of composite restorations using optical coherence tomography: marginal adaptation of self-etch adhesives,”
J. Dent., 39
(4), 316
–325
(2011). http://dx.doi.org/10.1016/j.jdent.2011.01.011 JDENAB 0300-5712 Google Scholar
K. Imaiet al.,
“Noninvasive cross-sectional visualization of enamel cracks by optical coherence tomography in vitro,”
J. Endod., 38
(9), 1269
–1274
(2012). http://dx.doi.org/10.1016/j.joen.2012.05.008 0099-2399 Google Scholar
M. H. LeC. L. DarlingD. Fried,
“Automated analysis of lesion depth and integrated reflectivity in PS-OCT scans of tooth demineralization,”
Lasers Surg. Med., 42
(1), 62
–68
(2010). http://dx.doi.org/10.1002/lsm.v42:1 LSMEDI 0196-8092 Google Scholar
H. KangC. L. DarlingD. Fried,
“Nondestructive monitoring of the repair of enamel artificial lesions by an acidic remineralization model using polarization-sensitive optical coherence tomography,”
Dent. Mater., 28
(5), 488
–494
(2012). http://dx.doi.org/10.1016/j.dental.2011.11.020 DEMAEP 0109-5641 Google Scholar
R. S. Joneset al.,
“Remineralization of in vitro dental caries assessed with polarization-sensitive optical coherence tomography,”
J. Biomed. Opt., 11
(1), 014016
(2006). http://dx.doi.org/10.1117/1.2161192 JBOPFO 1083-3668 Google Scholar
Y. Natsumeet al.,
“Estimation of lesion progress in artificial root caries by swept source optical coherence tomography in comparison to transverse microradiography,”
J. Biomed. Opt., 16
(7), 071408
(2011). http://dx.doi.org/10.1117/1.3600448 JBOPFO 1083-3668 Google Scholar
L. Scolaroet al.,
“Parametric imaging of the local attenuation coefficient in human axillary lymph nodes assessed using optical coherence tomography,”
Biomed. Opt. Express, 3
(2), 366
–379
(2012). http://dx.doi.org/10.1364/BOE.3.000366 BOEICL 2156-7085 Google Scholar
F. J. van der Meeret al.,
“Localized measurement of optical attenuation coefficients of atherosclerotic plaque constituents by quantitative optical coherence tomography,”
IEEE Trans. Med. Imaging, 24
(10), 1369
–1376
(2005). http://dx.doi.org/10.1109/TMI.2005.854297 ITMID4 0278-0062 Google Scholar
D. P. Popescuet al.,
“Assessment of early demineralization in teeth using the signal attenuation in optical coherence tomography images,”
J. Biomed. Opt., 13
(5), 054053
(2008). http://dx.doi.org/10.1117/1.2992129 JBOPFO 1083-3668 Google Scholar
A. Sadret al.,
“Monitoring of enamel lesion remineralization by optical coherence tomography: an alternative approach towards signal analysis,”
Proc. SPIE, 8566 856602
(2013). http://dx.doi.org/10.1117/12.2001629 PSISDG 0277-786X Google Scholar
J. M. ten Cateet al.,
“Preparation and measurement of artificial enamel lesions, a four-laboratory ring test,”
Caries Res., 30
(6), 400
–407
(1996). http://dx.doi.org/10.1159/000262351 CAREBK 0008-6568 Google Scholar
A. Nazariet al.,
“Effect of hydration on assessment of early enamel lesion using swept-source optical coherence tomography,”
J. Biophotonics, 6
(2), 171
–177
(2013). http://dx.doi.org/10.1002/jbio.v6.2 JBOIBX 1864-063X Google Scholar
J. M. Schmittet al.,
“Optical-coherence tomography of a dense tissue: statistics of attenuation and backscattering,”
Phys. Med. Biol., 39
(10), 1705
–1720
(1994). http://dx.doi.org/10.1088/0031-9155/39/10/013 PHMBA7 0031-9155 Google Scholar
H. Nakagawaet al.,
“Validation of swept source optical coherence tomography (SS-OCT) for the diagnosis of smooth surface caries in vitro,”
J. Dent., 41
(1), 80
–89
(2013). http://dx.doi.org/10.1016/j.jdent.2012.10.007 JDENAB 0300-5712 Google Scholar
H. KangC. L. DarlingD. Fried,
“Nondestructive monitoring of the repair of enamel artificial lesions by an acidic remineralization model using polarization-sensitive optical coherence tomography,”
Dent. Mater., 28
(5), 488
–494
(2012). http://dx.doi.org/10.1016/j.dental.2011.11.020 DEMAEP 0109-5641 Google Scholar
H. Kanget al.,
“Nondestructive assessment of early tooth demineralization using cross-polarization optical coherence tomography,”
IEEE J. Sel. Top. Quantum Electron., 16
(4), 870
–876
(2010). http://dx.doi.org/10.1109/JSTQE.2009.2033610 IJSQEN 1077-260X Google Scholar
M. G. Sowaet al.,
“A comparison of methods using optical coherence tomography to detect demineralized regions in teeth,”
J. Biophotonics, 4
(11–12), 814
–823
(2011). http://dx.doi.org/10.1002/jbio.v4.11/12 JBOIBX 1864-063X Google Scholar
R. Joneset al.,
“Near-infrared transillumination at 1310-nm for the imaging of early dental decay,”
Opt. Express, 11
(18), 2259
–2265
(2003). http://dx.doi.org/10.1364/OE.11.002259 OPEXFF 1094-4087 Google Scholar
D. Friedet al.,
“Early caries imaging and monitoring with near-infrared light,”
Dent. Clin. North Am., 49
(4), 771
–793
(2005). http://dx.doi.org/10.1016/j.cden.2005.05.008 DCNAAC 0011-8532 Google Scholar
I. Haririet al.,
“Effects of structural orientation of enamel and dentine on light attenuation and local refractive index: an optical coherence tomography study,”
J. Dent., 40
(5), 387
–396
(2012). http://dx.doi.org/10.1016/j.jdent.2012.01.017 JDENAB 0300-5712 Google Scholar
D. Friedet al.,
“Nature of light scattering in dental enamel and dentin at visible and near-infrared wavelengths,”
Appl. Opt., 34
(7), 1278
–1285
(1995). http://dx.doi.org/10.1364/AO.34.001278 APOPAI 0003-6935 Google Scholar
J. D. Featherstoneet al.,
“Comparison of artificial caries-like lesions by quantitative microradiography and microhardness profiles,”
Caries Res., 17
(5), 385
–391
(1983). http://dx.doi.org/10.1159/000260692 CAREBK 0008-6568 Google Scholar
H. Meyer-LueckelS. ParisA. M. Kielbassa,
“Surface layer erosion of natural caries lesions with phosphoric and hydrochloric acid gels in preparation for resin infiltration,”
Caries Res., 41
(3), 223
–230
(2007). http://dx.doi.org/10.1159/000099323 CAREBK 0008-6568 Google Scholar
N. J. Cochraneet al.,
“New approaches to enhanced remineralization of tooth enamel,”
J. Dent. Res., 89
(11), 1187
–1197
(2010). http://dx.doi.org/10.1177/0022034510376046 JDREAF 0022-0345 Google Scholar
H. Fujikawaet al.,
“Influence of salivary macromolecules and fluoride on enamel lesion remineralization in vitro,”
Caries Res., 42
(1), 37
–45
(2008). http://dx.doi.org/10.1159/000111748 CAREBK 0008-6568 Google Scholar
A. Bennick,
“Salivary proline-rich proteins,”
Mol. Cell. Biochem., 45
(2), 83
–99
(1982). http://dx.doi.org/10.1007/BF00223503 MCBIB8 0300-8177 Google Scholar
A. GroeneveldJ. Arends,
“Influence of pH and demineralization time on mineral content, thickness of surface layer and depth of artifical caries lesions,”
Caries Res., 9
(1), 36
–44
(1975). http://dx.doi.org/10.1159/000260140 CAREBK 0008-6568 Google Scholar
|


