
|
|
1.IntroductionThe focus of this work was to develop and test an optimized system for image-guided fluorescence tomography of subsurface skin lesions, with the goal of providing region-based quantification of protoporphyrin IX (PpIX) fluorescence in vivo. Photodynamic therapy (PDT) based upon PpIX as the photosensitizer is an established, noninvasive dermatologic treatment for actinic keratosis in the US, and is commonly used ‘off label’ for cosmetic treatments, and treatment of squamous cell carcinoma (SCC) and superficial basal cell carcinoma (BCC).1–5 PpIX-based PDT involves the administration of a precursor molecule, either aminolevulinic acid (ALA) in the form of Levulan, or methyl aminolevulinate (MAL) in the form of Metvix. The induced PpIX accumulates preferentially in epithelial pathologies including SCC and BCC, with tumor-to-background contrast from 2:1 to 9:1 depending on the pathology and the preparation of ALA used.4–6 The photophysically active form of PpIX is fluorescent, and so the effective fluorescent yield is an indirect measurement of the active concentration available for a fixed light delivery.7 While PDT often yields successful treatment outcomes in superficial ( thick) BCCs and SCCs, treatment of subsurface pathologies at deeper locations has been less successful.8,9 This limit to effectiveness is potentially due to a reduced amount of ALA, and thus PpIX, at greater depths.10 Additional methods have been developed to increase PpIX induction including differentiation therapy to increase PpIX synthesis and contrast11 and the use of lipophilic ester variations of ALA12 or vertical micro-channel ablation13,14 to increase ALA penetration. In order to understand how the influence of these methods on PpIX concentrations within targeted tissue correlates with treatment outcomes, a method must be developed to measure in vivo PpIX fluorescence distributions during PDT treatment.15 PpIX is a natural fluorophore, so molecular imaging could provide the spatial distribution information necessary for noninvasive tumor detection and delimitation,16,17 as well as evaluation and real-time outcome prediction for PDT. Toward this goal, diffuse fluorescence tomography (FT) of tissue can be used for subsurface fluorescence imaging, and can provide improved quantitative accuracy as compared to broad-beam surface imaging methods.18–20 Subsurface FT typically employs an array of fiber optic source-detector pairs to measure diffusely remitted light, and the data are used to construct depth images from the different light paths sampled. Ideally, each source-detector pair samples a slightly different light path through the tissue and numerical method solutions for the multiple-scattering paths are used to isolate the local contribution of fluorophore concentration to each measurement.20,21 However, mathematical reconstruction of a true, high-resolution fluorescence image from FT measurements is an ill-posed problem because the limited number of measured signals does not provide a unique solution to the fluorescence distribution map for the large number of locations within the domain. Earlier work has shown this inverse problem to be inaccurate without additional information.19,20 The addition of prior structural segmentation information using MRI,22,23 X-ray computed tomography (XRCT),24–27 or ultrasound imaging (US)28–30 can lead to improved reconstruction of fluorescence using tomography. Segmentation of tissue geometries into a few regions of interest converts the ill-posed problem into an over-defined problem for which a reliable, unique solution can be found, at the cost of reducing fluorescence imaging resolution to a few regions of interest.31,32 Of the available imaging modes to measure structural prior information, US provides fast, low-cost, nonionizing, high-resolution, spatial information imaging, and high frequency US-guided FT has been demonstrated to improve fluorescence recovery in transmission geometry (source and detector fibers facing on opposite sides of tissue) FT.30 However, US-guided FT still stands to be improved by three important developments that we combine in this reported work:
We present here a high-frequency ultrasound-guided fluorescence tomography (USFT) method and system, with significant improvements over the previously presented system29 that address the three USFT development objectives outlined above (reflectance imaging, spectral decoupling, and white light-spectroscopy measurement of optical properties). The USFT method introduced, based on reflectance geometry measurements, incorporates fluorescence spectral fitting to isolate the signal of interest from other fluorescent signals, including system and tissue autofluorescence, and incorporates white light spectral fitting to measure local tissue optical properties for more accurate light path simulation and reconstruction of regional fluorescence. We validate the USFT system and approach for regional quantification of PpIX fluorescence yield in optically homogeneous and heterogeneous tissue phantoms and present preliminary in vivo imaging using a tumor-simulating mouse model. 2.Materials and Methods2.1.Experimental System Design and ConstructionA diagram of the US FT imaging system used herein is shown in Fig. 1. The instrument was originally introduced by Gruber et al.29 but has undergone significant hardware and software improvements noted here. It is composed of a Sonix Tablet (Ultrasonix, Richmond, British Columbia, Canada) high-frequency ultrasound system with a 40 MHz transducer (L40 8/12, Ultrasonix) coupled to a multi-channel optical tomography instrument. These modalities are integrated at the tissue interface through a custom dual transducer ‘v-block’ positioning system which facilitates precise positioning for imaging the same plane with US and FT sequentially, a process illustrated in Fig. 1(a). Image acquisition begins by using the US system to locate the region of interest, such as a subsurface tumor. Once this imaging plane is located, the positioning arm holding the ‘v-block’ is locked and an US image is captured. Then, the US transducer is slid away and replaced with the FT optical fiber array transducer via the sliding v-block design and all optical projections are acquired. The transducer v-block is designed such that both transducers image the same plane, allowing direct use of segmented US images for FT processing. Fig. 1Ultrasound-guided fluorescence tomography system schematic. (a) Dual transducer co-registration ‘v-block’ slide mount, with an ultrasound probe on the left and fiber optic linear array on the right. Arrows indicate direction of motion for transition from US mode to FT mode, with both modalities imaging the same plane. Top inset: side view of optical fibers. (b) FT system schematic, showing the 633 nm light source used for excitation and fluorescence measurements as well as the white light source used for white light transmission spectroscopy. For fluorescence spectroscopy, moveable long pass filters remove the 633 nm excitation light to capture emitted fluorescence spectra for each source-detector pair. Bottom inset: cross-section of fiber probe, showing fiber spacing (2.5 mm).  The optical component of the system consists of 4 source and 5 detection fiber channels alternating in a single line with a center-to-center spacing of 2.5 mm [Fig. 1(b)]. The excitation source is a 633 nm laser system with current and temperature regulation (Model 7404, Intense Co., North Brunswick, New Jersey). The laser output passes through a filter wheel (FW102C, Thorlabs) containing a 2 OD neutral density filter, a 650-nm short pass filter, and a beam stop, and is multiplexed to the four source channels via a fiber switch (Piezosystem Jena, Hopedale, Massachusetts). The output of each channel is coupled to the target tissue by 600 μm fibers (LGOptics, Germany). The five detection fibers channel light from the target tissue through custom moveable filter blocks to five compact spectrometers (, Ocean Optics, Dunedin, Florida) with spectral range of 540 to 1210 nm. Sources are illuminated sequentially, while detection fiber spectra are captured in parallel. Dark spectra are captured for each imaging mode using the same exposure times and light paths with the excitation source blocked by a beam stop in the filter wheel. In addition to the fluorescence excitation source, a shuttered white light source (HL-2000-FHSA, Ocean Optics) has been incorporated into the optical system, through an additional transducer fiber, to obtain white light spectroscopy data for explicit recovery of tissue optical properties. This capability is unique in fluorescence tomography systems. The fiber switch, filter wheel, and spectrometers are connected via a USB hub (DUB-H7, D-link) to the Sonix Tablet Windows-based computer. The detection-side moveable filters, filter position feedback limit switches, and white light shutter are controlled or read via NI DAQs (NI USB 6009, National Instruments). Imaging, including source-detector-pair-dependent auto-exposure for each imaging mode is controlled via LabView virtual instrument software (LabView v8.4.2, National Instruments). Ultrasound image-segmentation, spectral processing, and fitting of fluorophore distribution were performed using Matlab (R2011b, Mathworks, Natick, Massachusetts) and NIRFAST.35 To acquire data for optical reconstruction, three sets of measurements were recorded [Fig. 2(a) to 2(c)]. Once the fibers were positioned, excitation intensity was measured for all 20 projections (four sources and five detectors) [Fig. 2(a)]. During this acquisition, the source intensity was attenuated at the filter wheel using a neutral density filter of (NE20B, Thorlabs, Newton, New Jersey) to prevent detector saturation. To acquire full projection fluorescence data, the neutral density filter at the filter wheel was replaced with a 650-nm short pass filter (FES0650, Thorlabs), and 655-nm long pass interference filters (655ELPF, Omega Optics) were automatically lowered into each detection channel via movable filter mounts (MFF001, Thorlabs) attached to custom filter blocks [Fig. 2(b)]. Finally, a beam stop in the filter wheel blocked the excitation laser, and white light spectra from a single source were measured at each detector position to provide five projections for tissue spectroscopy [Fig. 2(c)]. Fig. 2Sample FT and US images. (a) Excitation light at 633 nm that diffusely propagates between each source-detector pair. (b) Emitted fluorescence spectra. Note the bump around 700 nm representing PpIX emission. (c) Diffuse white light reflectance spectra. (d) US image of simulated tumor in a nude mouse (Matrigel injection). (e) Manually segmented US image. (f) The region mask generated from the segmented US image, with source, detection, and white light fiber positions shown. The boundaries of the mask have been extended laterally. 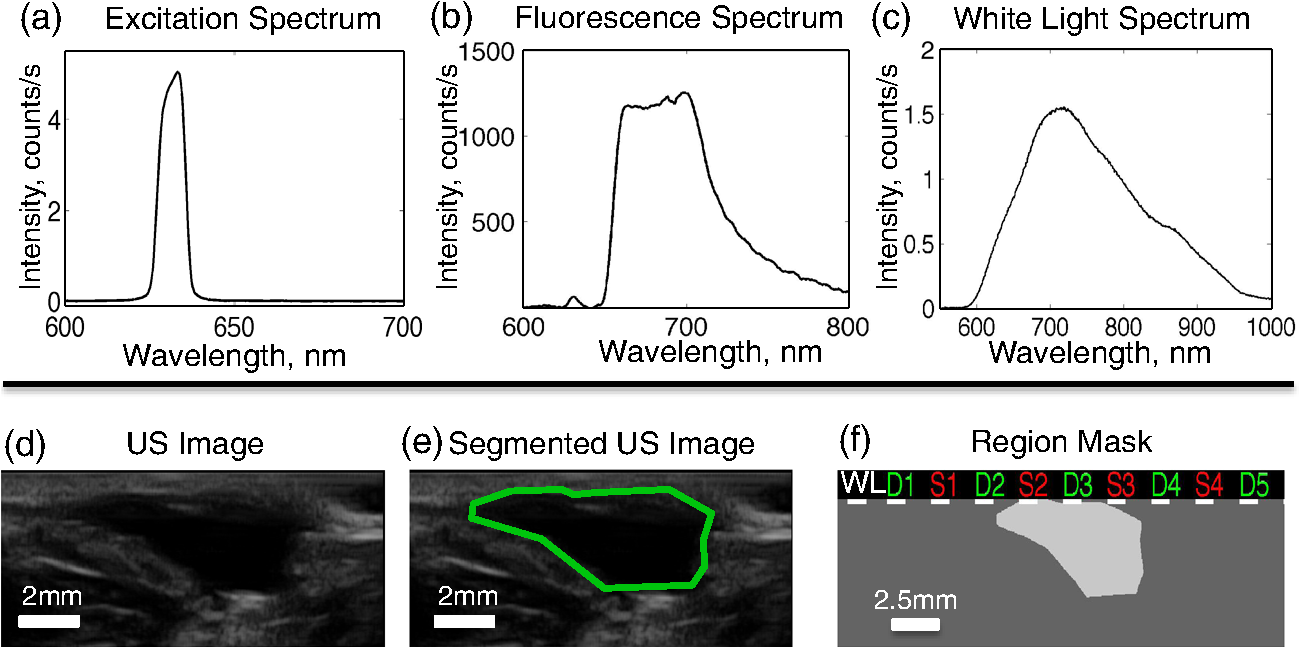 2.2.Data Processing2.2.1.US image segmentation and mesh generationUltrasound images were manually segmented into 2 regions: tumor (fluorescent inclusion), and background bulk tissue [Fig. 2(d) to 2(f)] using Matlab. Because the US transducer field of view is narrower than the FT array, the mask background was extended laterally. This mask was supplied to a meshing routine described elsewhere36,37 and recently built into the NIRFAST package along with source and detector fiber locations, node density, and mask pixel dimensions as inputs, to produce a finite element mesh. 2.2.2.White light spectral analysisBroadband white light spectra in the wavelength range 550 to 900 nm were analyzed using a fitting algorithm that used diffusion theory38 to relate wavelength-dependent estimates of the reduced scattering coefficient and absorption coefficient to the calibrated reflectance intensity measured at multiple source-detector separation distances. Measured spectra were calibrated using measured intensity () and model estimates of reflectance intensity () from a phantom of known optical properties, in this study a phantom with 1% Intralipid. This calibration was given as: This calibration factor transformed the collected intensity () from counts/sec to reflectance () units of , resolving the experimental data into the same units as exported by the standard diffusion theory model. This calibrated spectrum was described by a model as: Here, the model estimate of reflectance intensity () includes a wavelength-dependent background scattering model, expressed as , which allows estimation of a combined Mie- and Rayleigh-type scattering. The model also specified absorption, , as the summation of the contribution of individual chromophores, as . The chromophores within phantoms in this study included oxygenated and deoxygenated hemoglobin and water, and analysis of in vivo data also included collagen. The influence of variation in the index of refraction () between calibration phantom and sample was estimated by incorporating an amplitude factor, as in Refs. 39 and 40. The fitting algorithm in this investigation estimated scattering amplitude and slope and chromophore concentrations in order to minimize the difference between the measured and model estimated reflectance spectra at each source-detector distance measured [Fig. 33(c)]. White light spectra-based bulk estimates of and ’ at excitation (633 nm) and emission (700 nm) wavelengths were used as inputs to FT reconstructions to account for variations in bulk tissue optical properties. 2.2.3.Data processing and fluorescence reconstructionAfter subtraction of dark signal, spectra were normalized with respect to exposure times. A three-point median filter was used to eliminate spikes from each spectrum followed by a 14-point (5 nm) moving average smoothing filter. A single excitation value was obtained from the 633 nm peak for each projection [Fig. 3(d)]. For fluorescence spectra, a linear-least-squares fitting algorithm32 was used to determine the contributions from normalized basis spectra for PpIX fluorescence, photoproduct photoprotoporohyrin (pPp),41 and system and tissue auto-fluorescence [Fig. 3(a)]. The pPp fluorescence basis spectra was approximated using a Gaussian curve centered at 675 nm with 27 nm full-width-half-maximum, as reported previously by Kruijt et al.42 The combined system and target auto-fluorescence spectra were obtained for each detection channel using the same phantom ingredients without PpIX [Fig. 3(a)]. This analysis yielded a fitted coefficient representing the fluorescence attributable to PpIX within the measured spectrum at each source-detector pair [Fig. 3(b) and 3(e)] and a corresponding transmitted excitation signal value [Fig. 3(d)]. Fig. 3Data processing. (a) An example of spectral fitting using PpIX, autofluorescence, and photoproduct (pPp) bases. (b) Sensitivity maps for two measurements, between source 1-detector 1 (off the inclusion) and source 3-detector 3 (on the inclusion), weighted by the recovered fluorophore value. A shadow of the inclusion location is shown overlaid. Shown below the sensitivity maps are the fluorescence intensities at all nearest-neighbor source-detector pairs, with the two pairs corresponding to the sensitivity maps highlighted. The inclusion to background contrast ratio here is 8:1. (c) Spectral fitting of transmitted white light. Each line shows the contribution of a fitted parameter to the final spectra. Starting with a scattering spectra at top (- - -), water absorption (blue), collagen absorption (pink, - - -), and blood absorption (red) are added to bring the simulated spectra down to the measured spectra (o). (d) The raw transmission intensity is plotted for all detection channels when each of the four source channels is illuminated. (e) The raw fluorescence intensity is plotted for each detection channel when each of the four sources is illuminated (f) Excitation-normalized fluorescence is plotted for each detection channel when each of the four sources are on (black). In addition, the reconstructed fluorescence signal is shown in blue.  The diffusion-based forward model as described by Davis et al.32,43 was used to simulate the reference surface excitation () and expected fluorescence signals (), where subscripts and denote quantities at the excitation and emission wavelength, respectively, using target optical properties recovered with white light spectroscopy. The measured, excitation-normalized data [; Fig. 3(f)] was scaled by the simulated reference data () to provide a calibrated fluorescence measurement for each source-detector pair for reconstruction with the NIRFAST architecture. The fluorescence yield was calculated using an iterative error minimization algorithm with the objective function where is the simulated fluorescence signal [Fig. 3(f)]. The corresponding iterative update equation applied was where , the effective fluorescence yield, is the product of the fluorophore quantum efficiency and absorption coefficient , is the update parameter, is the fixed regularization parameter, is the error between and at each iteration, and is the Jacobian (sensitivity) matrix.Spatial segmentation information from the co-registered ultrasound image was incorporated into the reconstruction algorithm, thus drastically reducing the dimensionality of the problem from fitting fluorescence yield at thousands of mesh nodes to fitting fluorescence yield at just a few homogeneous regions. An extensive review of the benefits of spatial prior in FT is provided in Ref. 31. The 2-region mesh obtained from the segmented US image was used to generate a region-mapping matrix that maps the Jacobian to a lower dimension:44 And the new update equation: Since FT reconstructions are generally capable only of recovering the effective fluorescence yield, , which is dependent on the quantum yield, molar extinction coefficient, and concentration of the fluorophore, actual fluorophore concentration cannot be calculated without estimates of the other properties. The quantum yield for PpIX in DMSO was determined to be using the comparative method of Williams et al.,45 with Kiton Red in DMSO as a standard, but it is well known that this value varies depending on solvent and local environment. The PpIX molar extinction coefficient at 633 nm is ,46 as found on the Oregon Medical Laser Center website ( http://omlc.ogi.edu/). Using this molar extinction coefficient and the known PpIX concentrations, effective quantum yield was calculated for each experimental series. 2.3.Experimental Validation Studies2.3.1.PhantomsIn order to examine the sensitivity of the USFT system to changing PpIX concentration in a homogeneous medium, the system was tested using homogeneous liquid phantoms containing Intralipid (20%, Fresenius-Kabi, Bad Homburg, Germany), 5% Tween20 (P1379, Sigma-Aldrich), porcine whole blood (7204901, Lampire Biological inc.), and [0,0.025,0.05,0.1,0.2,0.4,0.8] PpIX. Blood and Intralipid concentrations were varied to generate a sampling cross using: values for (blood%, Intralipid%) were (1%, 0.5%) (1%, 1%) (1%, 1.5%) (0.5%, 1%) (1.5%, 1%). Each phantom was stirred continuously until imaging.29,47 Three images were obtained for each combination of blood, Intralipid, and PpIX concentration, resulting in 15 measurements at each PpIX concentration, with three measurements for each of the five blood/Intralipid values. Reconstruction was performed in two stages. First, all phantoms were assumed to have equal optical properties based on values found in Ref. 34. Second, reconstructions were performed with phantom-specific optical properties, as measured by white light spectroscopy. Simulations were used to expand the range of optical properties, beyond those found in phantoms with blood (fully oxygenated), Intralipid. These simulations considered homogeneous phantoms with base optical properties of or and , with each optical property pair varied by factors of [0.5, 0.75, 1, 1.25, 1.5], and across 7 PpIX concentrations, for a total of 350 simulations. The simulated data, noise, was reconstructed using either the fixed base optical properties or the “measured” (known) optical properties with 5% noise. Normalized standard deviation (), reconstruction objective function error, , and reconstruction linearity with concentration were calculated in each case for all optical property sets and compared to determine the effect of known optical properties on reconstructed values. To examine the ability of the USFT system to resolve changing PpIX concentration in a small region of interest surrounded by a background with low-level fluorescence, phantoms consisting of two regions, a background and a fluorescent inclusion, were constructed using 10% w/v gelatin (G2500, Sigma-Aldrich), 0.085% w/v (14021, Sigma-Aldrich) for optical and ultrasound scattering, 1% porcine whole blood (7204901, Lampire Biological Inc.) for absorption, varying concentrations of PpIX (P8293, Sigma-Aldrich), and 5% Tween20 (P1379, Sigma-Aldrich) to prevent PpIX aggregation. Gelatin was dissolved in hot water, stirred vigorously until cooled to 30°C, then mixed with the remaining ingredients and poured into molds. Inclusions were cast using negative molds, and backgrounds were cast with positive molds positioned to leave inclusion-sized holes. The bulk background contained a constant concentration of (177 nM) of PpIX, while the inclusions contained [0.1,0.2,0.4,0.6,0.8,1.0] PpIX. A 2-mm-thick skin-simulating layer having the same composition as the bulk background was prepared as well, and phantoms were imaged with and without the skin-simulating layer. 2.3.2.Animal modelsFor a preliminary study of application of the USFT system to measured PpIX in a region of interest in vivo, approximately 150 μl of Matrigel (#356231 BD Biosciences), with either 0 or of PpIX, was injected intra-dermally into the hind flank and abdomen of 6-week-old nude mice. The injections were made while drawing the syringe out, to form broad flat shapes, in an attempt to mimic BCC structure. Once solidified, injections were imaged using the USFT system with the inclusion centered in the image frame. Unpaired pre-injection images were captured and averaged for autofluorescence basis spectra. US images were segmented manually based on the hypoechoic nature of Matrigel injections and processed as detailed above. This approach to in vivo imaging was highly controllable for this validation phase of the instrument. 3.ResultsA representative fluorescence spectral fit, for data measured on an inclusion phantom, is presented in Fig. 3(a). The combined target/system autofluorescence signals all follow trends similar to the autofluroescence spectra in Fig. 3(a). The excitation-light-normalized PpIX spectral fitting coefficients, termed the Born-normalized fluorescence, are shown in the bar plot in Fig. 3(b) for all nearest neighbor source-detector pairs. Fluorescence intensity from a projection that sampled the bulk of the fluorescence inclusion and a second projection that sampled just the background, as illustrated by the plotted sensitivity matrices, are highlighted. A representative white light spectral fit is shown in Fig. 3(c), with each line representing the added spectral effects of a fitted parameter. Figure 3(d) and 3(e) shows all 20 measured PpIX coefficients and all 20 measured transmitted excitation values, respectively, with the source location plotted for each five measurements (serial source illumination with parallel detection). Figure 3(f) shows the normalized (Fluorescence/Excitation) PpIX coefficients and the results reconstructed signals using the optical properties determined in Fig. 3(c). Note the reconstruction accurately matches the measured signal. For homogeneous liquid phantoms, the bulk optical properties were calculated using white light spectroscopy and used in the reconstruction of fluorescence yield over a range of PpIX concentrations. The results were compared to effective fluorescence yield obtained using a fixed set of literature-based optical properties (, , , and ) for all phantoms (Fig. 4). In Fig. 4(a) the reconstruction fitting errors (objective function) are plotted against known PpIX concentration in liquid phantoms, for reconstructions using optical properties calculated for individual phantoms using white light spectroscopy. The reconstructed fluorescence yield using measured optical properties is plotted against known PpIX concentration in Fig. 4(b). The use of the correct optical properties for the reconstruction model lead to significant reduction in reconstruction fitting errors, by a factor of [, Fig. 4(a)], and lower normalized variation (standard deviation/mean) in reconstructed fluorescence yield by a factor of (data not shown). The reconstructed fluorescence values were linear with PpIX concentration, with for fixed literature based optical properties (data not shown) and for white light-measured optical properties [Fig. 4(b)]. Based on reconstructed fluorescence yield, PpIX molar extinction coefficient, and known concentration, the calculated quantum efficiency, , was roughly 0.0025 for homogeneous liquid blood and Intralipid phantoms. Fig. 4.Recovery of PpIX fluorescence yield in homogenous liquid phantoms. (a) Comparison of reconstruction fitting errors (objective function: ) between literature-based, fixed optical properties (×), and measurement-specific optical properties determined with white light spectroscopy (+). The errors are significantly lower using white light properties at all PpIX concentrations (*, ). (b) Reconstruction performed using measurement-specific optical properties determined with white light spectroscopy. Results are linear, .  It is worth noting that measurement of optical properties using white light spectroscopy revealed that the optical absorption values of 1% blood, 1% Intralipid phantoms, when mixed in an open (oxygenated) environment, were surprisingly low (near the lower limit of the expected range of absorption for tissues) at the wavelengths of interest (633 and 700 nm) due to the much lower absorption of oxygenated hemoglobin in these regions.48 Thus, the homogeneous phantom series did not cover the full range of interest of optical absorption values. To investigate the importance of accurate optical properties for fluorescence reconstruction over the full range of expected tissue optical properties, signals were simulated over a range of optical properties centered at absorptions one and two orders of magnitude higher than the phantom absorption and analyzed. The normalized standard deviations and reconstruction fitting errors were significantly improved as for the imaged homogeneous phantom series. Even with 5% noise added to both the simulated fluorescence signal and the “measured” (known) optical properties, reconstruction with informed optical properties provides significant improvements over standard reconstructions in simulated homogeneous phantoms, similar to the improvements seen in the real homogeneous phantoms (Fig. 4). Figure 5 shows a representative inclusion reconstruction and the benefits of prior spatial information and accurate optical property information. Figure 5(b) shows hot spots in the un-informed (no US guidance, ill-posed) reconstruction and the obviously poor fluorophore mapping when using only FT. Figure 5(c) compares reconstruction fits using literature-based or white light spectroscopy measured optical properties for a single inclusion. Optical properties used from the literature were based on known absorption and scattering of blood, Intralipid, and gelatin. Note the reconstruction fitting algorithm cannot adequately scale the intensity range, based largely on absorption, to reproduce measured data by changing only the fluorophore concentration. In Fig. 5(d) note that in two-region reconstruction, there are only two fluorophore values calculated when using prior spatial information: homogeneous values in the inclusion region and the background region. Fig. 5Inclusion fluorescence reconstruction improvements with addition of spatial information and white light-determined optical properties. (a) US image outline of a phantom inclusion that contains 4:1 PpIX:background contrast is shown. The phantom includes a 2-mm top layer above the inclusion. (b) Reconstruction without spatial priors. The spatial map is overlaid on the ultrasound image. Color axis corresponds to . Note “hot spots” three orders of magnitude higher than values in (d). (c) Reconstructed source-detector measurement fits with and without use of white light-measured optical properties. Note that without correct absorption coefficients, the correct range of signal intensities for varying source-detector separations cannot be reproduced by varying only fluorophore concentration, which is why the fixed optical property reconstruction fails to reproduce the measured data. (d) Regional fluorescence reconstruction with use of spatial priors and measurement-specific optical properties.  Figure 6(a) shows reconstructed fluorescence yield versus known fluorophore concentration for inclusion phantoms with and without a 2-mm skin-simulating top layer (same fluorophore concentration as background, ), as well as the reconstructed background values (same for all inclusions, ) for each inclusion fluorophore concentration. These reconstructions were performed using spatial priors from segmented US images [Figure 5(a)] and the actual optical properties were determined with white light spectroscopy. Reconstructed values are linear with concentration for inclusions with and without skin, with for both series, down to the background concentration and lowest concentration used, . Figure 6(b) shows the calculated versus known contrast to background ratio (CBR), for inclusions with and without skin-simulating top layers. The linear fit equations are () and () for inclusions without and with the skin-simulating top layers, respectively. The mean error in recovered CBR is 23% without a top layer and 74% with a top layer. The CBR slope is near unity for the plain inclusion phantom, but is considerably higher when a skin-simulating layer is added. When all FT fiber pairs sample a uniform layer and spatial information is not available, the solution is nonunique because fluorophore concentration and depth are no longer independent parameters. The addition of US-guidance provides more accurate reconstruction through layers, as Fig. 6 shows, but does not completely solve this reconstruction issue. Based on reconstructed fluorescence yield, PpIX molar extinction coefficient, and known concentration, the quantum efficiency, , was roughly 0.0024 for gelatin-based blood and Intralipid phantoms without a skin-simulating top layer. Fig. 6Reconstruction of inclusion phantom fluorescence yield. Blue data is from phantoms with a 2-mm skin-simulating top layer, red data is from phantoms without a skin layer. (a) Recovered PpIX yield in the inclusion (open markers) and background (solid markers). Both reconstructions are linear, with . Sensitivity, based on intercept, is PpIX. (b) Inclusion contrast-to-background ratio in both types of phantoms. The linear fit equations are , , and , , for phantoms with and without the skin-simulating top layer, respectively.  Finally, Fig. 7 shows a combined USFT reconstruction image for a 150 μL subcutaneous hind-flank injection of PpIX-matrigel solution in a nude mouse. The reconstructed fluorescence yield, combined with the molar extinction coefficient, indicated that the quantum efficiency, , was roughly 0.001, indicating the quantum yield calibration value may be significantly different in vivo compared to Intralipid- and gelatin-based phantoms. Contrast to background is not an informative metric for this case, as it is influenced by the near 0 background. 4.DiscussionThis paper presents the validation of a combined high frequency US-guided reflectance-mode-FT system, with spectral fitting to decouple multiple signals and novel use of white light spectroscopy to inform optical models for accurate reconstruction of regional, subsurface fluorescence yield in vivo. The data show that the US-guided spatial priors are critical for accurate regional fluorescence reconstruction. The data also underscore the benefit of white light spectroscopy and the necessity for knowledge of optical properties for accurate fluorescence tomographic reconstruction. The perturbative influence that variations in background optical properties have on the reconstructions of raw fluorescence spectra is shown in Fig. 4(a). While it is possible to estimate a linear metric of fluorescence from reconstructions with assumed background optical property values, the overall reconstruction accuracy of fluorescence estimates are improved significantly when sample-specific optical properties are measured by white light spectroscopy and used to inform reconstruction models. This improvement in accuracy results in reduction in the normalized standard deviation of reconstructed fluorescence yield by a factor of across varying phantom optical properties and reduction in reconstruction fitting errors by a factor of . In many imaging applications, the region of interest may be pathologically altered and thus tissue optical properties may differ from values expected in normal tissue. The data in this study suggests that incorporation of white light spectroscopy to determine these bulk properties will significantly reduce fluorescence reconstruction errors in vivo. FT approaches that focus on diffuse recovery exclusively are often limited by an ill-posed problem of estimating both magnitude and spatial location of fluorescence origin within the sampled medium. The benefit of using US images to provide prior spatial information to overcome this limitation is made obvious in Fig. 5(b). The non-region-segmented problem is highly under-determined and the reconstruction algorithm cannot yield accurate spatial maps of subsurface fluorescence.19,20 Standard reconstruction typically yields sparsely distributed hot spots surrounded by relatively low values [Fig. 5(b)]. While such a result does very accurately fit the input measured data, the solution is not unique and does not provide an informative description of subsurface fluorescence distribution. When the reconstruction is constrained to a few homogeneous regions, the problem is no longer ill-posed and yields a more-accurate regional fluorescence yield, with the trade-off that spatial resolution is reduced to a few homogeneous regions. The optical phantoms utilized in this study were constructed to mimic the clinically relevant problem of assessing PpIX fluorescence within a subsurface structure, such as a BCC or SCC. This situation has multiple complicating factors, including variable target size and depth, variable thickness of overlaying (nontargeted) tissue, and variations in the contrast ratio between the target and background. The data in this study show that for a fluorescent inclusion with CBR ranging from to 10, the US-guided FT method produces reasonable results, with measured fluorescence yield, , roughly equal in the background and inclusion at 1:1 known CBR and then linearly increasing with inclusion concentration [Fig. 6(a) and 6(b)]. The addition of a skin-simulating top layer leads to an apparent overestimation of the , though this is likely due, at least in part, to the compression of the top layer during imaging. Optical signal intensities decrease with increasing depth, so if the 2-mm top layer is actually compressed to 1.5 mm, then the measured sublayer fluorescence signals would be higher than expected for a 2-mm layer, and the resulting reconstructions would yield an increased fluorescence yield within the inclusion and higher inclusion:background contrast. This study presents data obtained in controlled situations using tissue phantoms and a well-behaved preclinical model. The phantoms used in this study are simple geometric models that we are able to easily segment into two or three clearly defined, uniform regions. In vivo measurements, however, will be complicated by heterogeneity in both structural (see Fig. 7) and optical maps, which will tend to decrease local fluorophore reconstruction accuracy. However, for the designed use, PDT assessment, regional fluorescence contrast is a useful metric for deciding when to treat and for evaluating treatment efficacy. In future work, the high-resolution ultrasound images will be used to segment the imaged medium into multiple regions if necessary. Additionally, while the current white light spectroscopy routine provides estimates of bulk tissue optical properties, and does not account for heterogeneities, the workflow will be adjusted in future versions of the system to obtain estimates of optical properties specific to each source-detector measurement. PpIX concentration is difficult to calculate because the quantum yield varies for different solvents and conditions, and cannot be accurately measured in scattering media such as tissue phantoms. So the measured fluorescence yield only provides a rough estimate of concentration. It is not possible to know the effective quantum yield in vivo, and so the results here most importantly demonstrate that USFT fluorescence yield reconstruction is linear with known concentration, and that the reconstructed contrast is relatively accurate. For the desired applications in PDT assessment and guidance, the fluorescence yield is actually a more important metric than the fluorophore concentration or quantum yield, because the treatment dose is directly related to the fluorescence yield. Finally, an additional limitation is that reconstruction was performed using diffusion-theory-based finite element models to account for the influence of background tissue optical properties on the collected fluorescence intensity. A more accurate method would likely be to utilize the optical properties gained from white light spectroscopy to estimate the intrinsic fluorescence, and then reconstruct the fluorescence yield based on the intrinsic fluorescence instead of the collected fluorescence using either NIRFAST or a Monte Carlo-based reconstruction algorithm. Additional in vivo tests using injected fluorophore to determine absolute fluorescence yield, concentration, contrast, region size, and region depth sensitivities will complete validation of the USFT method and system for spatial quantification of PpIX in vivo. USFT imaging will then be employed to measure the spatial production of PpIX for diagnostic purposes and for evaluation of treatment efficacy during PDT for deep skin tumors. The USFT methods presented here can also be readily applied to measure regional fluorescence of other fluorophores to quantify drug delivery, targeted binding, or molecular function. 5.ConclusionThis study provides a new hybrid imaging/optics approach to region-based molecular imaging of subsurface targets in vivo. The presented data demonstrates that ultrasound-guided fluorescence tomography (USFT) can be employed to determine region-based PpIX fluorescence at greater depths than standard surface-imaging techniques, and could provide PpIX imaging for tumor detection and delimitation as well as for PDT guidance and dosimetry. The method presented here combines tissue spatial information (US) with an array of diffuse optical samples to reconstruct fluorescence yield in tumor and background regions. Fluorescence spectral fitting is used to isolate the fluorophore of interest from autofluorescence and white light spectral fitting is used to accurately inform the optical models for reconstruction. We present preliminary in vivo results supporting the claim that USFT dual imaging offers rapid, noninvasive, ionizing-radiation-free measurement of relative region-based fluoresence of a drug of interest using a portable, low-cost imaging system. ReferencesM. D. PalmM. P. Goldman,
“Safety and efficacy comparison of blue versus red light sources for photodynamic therapy using methyl aminolevulinate in photodamaged skin,”
J. Drugs Dermatol., 10
(1), 53
–60
(2011). Google Scholar
S. ChoudharyK. NouriM. L. Elsaie,
“Photodynamic therapy in dermatology: a review,”
Lasers Med. Sci., 24
(6), 971
–80
(2009). http://dx.doi.org/10.1007/s10103-009-0716-x LMSCEZ 1435-604X Google Scholar
K. Langet al.,
“Aminolevulinic acid (Levulan) in photodynamic therapy of actinic keratoses,”
Skin Therapy Lett., 6
(10), 1
–2
(2001). Google Scholar
J. C. KennedyR. H. PottierD. C. Pross,
“Photodynamic therapy with endogenous protoporphyrin IX: basic principles and present clinical experience,”
J. Photochem. Photobiol. B, 6
(1–2), 143
–148
(1990). http://dx.doi.org/10.1016/1011-1344(90)85083-9 JPPBEG 1011-1344 Google Scholar
J. P. Celliet al.,
“Imaging and photodynamic therapy: mechanisms, monitoring, and optimization,”
Chem. Rev., 110
(5), 2795
–2838
(2010). http://dx.doi.org/10.1021/cr900300p CHREAY 0009-2665 Google Scholar
C. Fritschet al.,
“Preferential relative porphyrin enrichment in solar keratoses upon topical application of delta-aminolevulinic acid methylester,”
Photochem. Photobiol., 68
(2), 218
–221
(1998). http://dx.doi.org/10.1562/0031-8655(1998)068<0218:PRPEIS>2.3.CO;2 PHCBAP 0031-8655 Google Scholar
G. A. WagnieresW. M. StarB. C. Wilson,
“In vivo fluorescence spectroscopy and imaging for oncological applications,”
Photochem. Photobiol., 68
(5), 603
–632
(1998). http://dx.doi.org/10.1111/j.1751-1097.1998.tb02521.x PHCBAP 0031-8655 Google Scholar
A. Martinet al.,
“Lack of selectivity of protoporphyrin IX fluorescence for basal cell carcinoma after topical application of 5-aminolevulinic acid: implications for photodynamic treatment,”
Arch. Dermatol. Res., 287
(7), 665
–674
(1995). http://dx.doi.org/10.1007/BF00371740 ADMFAU 0003-9187 Google Scholar
C. Sandberget al.,
“Bioavailability of aminolaevulinic acid and methylaminolaevulinate in basal cell carcinomas: a perfusion study using microdialysis in vivo,”
Br. J. Dermatol., 159
(5), 1170
–1176
(2008). http://dx.doi.org/10.1111/j.1365-2133.2008.08795.x BJDEAZ 1365-2133 Google Scholar
Z. Maliket al.,
“Topical application of 5-aminolevulinic acid, DMSO and EDTA: protoporphyrin IX accumulation in skin and tumours of mice,”
J. Photochem. Photobiol. B, 28
(3), 213
–218
(1995). http://dx.doi.org/10.1016/1011-1344(95)07117-K JPPBEG 1011-1344 Google Scholar
O. E. Akilovet al.,
“Prospects for the use of differentiation-modulating agents as adjuvant of photodynamic therapy for proliferative dermatoses,”
J. Dermatol., 35
(4), 197
–205
(2008). http://dx.doi.org/10.1111/j.1346-8138.2008.00445.x JDSCEI 0923-1811 Google Scholar
Q. Penget al.,
“Selective distribution of porphyrins in skin thick basal cell carcinoma after topical application of methyl 5-aminolevulinate,”
J. Photochem. Photobiol. B, 62
(3), 140
–145
(2001). http://dx.doi.org/10.1016/S1011-1344(01)00173-7 JPPBEG 1011-1344 Google Scholar
M. Haedersdalet al.,
“Fractional CO(2) laser-assisted drug delivery,”
Lasers Surg. Med., 42
(2), 113
–122
(2010). http://dx.doi.org/10.1002/lsm.v42:2 LSMEDI 0196-8092 Google Scholar
G. Nicolodelliet al.,
“Evidence of 5-aminolevulinic acid (ALA) penetration increase due to microdrilling in soft tissue using femtosecond laser ablation,”
Lasers Med. Sci., 27
(5), 1067
–1071
(2012). http://dx.doi.org/10.1007/s10103-012-1051-1 LMSCEZ 1435-604X Google Scholar
R. B. Saageret al.,
“Quantitative fluorescence imaging of protoporphyrin IX through determination of tissue optical properties in the spatial frequency domain,”
J. Biomed. Opt., 16
(12), 126013
(2011). http://dx.doi.org/10.1117/1.3665440 JBOPFO 1083-3668 Google Scholar
P. Redondoet al.,
“Methyl-ALA-induced fluorescence in photodynamic diagnosis of basal cell carcinoma prior to Mohs micrographic surgery,”
Arch. Dermatol., 144
(1), 115
–117
(2008). http://dx.doi.org/10.1001/archdermatol.2007.3 ARDEAC 0003-987X Google Scholar
C. Sandberget al.,
“Fluorescence diagnostics of basal cell carcinomas comparing methyl-aminolaevulinate and aminolaevulinic acid and correlation with visual clinical tumour size,”
Acta. Derm. Venereol., 91
(4), 398
–403
(2011). http://dx.doi.org/10.2340/00015555-1068 ADVEA4 0001-5555 Google Scholar
V. NtziachristosC. BremerR. Weissleder,
“Fluorescence imaging with near-infrared light: new technological advances that enable in vivo molecular imaging,”
Eur. Radiol., 13
(1), 195
–208
(2003). http://dx.doi.org/10.1007/s00330-002-1524-x 0938-7994 Google Scholar
D. Kepshireet al.,
“Fluorescence tomography characterization for sub-surface imaging with protoporphyrin IX,”
Opt. Express, 16
(12), 8581
–8593
(2008). http://dx.doi.org/10.1364/OE.16.008581 OPEXFF 1094-4087 Google Scholar
D. S. Kepshireet al.,
“Subsurface diffuse optical tomography can localize absorber and fluorescent objects but recovered image sensitivity is nonlinear with depth,”
Appl. Opt., 46
(10), 1669
–1678
(2007). http://dx.doi.org/10.1364/AO.46.001669 APOPAI 0003-6935 Google Scholar
B. Pogueet al.,
“Instrumentation and design of a frequency-domain diffuse optical tomography imager for breast cancer detection,”
Opt. Express, 1
(13), 391
–403
(1997). http://dx.doi.org/10.1364/OE.1.000391 OPEXFF 1094-4087 Google Scholar
V. Ntziachristoset al.,
“Concurrent MRI and diffuse optical tomography of breast after indocyanine green enhancement,”
Proc. Natl. Acad. Sci. U. S. A., 97
(6), 2767
–2772
(2000). http://dx.doi.org/10.1073/pnas.040570597 1091-6490 Google Scholar
B. Brooksbyet al.,
“Imaging breast adipose and fibroglandular tissue molecular signatures by using hybrid MRI-guided near-infrared spectral tomography,”
Proc. Natl. Acad. Sci. U. S. A., 103
(23), 8828
–8833
(2006). http://dx.doi.org/10.1073/pnas.0509636103 1091-6490 Google Scholar
Z. Xiaet al.,
“Registration of 3-D CT and 2-D flat images of mouse via affine transformation,”
IEEE Trans. Inform. Technol. Biomed., 12
(5), 569
–578
(2008). http://dx.doi.org/10.1109/TITB.2007.904631 ITIBFX 1089-7771 Google Scholar
G. Zacharakiset al.,
“Normalized transillumination of fluorescent proteins in small animals,”
Mol. Imaging, 5
(3), 153
–159
(2006). MIOMBP 1535-3508 Google Scholar
E. E. GravesR. WeisslederV. Ntziachristos,
“Fluorescence molecular imaging of small animal tumor models,”
Curr. Mol. Med., 4
(4), 419
–430
(2004). http://dx.doi.org/10.2174/1566524043360555 CMMUBP 1566-5240 Google Scholar
D. Kepshireet al.,
“A microcomputed tomography guided fluorescence tomography system for small animal molecular imaging,”
Rev. Sci. Instrum., 80
(4), 043701
(2009). http://dx.doi.org/10.1063/1.3109903 RSINAK 0034-6748 Google Scholar
Q. Zhuet al.,
“Imager that combines near-infrared diffusive light and ultrasound,”
Opt. Lett., 24
(15), 1050
–1052
(1999). http://dx.doi.org/10.1364/OL.24.001050 OPLEDP 0146-9592 Google Scholar
J. D. Gruberet al.,
“System development for high frequency ultrasound-guided fluorescence quantification of skin layers,”
J. Biomed. Opt., 15
(2), 026028
(2010). http://dx.doi.org/10.1117/1.3374040 JBOPFO 1083-3668 Google Scholar
B. Liet al.,
“Low-cost three-dimensional imaging system combining fluorescence and ultrasound,”
J. Biomed. Opt., 16
(12), 126010
(2011). http://dx.doi.org/10.1117/1.3662455 JBOPFO 1083-3668 Google Scholar
B. W. Pogueet al.,
“Implicit and explicit prior information in near-infrared spectral imaging: accuracy, quantification and diagnostic value,”
Philos. Transact. A Math. Phys. Eng. Sci., 369
(1955), 4531
–4557
(2011). http://dx.doi.org/10.1098/rsta.2011.0228 Google Scholar
S. C. Daviset al.,
“Image-guided diffuse optical fluorescence tomography implemented with Laplacian-type regularization,”
Opt. Express, 15
(7), 4066
–4082
(2007). http://dx.doi.org/10.1364/OE.15.004066 OPEXFF 1094-4087 Google Scholar
S. C. Daviset al.,
“Magnetic resonance-coupled fluorescence tomography scanner for molecular imaging of tissue,”
Rev. Sci. Instrum., 79
(6), 064302
(2008). http://dx.doi.org/10.1063/1.2919131 RSINAK 0034-6748 Google Scholar
J. L. SandellT. C. Zhu,
“A review of in-vivo optical properties of human tissues and its impact on PDT,”
J. Biophoton., 4
(11–12), 773
–787
(2011). http://dx.doi.org/10.1002/jbio.v4.11/12 JBOIBX 1864-063X Google Scholar
H. Dehghaniet al.,
“Near infrared optical tomography using NIRFAST: algorithm for numerical model and image reconstruction,”
Commun. Numer. Methods Eng., 25
(6), 711
–732
(2009). http://dx.doi.org/10.1002/cnm.v25:6 1069-8299 Google Scholar
H. GhadyaniJ. SullivanZ. Wu,
“Boundary recovery For delaunay tetrahedral meshes using local topological transformations,”
Finite Elem. Anal. Des., 46
(1–2), 74
–83
(2010). http://dx.doi.org/10.1016/j.finel.2009.06.022 FEADEU 0168-874X Google Scholar
J. R. Shewchuk,
“Delaunay refinement algorithms for triangular mesh generation,”
Computat. Geomet., 22
(1–3), 21
–74
(2002). http://dx.doi.org/10.1016/S0925-7721(01)00047-5 Google Scholar
T. J. FarrellM. S. PattersonB. Wilson,
“A diffusion theory model of spatially resolved, steady-state diffuse reflectance for the noninvasive determination of tissue optical properties in vivo,”
Med. Phys., 19
(4), 879
–88
(1992). http://dx.doi.org/10.1118/1.596777 MPHYA6 0094-2405 Google Scholar
R. M. Doornboset al.,
“The determination of in vivo human tissue optical properties and absolute chromophore concentrations using spatially resolved steady-state diffuse reflectance spectroscopy,”
Phys. Med. Biol., 44
(4), 967
–981
(1999). http://dx.doi.org/10.1088/0031-9155/44/4/012 PHMBA7 0031-9155 Google Scholar
M. G. NicholsE. L. HullT. H. Foster,
“Design and testing of a white-light, steady-state diffuse reflectance spectrometer for determination of optical properties of highly scattering systems,”
Appl. Opt., 36
(1), 93
–104
(1997). http://dx.doi.org/10.1364/AO.36.000093 APOPAI 0003-6935 Google Scholar
J. S. DysartM. S. Patterson,
“Photobleaching kinetics, photoproduct formation, and dose estimation during ALA induced PpIX PDT of MLL cells under well oxygenated and hypoxic conditions,”
Photochem. Photobiol. Sci., 5
(1), 73
–81
(2006). http://dx.doi.org/10.1039/b511807g PPSHCB 1474-905X Google Scholar
B. Kruijtet al.,
“Monitoring ALA-induced PpIX photodynamic therapy in the rat esophagus using fluorescence and reflectance spectroscopy,”
Photochem. Photobiol., 84
(6), 1515
–1527
(2008). http://dx.doi.org/10.1111/php.2008.84.issue-6 PHCBAP 0031-8655 Google Scholar
A. B. Milsteinet al.,
“Fluorescence optical diffusion tomography,”
Appl. Opt., 42
(16), 3081
–3094
(2003). http://dx.doi.org/10.1364/AO.42.003081 APOPAI 0003-6935 Google Scholar
S. C. Daviset al.,
“Comparing implementations of magnetic-resonance-guided fluorescence molecular tomography for diagnostic classification of brain tumors,”
J. Biomed. Opt., 15
(5), 051602
(2010). http://dx.doi.org/10.1117/1.3483902 JBOPFO 1083-3668 Google Scholar
A. T. R. WilliamsS. A. WindfieldJ. N. Miller,
“Relative fluorescence quantum yield using a computer-controlled luminescence spectrometer,”
Analyst, 108
(1290), 1067
–1071
(1983). http://dx.doi.org/10.1039/AN9830801067 ANLYAG 0365-4885 Google Scholar
J. E. Falk, Porphyrins and Metalloporphyrins, Elsevier, Amsterdam
(1964). Google Scholar
B. W. PogueM. S. Patterson,
“Review of tissue simulating phantoms for optical spectroscopy, imaging and dosimetry,”
J. Biomed. Opt., 11
(4), 041102
(2006). http://dx.doi.org/10.1117/1.2335429 JBOPFO 1083-3668 Google Scholar
W. G. ZijlstraA. BuursmaO. W. van Assendelft, Visible and Near Infrared Absorption Spectra of Human and Animal Haemoglobin, VSP Publising, Utrecht, Netherlands
(2000). Google Scholar
|


