
|
|
1.IntroductionSkin is the outer protector of the human body and is subjected to a range of environmental stimuli, such as light, mechanical, biochemical, and thermal stimuli. Exposure of the skin to excessive heat, such as from a flame, hot liquid, or hot solid, sometimes causes skin burns. Burns are usually categorized into three degrees depending on the invasion depth of thermal injury in the skin, which has a three-layer tissue structure. In a first-degree burn, or epidermal burn, in which the injury is limited to the epidermis, there is no need for intensive therapy because damaged epithelial cells can regenerate themselves. Although a second-degree burn damages both the epidermis and dermis, the skin can still be healed by reepithelialization with suitable medical treatment. Second-degree burns are further classified into superficial dermal burn (SDB) and deep dermal burn (DDB). On the other hand, a third-degree burn, or deep burn (DB), damages down to the subcutaneous layer and causes cellular death, requiring skin graft surgery. Furthermore, DB involving over 50% of the total body surface area may lead to death by infection. Since the appropriate therapeutic method for the burn depends on the degree of the burn, assessment of the burn depth is a key step in determining the treatment plan.1 In particular, it is important to differentiate between SDB, DDB, and DB to prevent the spread of infection in the affected site and to achieve favorable prognosis. Visual inspection by a medical doctor is often used in clinical examination. However, it is difficult for even an experienced doctor to differentiate between SDB and DDB because the doctor estimates the degree of the skin burn only from the appearance of the wound on the epidermis.2 The pin-prick test is another clinical assessment often used for severe burns. Since completely damaged nerve cells lose the sense of pain to a pin-prick stimulus, this test can distinguish DB from other burns; however, it is still difficult to know whether the burn is an SDB or a DDB. There is therefore a significant need for a reliable, minimally invasive, highly quantitative burn assessment method. Optical probe methods are desirable for burn assessment because they are simple, non-contact, and painless to the patient. Furthermore, optical probes can be directly applied because skin is superficial tissue. Optical burn assessment will be made possible by obtaining biological parameters closely related with the skin burn by optical probe methods.1 Blood flow in the skin tissue is a useful biological parameter. Usually, there is abundant blood flow in healthy tissue. On the other hand, a skin burn causes vascular occlusion and stops the blood flow in injured tissue. Therefore, optical probe methods for visualizing the distribution of the blood flow in tissue can be used for burn assessment. Laser Doppler imaging (LDI) can visualize the lateral distribution of blood flow velocity in tissue;3,4 however, it cannot provide sufficiently quantitative parameters on the burn depth. Photoacoustic (PA) microscopy can inform us of the burn depth in the form of a temporal waveform of the PA signal.5,6 However, since LDI and PA microscopy measure the signal originating from the blood in healthy tissue under the injured tissue, the obtained information does not always directly reflect the degree of the skin burn. If one could utilize another biological parameter that reflects the degree of the dermal burn more sensitively than the blood flow, the effectiveness of optical burn assessment would be greatly improved. Collagen molecules, which are abundant in the dermis, have the potential to provide such a biological parameter because thermal denaturation converts the native triple helix of three polypeptide chains to a random coil. Detecting this structural change would enable sensitive burn assessment in the dermis, allowing differentiation among SDB, DDB, and DB. Polarization-sensitive optical coherence tomography has been used to determine burn depth because the birefringence specific to collagen molecules and their aggregates (microfibrils, fibrils, fibers, and bundles) is reduced by thermal denaturation.7,8 However, since the burn causes only a small change in birefringence, it is difficult to visualize the distribution in the burn area with high image contrast. Second-harmonic-generation (SHG) light functions as an effective optical probe that shows high selectivity and good image contrast to collagen molecules as well as high spatial resolution, optical three-dimensional (3-D) sectioning, minimal invasiveness, deep penetration, the absence of interference from background light, and in vivo measurement without additional staining.9,10 Most importantly from the viewpoint of optical burn assessment, since SHG light arises from a non-centrosymmetric triple helix of three polypeptide chains in the collagen molecule, its intensity decreases and finally disappears when thermal denaturation changes the structure of this molecule to a centrosymmetric random coil.11,12 Therefore, thermal denaturation of collagen fibers in various tissues, such as the cornea,13 tendons,14–16 and dermis,17,18 has been investigated by SHG microscopy. These previous studies indicated that SHG light has the potential to be an indicator for monitoring thermal denaturation. However, those experiments were performed using excised tissue specimens ex vivo. To accelerate in vivo applications of SHG microscopy in the field of optical burn assessment, it is essential to evaluate the technique under in vivo conditions. In the work described in this article, we demonstrated in vivo observation of dermal collagen fibers in rat burn models with SHG microscopy and evaluated the potential of SHG microscopy for in vivo optical burn assessment. 2.Materials and Methods2.1.Animal Model of BurnsThe experimental protocol used in this study was approved by the Bioethics Committee for Animal Experiment in Osaka University. An animal model of burns was prepared following the well-established protocol of Walker and Mason.19 The accuracy of this protocol has already been confirmed by histological examination.5 Male Wistar rats (Japan SLC, 8 to 10 weeks old), weighing between 250 and 300 g, were used as the animal model and housed in a climate-controlled animal care facility for one week before use to acclimate themselves to a new environment. On the day before imposing the burn, we anesthetized the rats with isoflurane (4% for induction, 2% for maintenance, each with an flow rate of ). After the animal was anesthetized, its back was shaved and epilated with scissors and hair remover lotion. On the day of imposing the burn, we anesthetized the rats by intraperitoneal injection with a combination anesthetic containing medetomidine ( BW), midazolam ( BW), and butorphanol tartrate ( BW) after inducing anesthesia with the inhalation of isoflurane. Then, a burn 20 mm in diameter was made on each rat by immersing its back in hot water for 10 s. The degree of the skin burn was controlled by the temperature of the hot water: 70°C for an SDB (), 78°C for a DDB (), and 98°C for a DB (). Figure 1 shows photographs of the skin surface for different burn samples. Immediately after making the burn, saline solution ( BW) was intraperitoneally injected for resuscitation. The burned area of the skin was observed in vivo under anesthesia by SHG microscopy within one hour after the burn. Immediately after completing the experiments, the rats were euthanized by intraperitoneal injection of sodium pentobarbitone ( BW). After the euthanasia, biopsy samples were collected, fixed in formaldehyde, and embedded in paraffin wax prior to sectioning. After sectioning at a thickness of 10 µm, histological analysis of the sliced samples was performed using Masson’s trichrome (MT) staining. 2.2.Experimental SetupFigure 2 shows the experimental setup used for our collagen-sensitive SHG microscopy. Since we used a reflective configuration normally employed for SHG microscopy, whose details are given elsewhere,20–22 here we give only a brief description of the setup. A 1250 nm mode-locked Cr:Forsterite laser (Avesta Project Ltd., Moscow, Russian Federation, CrF-65P, , , ) pumped by an ytterbium fiber laser emitting at 1064 nm was used as a laser source. Use of this laser wavelength, lying right in the middle of the optical window in biological tissue ranging from 800 to 1500 nm,23,24 leads to a drastic decrease in photodamage caused by the laser light25,26 and a large enhancement of the probing depth.20 Circularly polarized laser light was focused onto the sample with an objective lens [, , , and oil immersion] after adjusting the power and polarization with a combination of a half-wave plate (), a polarizer (PL), and a quarter-wave plate (). A customized attachment ring (see inset of photograph in Fig. 2) was attached to the rat’s skin with double-sided tape and was used to suppress the motion of the measurement site. By changing the position of the attachment ring with a stepping-motor-driven translation stage, we can select the measured position inside the skin three-dimensionally. In a previous study, by employing this type of ring, we successfully acquired SHG microscopy images of human facial skin in vivo without movement artifacts.22 The backscattered component of the SHG light generated in the sample was reflected by a harmonic separator (HS; ) and selected by a bandpass filter (F; ). Then, the SHG light was detected by a photon-counting photomultiplier with Peltier cooling (PMT; Hamamatsu, H7421-40) connected to a pulse counter. Fig. 2Experimental setup. : half-wave plate; PL: polarizer; : quarter-wave plate; HS: harmonic separator; F: infrared-cut filter; L: lens; PMT: photon-counting-type photomultiplier tube; GMs: galvanometer mirrors; RL1 and RL2: relay lenses; OL: oil-immersion objective lens. 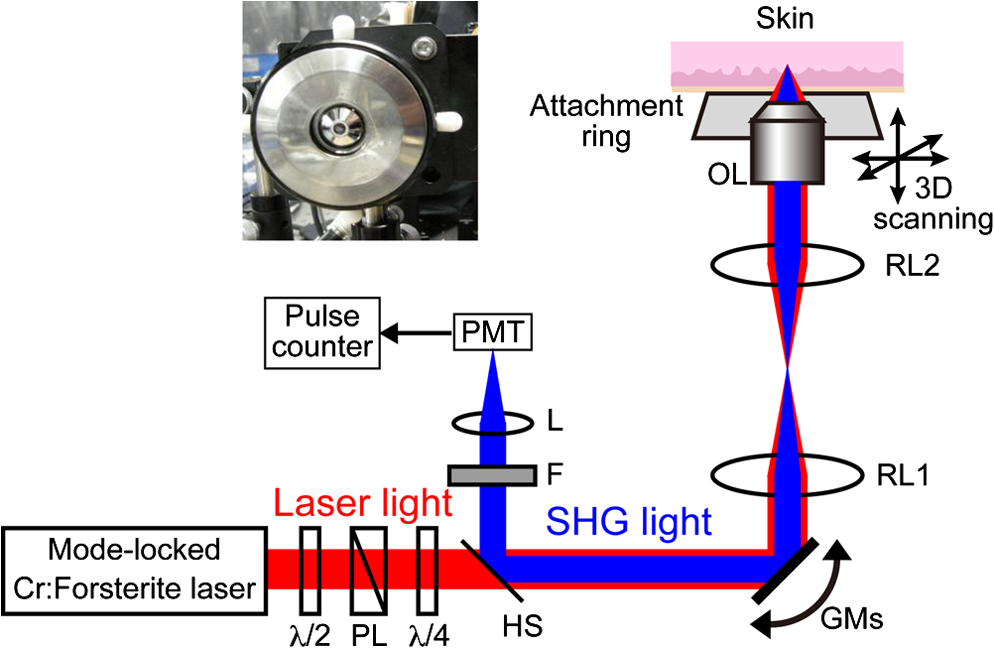 A rapid, small-area, beam scanning system composed of galvanometer mirrors (GMs) and relay lenses (RL1 and RL2) provided SHG images of a region, composed of , at a rate of . However, this imaging region is not always large enough for several applications of SHG microscopy in the field of dermatology because the morphology and mechanical properties of the skin depend on the macroscopic properties of dermal collagen fibers rather than their microscopic properties. Furthermore, a skin burn may lack spatial uniformity, depending on the degree of damage. Therefore, a slow, large-area, sample-scanning system was constructed with a combination of the skin attachment ring and the stepping-motor-driven translation stage. The sample was divided into sixteen imaged regions in four columns by four rows, and the imaged region was shifted by moving the attachment ring with the translation stage. Each imaged region was then scanned by using the GMs to obtain an SHG image. The 16 SHG images obtained in this way were combined to form a single large SHG image with a size of (). This sample-scanning system was also used to obtain depth-resolved SHG images by changing the sample position along the propagation direction of the laser beam. 3.Results3.1.Structural Differences of Dermal Collagen Fibers Among Different BurnsWe first performed depth-resolved SHG imaging for control, SDB, DDB, and DB samples. To visualize structural differences of the dermal collagen fibers at high image contrast, the power of the laser light incident on the sample was adjusted to 10 mW for the control, 15 mW for SDB, 25 mW for DDB, and 40 mW for DB. The resulting series of depth-resolved SHG images are shown in Fig. 3 (, ). Furthermore, a series of more precisely, depth-resolved SHG images was given in Video 1 (, interval of scanning depth ). In this experiment, we defined the skin surface as a depth of 0 µm. The skin surface location was determined by confocal microscopy, which is a function included in the present SHG microscopy system (not shown in Fig. 2). It is interesting that the depths that the SHG light started to appear are different among different degrees of burn: 140 µm for control, 120 µm for SDB, 90 µm for DDB, and 40 µm for DB. This result indicated that the thickness of the epidermis was decreased due to the thermal shrink caused by the skin burn. If the probing depth of SHG microscopy is determined based on the skin surface, the actual probing depth of the dermis was different among the control, SDB, DDB and DB. Therefore, it is important to investigate depth dependency of the dermal collagen fiber for each burn sample. In the control sample, we observed that fine collagen fibers in the papillary dermis changed to thick collagen fibers in the reticular dermis with increasing probing depth [see Fig. 3(a)]. On the other hand, depth-resolved SHG images of the SDB, DDB, and DB samples indicated that each burn spread uniformly over the whole depth of the dermis. In the SDB sample, the SHG vanishing patterns discussed later were overlaid on the fiber structure of the dermal collagen [see Fig. 3(b)]. In the DDB sample, the SHG vanishing patterns became finer than those in the SDB sample [see Fig. 3(c)]. Furthermore, the fibrous structures of the dermal collagen were almost entirely lost and changed into amorphous structures. In the DB sample, a little SHG light was observed only from aggregates of degenerated collagen [see Fig. 3(d)]. Thus, there was no depth dependency of the SHG vanishing pattern for each burn sample within the probing depth range used in the present system. Fig. 3Depth-resolved SHG images of dermal collagen fiber at a depth from 10 to 280 µm in (a) control, (b) SDB, (c) DDB, and (d) DB samples. Incident laser power was 10 mW for control, 15 mW for SDB, 25 mW for DDB, and 40 mW for DB samples. . A series of more precisely depth-resolved SHG images was given in Video 1 (, , MOV 1.5 MB) [URL: http://dx.doi.org/10.1117/1.JBO.18.6.061231.1]. 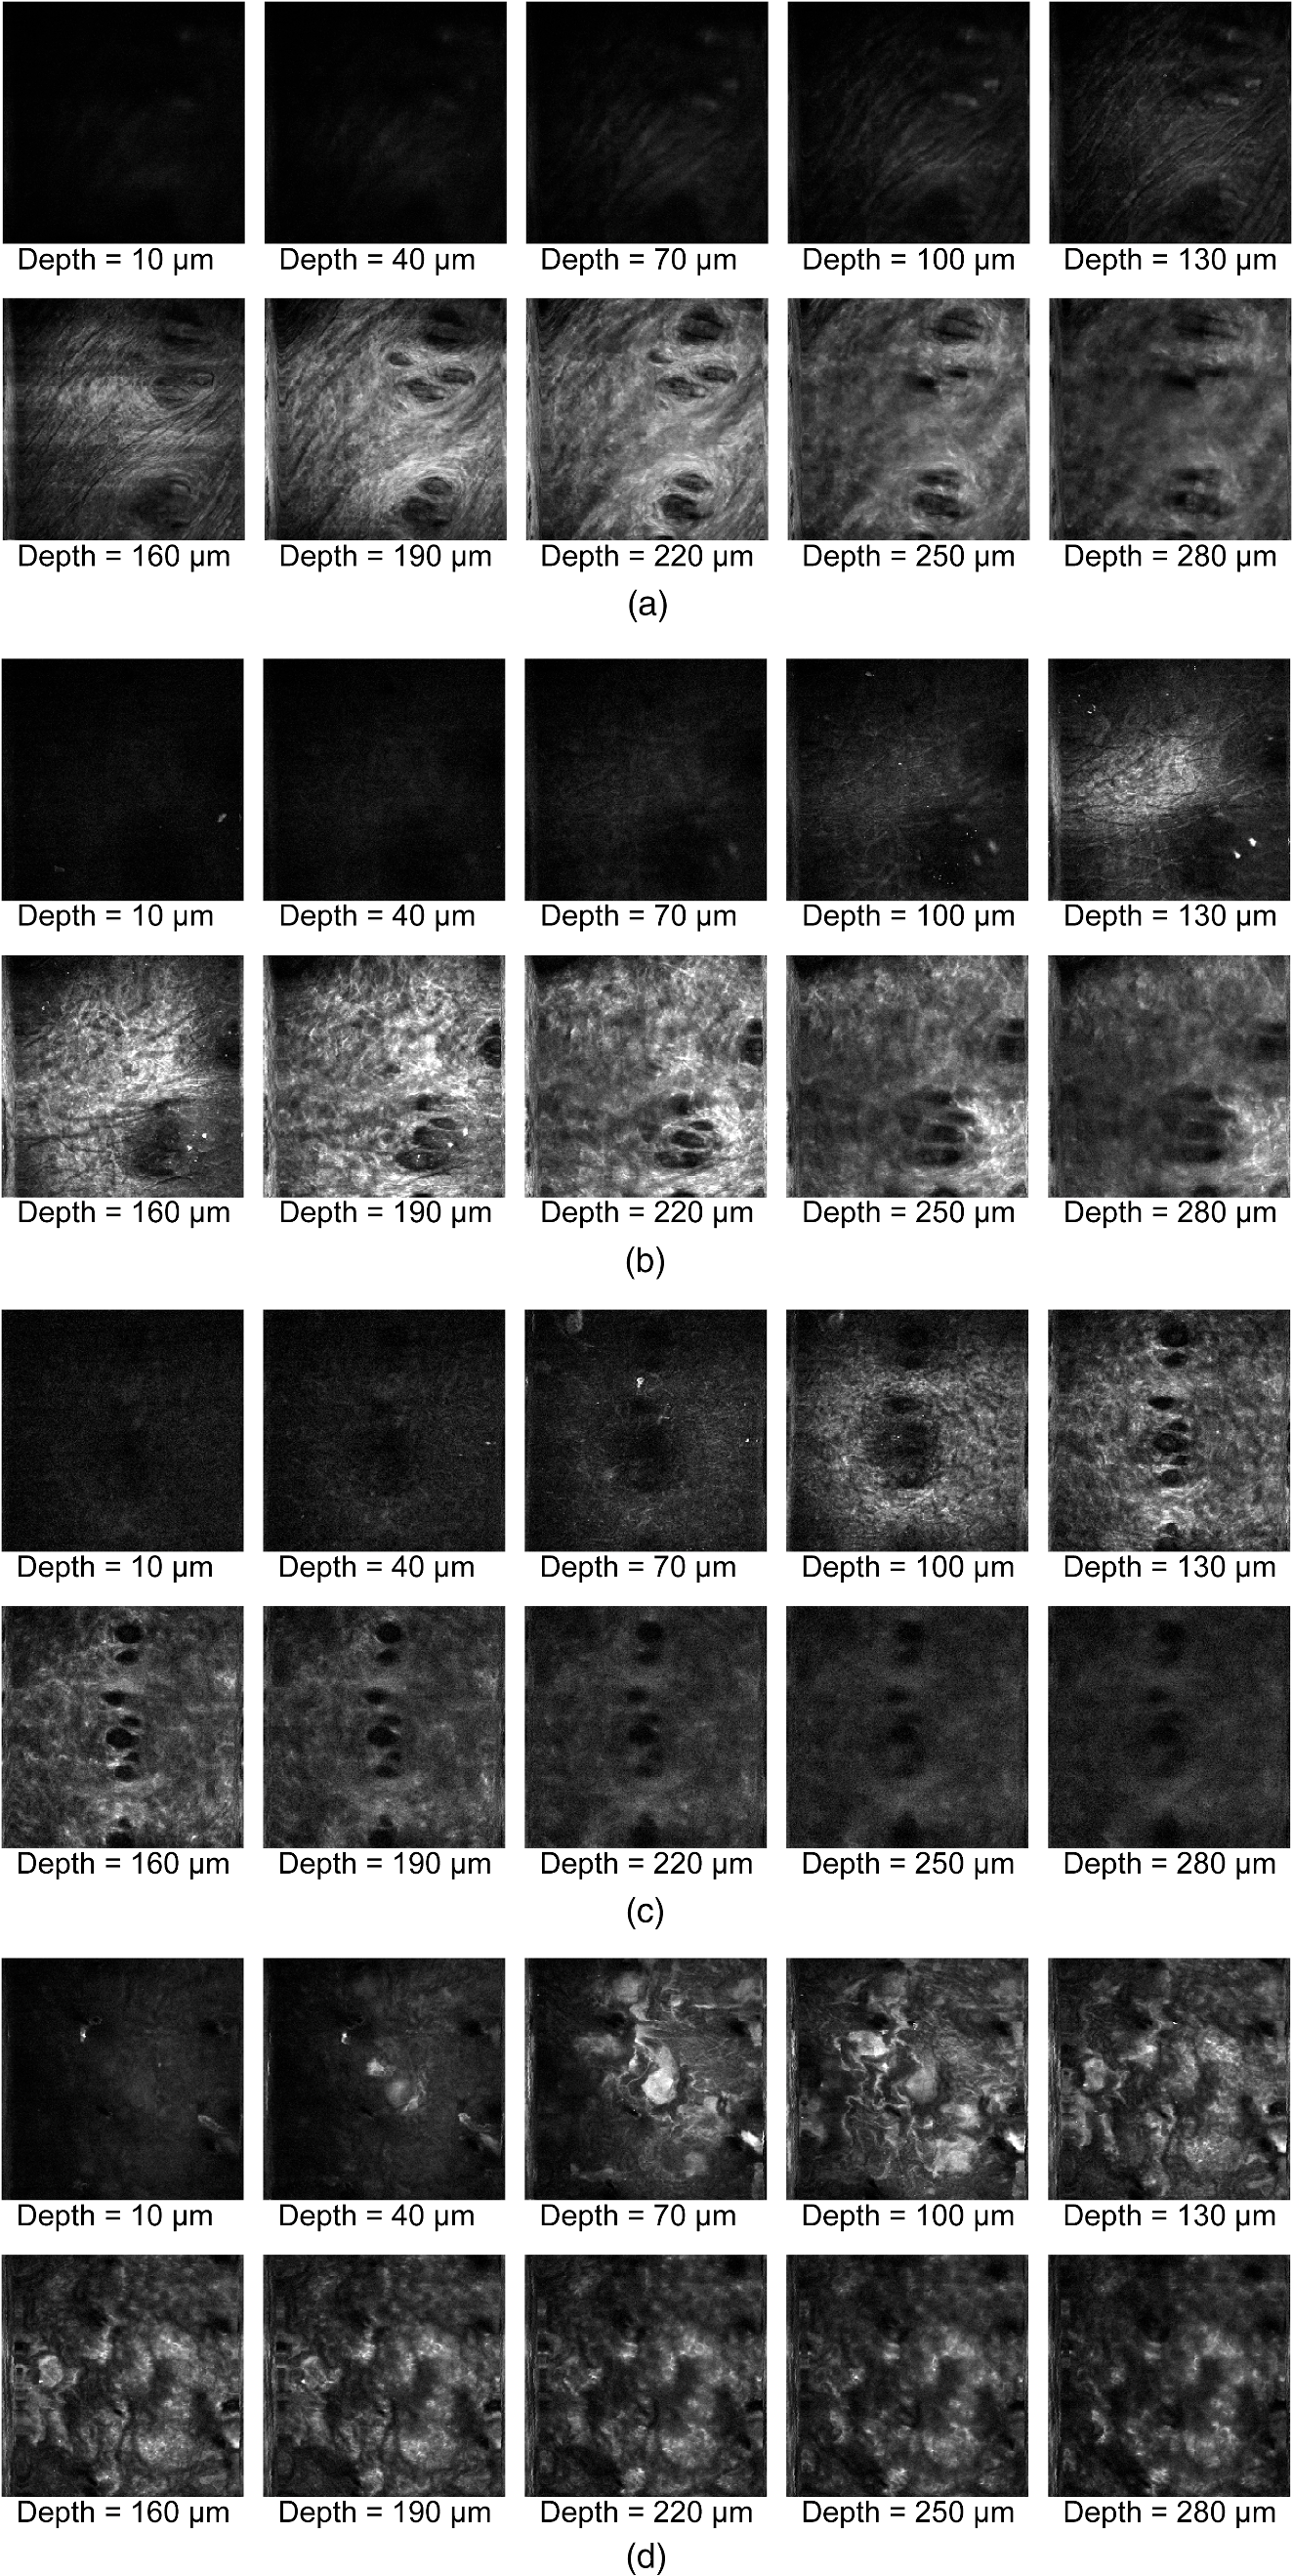 We next performed large-area SHG imaging on the same samples. The laser power incident on the samples was again set to 10 mW for the control, 15 mW for SDB, 25 mW for DDB, and 40 mW for DB. Figure 4 shows large-area SHG images () of these samples at a depth of 180 μm from the skin surface, in which SHG intensity is represented by a common gray-scale for all SHG images by considering the differences in the incident laser power among samples. Imperfect matching of adjacent SHG images at the boundary is mainly due to a slight discrepancy between the imaged regions acquired using the GMs and the movement of the stepping motor stage. The imperfect matching will be reduced in future works by using a method for image heterogeneity correction.27 Although we selected this probing in order to obtain high-contrast SHG images for all samples, it should be considered that shrinking of the burned epidermis changes the actual probing depth of the dermis depending on the degree of the skin burn as discussed above. As a result, SHG images for the burned samples visualized the dermal collagen fiber shallower than that for the control sample. However, since there was no depth dependency of the SHG vanishing pattern for each burn sample in Fig. 3 and Video 1, we did not consider this effect here. Large-area images in Fig. 4 clearly show the structural changes of the dermal collagen fibers caused by the burns. In the case of the control in Fig. 4(a), the fibrous structure of the dermal collagen was clearly observed in the whole field of view. Also, pores in the skin appeared as black circles due to the absence of collagen fiber. The thermal burn largely modified the appearance of the dermal collagen fibers. In the SDB case in Fig. 4(b), many patterns in which the SHG light had vanished appeared on the dermal collagen fibers. In the DDB case in Fig. 4(c), the size of the SHG vanishing pattern decreased further; in other words, inhomogeneity in collagen areas increased further. Similar SHG vanishing patterns have previously been confirmed in ex vivo measurements of excised specimens.14–16 In the case of DB in Fig. 4(d), the SHG light almost completely vanished, indicating that thermal denaturation completed the structural transition of collage molecules from a non-centrosymmetric triple helix to a centrosymmetric random coil. The changes in the SHG images from Fig. 4(b)–4(d) suggests that the SHG vanishing pattern spread progressively, depending on the degree of skin burn. This is consistent with the previous reports of measurements ex vivo, too.14–16 Therefore, we can conclude that our SHG microscopy correctly acquires the structural features in thermally denatured collagen in vivo. A detailed discussion of the reason for the SHG vanishing patterns will be given in the next subsection. 3.2.Histological Analysis with Masson’s Trichrome StainingNext, we performed histological analysis of laterally cross-sectioned samples () to investigate the reason for the signal vanishing pattern in the SHG images. Haematoxylin and eosin stain is normally used for burn assessment.5 Here, however, since we want to clearly reveal the relation between the thermal denaturation of dermal collagen and the SHG vanishing pattern, we used MT staining to dye the collagen fibers blue and the cytoplasm red. Figure 5 shows the histological visualization of (a) control, (b) SDB, (c) DDB, and (d) DB samples. Fig. 5Histological images of excised tissue specimens () with Masson’s trichrome staining: (a) control, (b) SDB, (c) DDB, and (d) DB samples. .  We first paid attention to the red dye in the stained images. Since this dye reveals erythrocyte and/or endothelial cells, the distribution of the capillary vessels in the tissue was visualized. There were no large differences in the capillary vessel distributions among Fig. 5(a)–5(c). For example, the numbers and sizes of the capillary vessels in the SDB and DDB samples [see Fig. 5(b) and 5(c)] did not change compared with those in the control sample [see Fig. 5(a)], implying little structural change of blood vessels caused by SDB and DDB. However, the image of the blood vessels in Fig. 5(d) changed considerably. The amorphous structure shown in Fig. 5(d) indicated that cells in capillary vessels were disrupted and then leaked out to the surrounding collagen. Here, we consider whether the SHG vanishing patterns are due to the capillary vessels. One probable reason is that thermally damaged capillary vessels form a network of shadows in the SHG image. Usually, the diameter of capillary vessels [several micrometers; see Fig. 5(b) and 5(c)] was much smaller than that of the shadowed lines [several tens of micrometers; see Fig. 4(b) and 4(c)]. However, thermal damage due to the burn causes water to leak from capillary vessels, which then causes edema to appear around the capillary vessels. The coexistence of the capillary vessels and edema may increase the diameter of the shadowed lines, forming a network of shadowed lines in the large-area SHG image. However, the similar appearance of the capillary vessels in Fig. 5(a)–5(c) cannot explain the fact that the SHG vanishing pattern became finer and denser depending on the degree of skin burn [see Fig. 4(b) and 4(c)] because the number of capillary vessels did not change from Fig. 5(a)–5(c). Therefore, we concluded that the capillary vessels did not contribute to forming the SHG vanishing patterns. Next, we focused on the distribution and structure of collagen fibers and bundles dyed in blue. As shown in the control sample in Fig. 5(a), collagen bundles were distributed along the skin surface. Furthermore, the collagen fibers were well-organized and aligned in each bundle. Such a fibrous structure was reflected at high image contrast in the optical-sectioning SHG images in Figs. 3(a) and 4(a). The stained image for the SDB sample in Fig. 5(b) was more blurred and less blue than that in Fig. 5(a) in which individual bundles were clearly visualized as a bluish image. In particular, individual fibers in each bundle seem to have been altered to another structure. In the DDB sample in Fig. 5(c), the stained image became more blurred and less blue. A series of these blurred images indicates that thermal shrinkage and/or aggregation of dermal collagen progress at the level of fibers. The decrease in blueness was caused by a gradual change in the microscopic structure from a triple helix (collagen molecule) to a random coil (gelatin molecule). In the DB sample in Fig. 5(d), boundaries between collagen bundles as well as collagen fibers almost completely disappeared and showed a further decrease in blueness. This image reflects the altered morphological appearance of the dermal collagen fibers and bundles, showing their widespread hyalinization. Therefore, SHG light almost completely disappeared in Figs. 3(d) and 4(d). We now consider the reason for the signal vanishing patterns in the large-area SHG images from the viewpoint of thermal denaturation of dermal collagen. The results of MT staining of SDB skin [see Fig. 5(b)] showed a partial distribution of thickened collagen bundles ( several tens of micrometers) in the dermis compared with that of the control skin [see Fig. 5(a)], implying the coexistence of both molten and fibrous structures of dermal collagen. The thickened collagen bundles may be explained by the fact that thermal treatment breaks the hydrogen bonds that stabilize the native triple helical molecular structure of collagen, leading to an irreversible transformation of collagen molecules into random coils.28,29 We consider that such thickened collagen bundles cause the SHG vanishing patterns observed in Fig. 4(b). In the DDB skin in Fig. 5(c), the density of thickened collagen bundles increased, indicating the progressive replacement of the fibrous structure with a molten amorphous structure. This result is consistent with the finer and denser distribution of SHG vanishing patterns shown in Fig. 4(c). As for the DB skin, dermal collagen bundles showed metachromatic staining, which indicates the degeneration of collagen bundles [see Fig. 5(d)]. Since the degenerated collagen bundles were composed of random coils of polypeptide chains, SHG light disappeared due to their centrosymmetric structure, as shown in Fig. 4(d). 3.3.Depth Dependence of Mean SHG IntensityIn vivo SHG microscopy could qualitatively visualize structural changes in dermal collagen fibers caused by skin burns in the form of SHG vanishing patterns (see Fig. 4). Furthermore, a quantitative parameter for burn assessment may be obtained from image analysis of SHG vanishing patterns. Recently, image analysis based on Fourier transformation has been used for SHG images in order to assess the structure of collagen fibers.22,30,31 However, the inhomogeneous structure of dermal collagen fibers sometimes hinders image analysis. On the other hand, many previous papers have reported that SHG intensity rapidly decreases around the thermal denaturation temperature when the sample temperature is increased.11,14,17,18 However, only use of the absolute value for SHG light intensity tends to be influenced by the conditions of the laser source and other factors, although it is related to the degree of thermal denaturation in dermal collagen. Here, we tried to extract a more reliable, quantitative parameter based on a simpler method. We performed depth-resolved SHG imaging for control, SDB, DDB, and DB samples when the incident laser power was set to 10 mW for all burns. Then, we calculated the mean value of SHG intensity across the entire image at each probing depth. After such the procedure was repeated to five rats for the control, SDB, DDB, and DB samples ( for each burn), we calculated the mean and standard deviation of the SHG intensity with respect to the probing depth as shown in Fig. 6. In this figure, the skin surface was defined as a probing depth of 0 µm. On the other hand, since the SHG images started to be blurred deeper than 180 µm due to the multiple scattering, we limited the range of the abscissa below 180 µm. We consider that the reason why the mean SHG intensities in all of the curves did not start from 0 is due to the dark noise of the PMT and/or the background noise of the fundamental light and/or the SHG light coming from the sample. In the control sample, as the probing depth increased, the SHG intensity increased, reaching its peak around a depth of 130 µm, and then decreased. In the SDB sample, the peak value of the mean SHG intensity was greatly decreased, and its position was shifted to a deeper portion compared with the control sample. In the DDB sample, the peak value of the mean SHG intensity was further decreased, whereas the peak position was almost the same as that of the SDB sample. The mean SHG intensity for the DB sample was almost constant at the noise level of the detector, indicating the vanishing of SHG light due to complete thermal denaturation of the collagen molecules. In this way, the depth profile of the SHG light significantly varied depending on the degree of the burn. Fig. 6Dependence of the mean SHG intensity on the probing depth for control, SDB, DDB, and DB samples. Incident laser power was set to 10 mW for each sample. 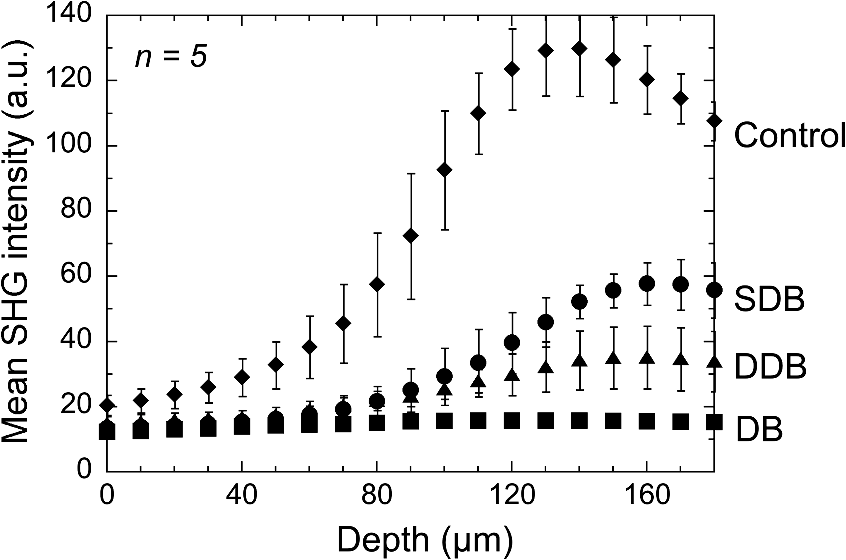 Let us consider the reason for the form of the depth profile. First, SHG light starts to be generated when the focal spot moves from the epidermis to the dermis, and then the generated SHG light reaches a plateau when the focal spot probes a deeper portion in the dermis. Second, the laser light arriving at the focal spot is attenuated due to scattering and absorption, depending on the probing depth. Third, the backscattered SHG light from the focal spot is attenuated in proportional to the probing depth until reaching the skin surface. The balance of these three effects determines the depth profile of the control in Fig. 6, where the SHG light increased, reached the peak, and decreased. Next, we consider the depth profile in the case of SDB, DDB, or DB. Thermal denaturation of dermal collagen fiber largely reduces the generation efficiency of SHG light, namely, the second-order nonlinear-optical susceptibility , due to the structural transition from a triple helix to a random coil. Simultaneously, the burn changes the optical scattering and absorption properties in the epidermis and dermis. These lead to the observed differences among the rising slopes shown in Fig. 6. One interesting feature in these depth profiles is the difference of the depth, indicating the peak of mean SHG intensity, among different burn samples. However, since the depths that the SHG light started to appear were different among them due to the shrink of the burned epidermis as shown in Fig. 3 and Video 1, this parameter may include the influence of the shrunk epidermis. Another interesting feature is the difference of the rising slope among them. To extract this rising slope as a quantitative parameter relating to the skin burn, we performed the curve fitting analysis using an error function (erf) as follows where is the maximum intensity of the SHG light, is the probing depth, is the depth as the SHG light indicates a half of , and is a depth range of the rising slope. Before performing the curve-fitting analysis, the background noise signal was subtracted. Also, the data on the falling slope after the peak of the SHG depth profile was eliminated in the curve fitting analysis. We here defined a ratio of to as a rising slope parameter. Large means the steeply rising slope whereas small indicates gently rising slope. Figure 7 shows a comparison of the rising slope parameter among the control, SDB, DDB, and DB samples (). The rising slope parameter decreased according to the degree of the skin burn. A significant difference () was confirmed between all sample groups except between DDB and DB samples. The reason for no significant difference between DDB and DB samples is mainly due to large error bar of DB caused by too weak SHG light. However, DB will be easily distinguished from other burns by existence of SHG light (see Fig. 6). These results imply a potential of this parameter for optical burn assessment.4.ConclusionWe demonstrated in vivo SHG imaging of dermal collagen fibers in skin burns using a rat burn model under anesthesia. Similar to previous studies of ex vivo measurement of excised tissue specimens,14–16 the influence of thermal denaturation of collagen molecules was visualized in the form of signal vanishing patterns in the SHG image. From a comparison of the SHG images with MT-stained images, the SHG vanishing patterns were caused by the coexistence of molten and fibrous structures of dermal collagen fibers. Furthermore, since the depth profile of the mean SHG intensity across the entire SHG image significantly varied depending on the degree of the burn, we proposed a quantitative parameter for burn assessment based on this SHG depth profile. The demonstrated results show a high promise in SHG microscopy for optical burn assessment in vivo. AcknowledgmentsThe authors acknowledge Dr. Mamoru Hashimoto of Osaka University and Dr. Shun-ichi Sato of the National Defense Medical College, Japan, for fruitful discussion. This work was supported by Grants-in-Aid for Scientific Research Nos. 22300154, 23240069, 23650260, and 23300165 from the Ministry of Education, Culture, Sports, Science, and Technology of Japan. ReferencesD. Heimbachet al.,
“Burn depth: a review,”
World J. Surg., 16
(1), 10
–15
(1992). http://dx.doi.org/10.1007/BF02067108 WJSUDI 0364-2313 Google Scholar
L. Devganet al.,
“Modalities for the assessment of burn wound depth,”
J. Burns Wounds, 5 e2
(2006). Google Scholar
F. W. H. KloppenbergG. I. J. M. BeerthuizenH. J. ten Duis,
“Perfusion of burn wounds assessed by laser Doppler imaging is related to burn depth and healing time,”
Burns, 27
(4), 359
–363
(2001). http://dx.doi.org/10.1016/S0305-4179(00)00138-8 BURND8 0305-4179 Google Scholar
A. D. Jaskilleet al.,
“Critical review of burn depth assessment techniques: part II. Review of laser Doppler technology,”
J. Burn Care Res., 31
(1), 151
–157
(2010). http://dx.doi.org/10.1097/BCR.0b013e3181c7ed60 1559-047X Google Scholar
S. Satoet al.,
“Photoacoustic diagnosis of burns in rats,”
J. Trauma, 59
(6), 1450
–1456
(2005). http://dx.doi.org/10.1097/01.ta.0000197389.94466.04 JOTRA5 0022-5282 Google Scholar
H. F. Zhanget al.,
“Imaging acute thermal burns by photoacoustic microscopy,”
J. Biomed. Opt., 11
(5), 054033
(2006). http://dx.doi.org/10.1117/1.2355667 JBOPFO 1083-3668 Google Scholar
B. H. Parket al.,
“In vivo burn depth determination by high-speed fiber-based polarization sensitive optical coherence tomography,”
J. Biomed. Opt., 6
(4), 474
–479
(2001). http://dx.doi.org/10.1117/1.1413208 JBOPFO 1083-3668 Google Scholar
M. C. Pierceet al.,
“Collagen denaturation can be quantified in burned human skin using polarization-sensitive optical coherence tomography,”
Burns, 30
(6), 511
–517
(2004). http://dx.doi.org/10.1016/j.burns.2004.02.004 BURND8 0305-4179 Google Scholar
I. FreundM. DeutschA. Sprecher,
“Connective tissue polarity. Optical second-harmonic microscopy, cross-beam summation, and small-angle scattering in rat-tail tendon,”
Biophys. J., 50
(4), 693
–712
(1986). http://dx.doi.org/10.1016/S0006-3495(86)83510-X BIOJAU 0006-3495 Google Scholar
P. J. CampagnolaC.-Y. Dong,
“Second harmonic generation microscopy: principles and applications to disease diagnosis,”
Laser Photon. Rev., 5
(1), 13
–26
(2011). http://dx.doi.org/10.1002/lpor.v5.1 1863-8880 Google Scholar
B. M. Kimet al.,
“Collagen structure and nonlinear susceptibility: effects of heat, glycation, and enzymatic cleavage on second harmonic signal intensity,”
Lasers Surg. Med., 27
(4), 329
–335
(2000). http://dx.doi.org/10.1002/(ISSN)1096-9101 LSMEDI 0196-8092 Google Scholar
T. Theodossiouet al.,
“Thermally induced irreversible conformational changes in collagen probed by optical second harmonic generation and laser-induced fluorescence,”
Lasers Med. Sci., 17
(1), 34
–41
(2002). http://dx.doi.org/10.1007/s10103-002-8264-7 LMSCEZ 1435-604X Google Scholar
H. Y. Tanet al.,
“Characterizing the thermally induced structural changes to intact porcine eye, part 1: second harmonic generation imaging of cornea stroma,”
J. Biomed. Opt., 10
(5), 054019
(2005). http://dx.doi.org/10.1117/1.2012987 JBOPFO 1083-3668 Google Scholar
S.-J. Linet al.,
“Monitoring the thermally induced structural transitions of collagen by use of second-harmonic generation microscopy,”
Opt. Lett., 30
(6), 622
–624
(2005). http://dx.doi.org/10.1364/OL.30.000622 OPLEDP 0146-9592 Google Scholar
S.-J. Linet al.,
“Prediction of heat-induced collagen shrinkage by use of second harmonic generation microscopy,”
J. Biomed. Opt., 11
(3), 034020
(2006). http://dx.doi.org/10.1117/1.2209959 JBOPFO 1083-3668 Google Scholar
Y. Sunet al.,
“Investigating mechanisms of collagen thermal denaturation by high resolution second-harmonic generation imaging original research article,”
Biophys. J., 91
(7), 2620
–2625
(2006). http://dx.doi.org/10.1529/biophysj.106.085902 BIOJAU 0006-3495 Google Scholar
M.-G. Linet al.,
“Evaluation of dermal thermal damage by multiphoton autofluorescence and second-harmonic-generation microscopy,”
J. Biomed. Opt., 11
(6), 064006
(2006). http://dx.doi.org/10.1117/1.2405347 JBOPFO 1083-3668 Google Scholar
T. Yasuiet al.,
“Determination of burn depth based on depth-resolved second-harmonic-generation imaging of dermal collagen,”
in Biomedical Optics,
BSuD104
(2010). Google Scholar
H. L. WalkerA. D. Mason,
“A standard animal burn,”
J. Trauma, 8
(6), 1049
–1051
(1968). http://dx.doi.org/10.1097/00005373-196811000-00006 JOTRA5 0022-5282 Google Scholar
T. Yasuiet al.,
“Ex vivo and in vivo second-harmonic-generation imaging of dermal collagen fiber in skin: comparison of imaging characteristics between mode-locked Cr:Forsterite and Ti:Sapphire lasers,”
Appl. Opt., 48
(10), D88
–D95
(2009). http://dx.doi.org/10.1364/AO.48.000D88 APOPAI 0003-6935 Google Scholar
T. Yasuiet al.,
“Observation of dermal collagen fiber in wrinkled skin using polarization-resolved second-harmonic-generation microscopy,”
Opt. Express, 17
(2), 912
–923
(2009). http://dx.doi.org/10.1364/OE.17.000912 OPEXFF 1094-4087 Google Scholar
T. Yasuiet al.,
“In vivo observation of age-related structural changes of dermal collagen in human facial skin using collagen-sensitive second harmonic generation microscope equipped with 1250-nm mode-locked Cr:Forsterite laser,”
J. Biomed. Opt., 18
(3), 031108
(2013). http://dx.doi.org/10.1117/1.JBO.18.3.031108 JBOPFO 1083-3668 Google Scholar
R. R. AndersonJ. A. Parish,
“The optics of human skin,”
J. Invest. Dermatol., 77
(1), 13
–19
(1981). http://dx.doi.org/10.1111/jid.1981.77.issue-1 JIDEAE 0022-202X Google Scholar
P. C. Chenget al.,
“Highly efficient upconverters for multiphoton fluorescence microscopy,”
J. Microsc., 189
(3), 199
–212
(1998). http://dx.doi.org/10.1046/j.1365-2818.1998.00277.x JMICAR 0022-2720 Google Scholar
S.-W. Chuet al.,
“In vivo developmental biology study using noninvasive multi-harmonic generation microscopy,”
Opt. Express, 11
(23), 3093
–3099
(2003). http://dx.doi.org/10.1364/OE.11.003093 OPEXFF 1094-4087 Google Scholar
S.-P. Taiet al.,
“In vivo optical biopsy of hamster oral cavity with epi-third-harmonic-generation microscopy,”
Opt. Express, 14
(13), 6178
–6187
(2006). http://dx.doi.org/10.1364/OE.14.006178 OPEXFF 1094-4087 Google Scholar
V. A. Hovhannisyanet al.,
“Image heterogeneity correction in large-area, three-dimensional multiphoton microscopy,”
Opt. Express, 16
(7), 5107
–5117
(2008). http://dx.doi.org/10.1364/OE.16.005107 OPEXFF 1094-4087 Google Scholar
N. T. WrightJ. D. Humphrey,
“Denaturation of collagen via heating: an irreversible rate process,”
Annu. Rev. Biomed. Eng., 4
(1), 109
–128
(2002). http://dx.doi.org/10.1146/annurev.bioeng.4.101001.131546 ARBEF7 1523-9829 Google Scholar
K. Hayashiet al.,
“The effect of nonablative laser energy on the ultrastructure of joint capsular collagen,”
Arthroscopy, 12
(4), 474
–481
(1996). http://dx.doi.org/10.1016/S0749-8063(96)90043-2 ARTHE3 0749-8063 Google Scholar
R. A. RaoM. R. MehtaK. C. Toussaint,
“Fourier transform-second-harmonic generation imaging of biological tissues,”
Opt. Express, 17
(17), 14534
–14542
(2009). http://dx.doi.org/10.1364/OE.17.014534 OPEXFF 1094-4087 Google Scholar
M. Sivaguruet al.,
“Quantitative analysis of collagen fiber organization in injured tendons using Fourier transform-second harmonic generation imaging,”
Opt. Express, 18
(24), 24983
–24993
(2010). http://dx.doi.org/10.1364/OE.18.024983 OPEXFF 1094-4087 Google Scholar
|


