

|
|
1.IntroductionPharmacokinetics is the study of the absorption, distribution, and excretion of materials such as drugs, radiotracers, and fluorophores in the body.1 Compartment modeling is a classic approach for pharmacokinetic analysis, and the exchange rates of materials between different compartments are defined as pharmacokinetic rates.2 Pharmacokinetic analysis is a promising method for tumor detection, drug development, and metabolic research. Therefore, it has been widely studied in the field of positron emission tomography and magnetic resonance imaging.3,4 Fluorescence molecular tomography (FMT) is a rapidly growing imaging technique that allows noninvasive, highly sensitive, and three-dimensional (3-D) resolution of the metabolic process of fluorophores in small animals in vivo. Recently, FMT has been successfully used to obtain images of pharmacokinetic rates for tumor detection by analyzing time-sequential datasets acquired from boundaries of the imaged objects.2 Imaging of pharmacokinetic rates for organs of small animals has significant value in biological research and drug development, because organs play an important role in the metabolic process. However, FMT has been challenged when applied to this field. One main reason is that FMT suffers from a low spatial resolution due to its inherently ill-posed nature. Thus it is difficult to determine the location of a specific organ in the FMT reconstructed images, which hinders further pharmacokinetic analysis for the organs.5 In addition, because organs have different optical properties, an inaccurate FMT forward model is constructed when different organs are assigned with the same average optical parameters, which further reduces the accuracy of pharmacokinetic analysis.6 Because liver is a particularly important organ for drug metabolism, this work focuses on imaging the pharmacokinetic rates of the liver, which is helpful for studying liver function. In this letter, we propose to obtain pharmacokinetic rate images of indocyanine green (ICG) in mouse liver based on a hybrid FMT and x-ray computed tomography (XCT) system. Anatomical information provided by the XCT system has the following advantages. (1) It can help to construct a more accurate FMT forward model with appropriate optical properties assigned to organs. (2) It can be used to construct a regularization term to constrain the FMT inverse problem and eventually improve reconstruction quality. (3) It can be used to constrain the pharmacokinetic analysis in the specific organs of interest. In a previous study, we obtained qualitative ICG perfusion images in mouse liver.7 However, the pharmacokinetic rate images presented in this letter are capable of providing quantitative images for evaluating liver function. 2.Materials and MethodsThe hybrid FMT/XCT system used in this letter was developed by our group previously.8 The imaged object is placed on a rotation stage. Around the rotation stage, a free-space FMT system and a micro-XCT system are positioned to acquire the fluorescence and x-ray datasets simultaneously. For dynamic FMT problems, the imaged object is rotated continuously for multiple circles. Each circle corresponds to one frame of FMT reconstructed images. In this letter, the FMT inverse problem is resolved by a novel maximum a posteriori (MAP)-structural priors (SP) method, which utilizes the SP obtained from the XCT system based on MAP estimation and can obtain more accurate reconstruction results than the Tikhonov method.9 After FMT reconstruction, the pharmacokinetic parameter images are obtained by fitting each voxel in the 3-D time-sequential FMT reconstructed images to a two-compartmental model as reported previously:10 where is the ICG concentration at the time of ; and are the zero-time intercepts; and and () are the uptake and excretion rates of ICG in the mouse liver. , , , and are the pharmacokinetic parameters in the compartmental model, and the pharmacokinetic rates, and , have obvious physiological significance for quantitative evaluation of liver function.10 The curve of each voxel is normalized by its maximum before fitting.3.Results and DiscussionAnimal experiments were conducted under a protocol approved by the Institutional Animal Care and Use Committee of Tsinghua University. Four BALB/c nude mice (eight weeks old) were used in the in vivo experiment. Each mouse was anesthetized and fixed on the rotation stage during the experiments. A bolus of ICG (0.1 mL, ) was injected through the tail vein. Then the mouse was rotated continousely for 110 circles (about 105 min) to monitor the metabolism process of ICG in the liver. For each circle, the mouse was rotated for 360 deg, and 24 projections were acquired with an angular increment of 15 deg. A point excitation source was provided by a Xenon lamp and located at half-height of the mouse. Fluorescence images were acquired with a excitation filter and an emission filter. After the fluoresence datesets were collected, a hepatobiliary contrast agent for XCT imaging (Fenestra LC) was injected at a dose of body weight through the tail vein. One hour after the injection, the XCT datasets were collected to get the anatomical information. For registration, the XCT and FMT slices were first delivered to the metric coordinate system and then aligned to the coordinate center through their rotational axes, which had been determined previously. Last, they were aligned to the vertical axis according to a steel anchor point that was plastered on the surface of the mouse and could be imaged by both systems. Figure 1 depicts the representative XCT and FMT results. Figure 1(a) is a coronal CT slice. Figure 1(b) and 1(c) are transversal CT slices indicated by the yellow and green dashed lines in Fig. 1(a), respectively. All CT slices were manually segmented to heart, lung, bone, liver, and other tissues. Figure 1(d) and 1(e) are the segmentation results for Fig. 1(b) and 1(c), respectively. A heterogeneous FMT forward model was constructed by assigning the corresponding optical parameters to the segmented organs according to Ref. 7. Figure 1(f)–1(j) are the FMT reconstruction results from several representative frames, and they are normalized by the maximum of the reconstruction results and fused with the CT slice shown in Fig. 1(b). The general metabolic process of ICG in the mouse liver can be observed. However, these images only provide qualitative information. Fig. 1X-ray computed tomography (XCT) and fluorescence molecular tomography (FMT) results of a living mouse. (a) Coronal CT slice. (b) and (c) Transverse CT slices indicated by the yellow and green dashed lines in (a). (d) and (e) Segmentation results for (b) and (c). All CT slices were manually segmented based on pixel grayscale values. (f)–(j) FMT reconstruction results fused with the CT slice shown in (b). These fluorescence images were reconstructed sequentially using maximum a posteriori (MAP)-structural priors (SP) method with a heterogeneous FMT forward model. 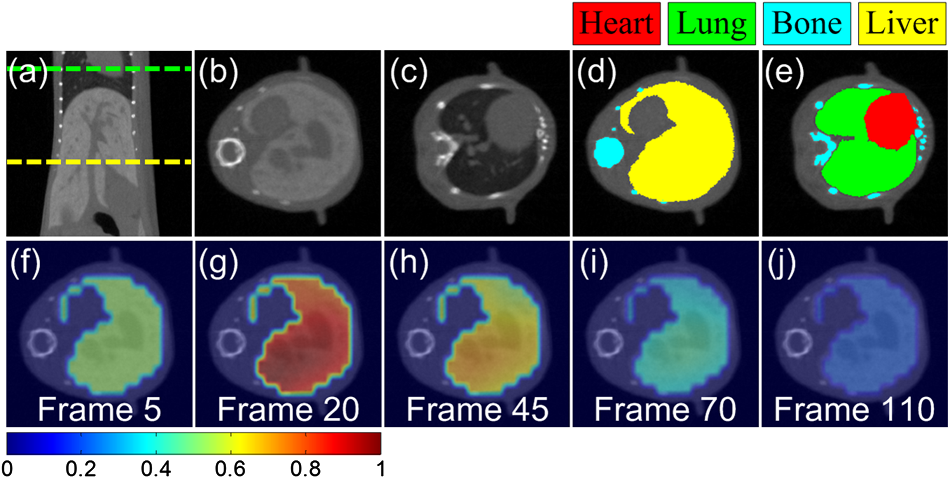 Figure 2 depicts the results of pharmacokinetic parameter imaging for this mouse. Figure 2(a)–2(d) are the images of , , , and for the mouse liver, respectively. Because and () are the rate constants for ICG influx to and disappearance from the liver, they can be used to quantitatively evaluate liver function. Image represents the microcirculatory conditions of the liver, and image represents the cytoplasmic transport and biliary excretion conditions of the liver.10 Figure 2(e) shows the ICG metabolic curve of the liver by assigning the mean values of pharmacokinetic parameters of the liver to Eq. (1). This curve reflects the average metabolic process of the entire liver. Four mice were imaged with the FMT/XCT system sequentially, and the mean values of the pharmacokinetic parameters for each mouse were all obtained in the same way. Table 1 shows the statistical results of the pharmacokinetic parameters. The values are expressed as . Fig. 2Pharmacokinetic parameter imaging for mouse liver. Each image is fused with the CT slice shown in Fig. 1(b). (a) and (b) Images of and (a.u.). (c) and (d) Images of and (). (e) Indocyanine green (ICG) metabolic curve obtained by assigning the mean values of pharmacokinetic parameters of the liver to Eq. (1). a.u., arbitrary units. 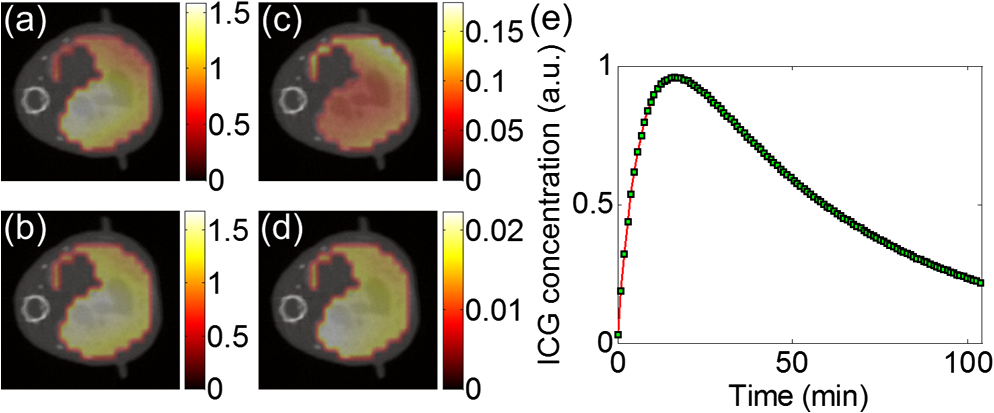 Table 1Pharmacokinetic parameters of indocyanine green (ICG) in the mouse liver obtained with the fluorescence molecular tomography (FMT) system, the FMT/x-ray computed tomography (XCT) system, and the fiber-based system.
Note: A and B are the zero-time intercepts, and α and β (min−1) are the uptake and excretion rates of ICG in the mouse liver. a.u., arbitrary units. For validation purposes, a fiber-based fluorescence measurement system was used to obtain the pharmacokinetic parameters invasively.11 The ICG metabolic curves of the livers for another four BALB/c nude mice were measured using this system. During the experiment, each mouse was anesthetized while a laparotomy was performed to expose the liver, and one fiber was brought into contact with the surface of the mouse liver directly. The four mice were injected with the same dose of ICG as described in the FMT imaging experiments. The pharmacokinetic parameters obtained by the fiber-based system are also shown in Table 1. Figure 3 shows the ICG metabolic curves of the mouse livers obtained with the FMT/XCT system and the fiber-based system by assigning the mean values of the pharmacokinetic parameters to Eq. (1). High correlation () between the two ICG metabolic curves is obtained. The differences in the metabolic curves and pharmacokinetic parameters may be caused by the differences of measurement principles of the two systems, the differences of measurement conditions, as well as the individual differences of mice. Fig. 3ICG metabolic curves of mouse liver obtained with the FMT system (), the FMT/XCT system (), and the fiber-based system (). The curve from the FMT system is obtained with the Tikhonov method without structural priors, and the curve from the FMT/XCT system is obtained with the MAP-SP method.  The datasets of the four mice obtained from the FMT system were also analyzed using the Tikhonov method without structural priors as described in Ref. 9. Corresponding analysis results are shown in Table 1 and Fig. 3. It can be seen from Table 1 that the FMT/XCT system obtained more accurate pharmacokinetic rates than the FMT system. In addition, the correlation of the ICG metabolic curves between the FMT/XCT system and the fiber-based system is higher than that () between the FMT system and the fiber-based system (also see Fig. 3). In conclusion, we have imaged the pharmacokinetic rates of ICG in mouse liver through a hybrid FMT/XCT system. Anatomical information from the XCT system was used to constrain pharmacokinetics imaging to the organ of interest and furthermore construct a heterogeneous FMT forward model. Pharmacokinetic images can provide quantitative information about liver function and thus have the potential to provide more physiological and pathological information for biological studies and drug development. Future work will focus on imaging pharmacokinetic rates of pathological livers and other organs. AcknowledgmentsThis work is supported by the National Basic Research Program of China (973) under Grant No. 2011CB707701; the National Natural Science Foundation of China under Grant Nos. 81227901, 81071191, 81271617; the National Major Scientific Instrument and Equipment Development Project under Grant No. 2011YQ030114; National Science and technology support program under Grant No. 2012BAI23B00. ReferencesL. A. Bauer, Applied Clinical Pharmacokinetics, McGraw-Hill, New York
(2008). Google Scholar
B. AlacamB. Yazici,
“Direct reconstruction of pharmacokinetic-rate images of optical fluorophores from NIR measurements,”
IEEE Trans. Med. Imag., 28
(9), 1337
–1353
(2009). http://dx.doi.org/10.1109/TMI.2009.2015294 ITMID4 0278-0062 Google Scholar
M. Kamasaket al.,
“Direct reconstruction of kinetic parameter images from dynamic PET data,”
IEEE Trans. Med. Imag., 24
(5), 636
–650
(2005). http://dx.doi.org/10.1109/TMI.2005.845317 ITMID4 0278-0062 Google Scholar
C. C. Martinet al.,
“The pharmacokinetics of hyperpolarized xenon: implications for cerebral MRI,”
J. Magn. Reson. Imag., 7
(5), 848
–854
(1997). http://dx.doi.org/10.1002/(ISSN)1522-2586 1053-1807 Google Scholar
X. Liuet al.,
“Unmixing dynamic fluorescence diffuse optical tomography images with independent component analysis,”
IEEE Trans. Med. Imag., 30
(9), 1591
–1604
(2011). http://dx.doi.org/10.1109/TMI.2011.2134865 ITMID4 0278-0062 Google Scholar
D. Hydeet al.,
“Performance dependence of hybrid x-ray computed tomography/fluorescence molecular tomography on the optical forward problem,”
J. Opt. Soc. Am. A, 26
(4), 919
–923
(2009). http://dx.doi.org/10.1364/JOSAA.26.000919 JOAOD6 0740-3232 Google Scholar
X. Liuet al.,
“Imaging of indocyanine green perfusion in mouse liver with fluorescence diffuse optical tomography,”
IEEE Trans. Biomed. Eng., 58
(8), 2139
–2143
(2011). http://dx.doi.org/10.1109/TBME.2011.2151193 IEBEAX 0018-9294 Google Scholar
X. Guoet al.,
“A combined fluorescence and micro-computed tomography system for small animal imaging,”
IEEE Trans. Biomed. Eng., 57
(12), 2876
–2883
(2010). http://dx.doi.org/10.1109/TBME.2010.2073468 IEBEAX 0018-9294 Google Scholar
G. Zhanget al.,
“MAP estimation with structural priors for fluorescence molecular tomography,”
Phys. Med. Biol., 58
(2), 351
–372
(2013). http://dx.doi.org/10.1088/0031-9155/58/2/351 PHMBA7 0031-9155 Google Scholar
H. Shinoharaet al.,
“Direct measurement of hepatic indocyanine green clearance with near-infrared spectroscopy: separate evaluation of uptake and removal,”
Hepatology, 23
(1), 137
–144
(1996). http://dx.doi.org/10.1002/(ISSN)1527-3350 HEPADF 0161-0538 Google Scholar
Q. ChenS. MaoJ. Bai,
“In vivo measurement of indocyanine green biodistribution in mammalian organs using fiber based system,”
Proc. SPIE, 7634 76340C
(2009). http://dx.doi.org/10.1117/12.851851 PSISDG 0277-786X Google Scholar
|


