

|
|
1.IntroductionSmall animal models of human diseases serve as a vital component in modern vision research. Rodents, such as mice and rats, are commonly used in the development of novel therapeutics against diseases causing blindness. To better visualize the cellular microstructure and understand the molecular processes in the living retina, high resolution retinal imaging of rodent eyes is desirable. Techniques such as immunohistology provide a gold standard for studying the animal model retinas with exquisite resolution and a variety of molecular contrast stains, but the invasiveness of the procedure limits it to a single time point and implies the use of many animals. In order to study dynamic processes and the response of a single animal during treatment, noninvasive imaging provides an exciting alternative to histology. Generally for in vivo ocular imaging, obtaining cellular level resolution requires imaging through a large eye pupil and implementation of adaptive optics (AO). AO allows correction of the aberrations caused by refractive surfaces of the eye, allowing diffraction limited lateral resolution.1–10 Visualization of the photoreceptor mosaic has been demonstrated in humans using AO in combination with fundus photography, optical coherence tomography, and confocal scanning laser ophthalmoscopy.11 Previous studies have shown that for young healthy volunteers with excellent vision, the cone mosaics could be resolved down to 2 deg eccentricity from the fovea without AO using a modest eye pupil size (below 3 to 4 mm).12 However, the cone packing density closer to the fovea, or rod photoreceptor packing, is much higher, so a large pupil size and AO correction are required to increase the resolution and allow visualization of these structures. Compared to the human eye, the mouse eye is about smaller, but its numerical aperture (NA) is more than larger.13 The effects of optical aberrations on image quality increase as the NA increases, and this hampers in vivo high resolution imaging in mice.14–17 Attempts have been made to compensate for the aberrations in order to achieve cellular resolution imaging of living mouse retina by using adaptive optics; Biss et al. demonstrated an AO biomicroscope and Alt et al. demonstrated an AO SLO for in vivo imaging of mouse retina, showing that AO correction of monochromatic aberrations increased the brightness and resolution of the images.18–20 However, their results also reported the difficulties of wavefront sensing in mice which might arise from the small eye artifacts. Geng et al. demonstrated the appearance of a double spot in the Hartmann-Shack wavefront sensor (WFS) when a small diameter wavefront beacon resulting in a long depth of focus was incident on the mouse retina, versus a single spot when focusing on a retinal vessel.17 The latest work from Geng et al. showed encouraging results for AO confocal scanning laser ophthalmoscope (cSLO) where the photoreceptor mosaic was visualized for the first time in mouse retina in vivo.21 Compared to cSLO, which is an en face imaging modality, OCT has the advantage of being able to acquire micrometer-resolution cross-sectional images of retina structure.22–26 This unique property of OCT has enabled longitudinal studies with rodents where high precision retinal thickness measurements and detailed visualization of volumetric morphological changes are required.27–30 In addition to the structural information obtained from OCT, its functional extensions such as Doppler OCT,31–33 and flow contrast OCT,34–37 can be used to visualize the vascular network. The perceived quality of OCT images is largely affected by the focal spot size, scanning length, sampling density, and the OCT B-scan averaging techniques that affect the size and contrast of the speckle (coherent noise). What is very often perceived as improved quality of averaged clinical OCT images is achieved by blurring of the speckle pattern and therefore reduction in lateral resolution by a factor of three or more. The goal of this report is to investigate methods to improve the lateral resolution for mouse retina imaging with OCT. In our approach, we incorporated an external objective lens in combination with a refraction canceling fundus lens in order to reduce the aberrations in the mouse eye and to facilitate the imaging procedure. Using this technique, we were able to reduce the size of the speckle by increasing the NA during in vivo mouse retinal imaging. To ensure that the improvement in the spot size (lateral resolution) was not offset by spot blurring created by the increased aberrations, we incorporated an off-the-shelf commercially available adaptive optics system into the mouse retina OCT imaging instrument. This allowed for monitoring and correction of the refractive errors and therefore improvement in the focused spot size. Increasing the NA in OCT reduces the speckle size which in turn reduces the need for averaging and blurring of the images, thereby maximizing the resolution of the images at a given NA. Generally, when implementing AO-OCT for high NA (relative to what is normally used in the OCT technique) retinal imaging there are two main challenges. The first challenge, and the one we address in this report, focuses on increasing the NA of the imaging instrument and our ability to properly measure and correct aberrations in this scenario. As a result, increased lateral resolution and decreased speckle size can be observed. Second, after successful implementation of AO-OCT for high NA imaging, methods to extend the depth of focus of the AO-OCT system while maintaining high lateral resolution can be explored; however, this is beyond the scope of this report. 2.MethodsA custom AO FD-OCT system built at Simon Frasier University was used for mouse retinal imaging. The details of each subsystem are described below. 2.1.FD-OCT EngineA semi-custom FD-OCT engine was used in this research. The light source was a 135 nm bandwidth superluminescent diode centered at 860 nm from Superlum Inc. (Moscow, Russia), corresponding to a coherence length in air of 2.4 μm. The spectrometer was integrated with a Basler sprint camera and was built by Bioptigen Inc. (Durham, North Carolina). The resolution of the spectrometer is . The real-time acquisitions of rodent retina volumes consisted of pixels (). We operated the OCT engine at to match the integration time of the WFS. The corresponding line rate was 33 kHz (accounting for galvo fly-back time). During rodent retinal imaging the power at the cornea was 750 μW, which is below the ANSI limits of maximum permissible exposure at this wavelength for humans.38 Data acquisition was performed using a custom written program with a graphics processing unit (GPU) processing,39,40 for real-time simultaneous display of B-scans and en face view. Final data processing for measurement and presentation was performed using Matlab (Mathworks, Natick, Massachusetts). 2.2.Wavefont SensorWavefront sensing was performed using the same light as for the FD-OCT. A Pellicle beam splitter (PBS) was placed immediately after the collimating lens to redirect 8% of the light backscattered from the sample to a Hartman-Shack WFS. The IrisAO Inc. (Berkeley, California) WFS has 19 mm focal length lenslets arranged in a hexagonal pattern in a one-to-one correspondence with the mirror elements on the deformable mirror (DM). The DM has 111 (PTT111) actuators connected to 37 hexagonal mirror elements (three actuators per segment) with 5 μm stroke (piston/tip/tilt).9 The wavefront sensing centroiding algorithm and AO control program were provided by Iris AO, Inc. and allowed closed-loop aberration correction at 60 Hz. 2.3.Adaptive Optics FD-OCTA schematic of the small animal refractive AO FD-OCT system is presented in Fig. 1. The sample arm consisted of lens based optics (achromatic lenses from Thorlabs. Inc, Newton, New Jersey). In order to prevent back-reflections from the lens surfaces entering the WFS, the lenses were tilted with respect to the optical axis while monitoring the WFS; the tilt angle was less than . Light from the fiber was collimated and directed through a beam expander to the DM. A second set of telescopes was used to relay the pupil to the galvanometer scanning mirrors. A final telescope relayed the pupil to an achromatic objective lens with focal length of 25 mm. Fig. 1Schematic of the small animal AO FD-OCT system: DC–dispersion compensation; DM–deformable mirror; FC-20/80 fiber coupler, 20% of the light from SLD goes to sample arm, 80% goes to reference arm; GM1, GM2–horizontal and vertical galvo scanning mirrors; FL–fundus lens; PC–polarization controller; PBS–pellicle beam splitter; SLD–superluminescent diode; WFS–wavefront sensor; L–achromatic lenses: L0: (); L1, L2: (); L3, L4: (); L5, L6: (); L7, (); L8: (); OBJ – objective: (); ND–neutral density filter; represents the location of the planes conjugated to the pupil throughout the system; and represents the retinal conjugate planes. Inset: the mouse and fundus lens combination can be translated to adjust the focus. GM1 is a slow scan mirror and is presented unfolded for clarity. Note that the schematic is drawn for illustrative purposes only; it does not reflect the actual physical dimensions or the optical configuration of the system.  The beam waist ( radius) at the objective lens was 3.5 mm, corresponding to an imaging NA of 0.14. The beam radius was estimated to be at a distance corresponding to the mouse pupil, which has a maximum dilated radius of . The estimated focal width (Gaussian waist ) was 1.96 μm in air and had a corresponding depth of focus of 28 μm. The system aberrations, measured using a paper scattering phantom placed at the focus, were about 67 nm RMS without AO correction at a scanning angle of 1 deg, which is close to the diffraction limited performance of . With the AO correction activated, the measured RMS for the phantom went down to 20 nm. The Zernike coefficients of the system aberrations are presented in Fig. 2(a). Fig. 2(a) Measurement of the system residual aberrations with a paper phantom in the retinal plane. (b) A representative trace of the RMS wavefront error during mouse imaging. The corresponding Zernike coefficients measured (c) before and (d) during AO correction while imaging a mouse retina with the AO FD-OCT. Note that the scale of vertical axis in (a) is 10 times smaller than that of (c) and (d). (e) Averaged magnitude of Zernike coefficients and standard deviation before and after correction as measured for a sample of 8 mice. The Zernike coefficients follow the OSA standard for reporting the optical aberrations of eyes.  For mouse imaging, a plano-concave lens (2 mm fundus lens, AR coated, Volk Optical Inc. Mentor, Ohio) matching the radius of curvature of the mouse eye was placed immediately after the final objective lens. Figure 3 shows a representative schematic of the fundus lens and an OCT B-scan of the mouse anterior chamber and fundus lens combination acquired in vivo by focusing the beam on the cornea, and adjusting the reference arm path length accordingly. Fig. 3(a) Schematic of the fundus lens positioned at the mouse cornea. (b) OCT image of a fundus lens near the cornea. (c) OCT image of a fundus lens in contact with the cornea.  The refraction canceling fundus lens provided multiple benefits: it reduced lower order aberrations at the highly curved front corneal surface, it reduced back-reflection from the cornea seen by the WFS, and it helped maintain corneal hydration during imaging by protecting the tear film. Furthermore, the concave surface of the fundus lens provided a point of contact for the small animal, bringing the mouse eye to the correct location for imaging. Additionally, since the corneal refraction is canceled by the fundus lens, this allows us to use an objective lens with arbitrarily chosen focal length. By using a longer focal length objective, a smaller stroke in the DM is needed for the same amount of focal shift at the focal plane. This is especially important for designs utilizing small stroke DMs, such as the one used in this report. 2.4.Mouse HandlingMice of strain C57BL/6J (pigmented) were obtained from Jackson Laboratories (Bar Harbor, Maine) and Charles River (Wilmington, Massachusetts). All mouse imaging experiments were performed under protocols compliant to the Canadian Council on Animal Care, and with the approval of the University Animal Care Committee at Simon Fraser University. The mice were anesthetized [ketamine, xylazine, and acepromazine mixture ( body weight) injected intraperitoneally] and their pupils were dilated using a topical solution (atropine sulphate 1%) prior to imaging. Some motion was evident, however, due to animal respiration as observed during image acquisition. During imaging, the anesthetized mouse was placed in an adjustable holder with 5 deg of freedom that offered translation and rotation, allowing the mouse eye positioned for acquisition of images from different retinal eccentricities. In order to maintain corneal hydration, generous amounts of artificial tear gel (Novartis Tear-Gel, 10 g tube) were applied, and held in place with the fundus lens. 3.ResultsWith the anesthetized mouse placed with the eye aligned at the fundus lens, modest focus adjustment was performed by axial translation of the mouse and fundus lens combination relative to the fixed objective lens (see inset in Fig. 1). Since the FD-OCT and the WFS used the same light source, the effects to the WFS spots could be monitored as the location of the focal plane on the mouse retina was adjusted by looking at B-scan. Representative images from the WFS camera are presented in Fig. 4 with the DM held in a “flat” position as characterized by the DM manufacturer. The data in Fig. 4(a) was acquired when the focus was not optimized; the entire retinal thickness was observed to be generally bright in the B-scan, and the wavefront spots were large. Closer inspection revealed two peaks in the wavefront spots, similar to results reported in the literature.17 The WFS data in Fig. 4(b) was acquired after adjusting the position of the focus on the outer retina. In the magnified view, the WFS spots are seen to be more circular, and contain only a single peak which is important for centroid detection and the adaptive optics aberration correction algorithm. In the corresponding simultaneously acquired B-scan, the intensity of the outer retina layers is higher than the inner retinal layers when compared to Fig. 4(a). Fig. 4Images from the WFS camera and corresponding log scale B-scans acquired simultaneously at the same location. A single WFS spot (in the red dotted circles) are shown at higher magnification in the heat maps, and the corresponding intensity profiles were taken at the position of the black line. (a) WFS image with nonoptimized focus. (b) WFS images acquired with the beam focus optimized on the outer retinal layers.  Figure 2(b) to 2(d) show representative measurements of the RMS error and Zernike coefficients recorded by our WFS before and after the AO correction during mouse imaging. Before engaging the AO correction, the mouse eye was aligned along the optical axis and the focus was set to the outer retina. The RMS error before AO correction was measured to be in the range of 0.2 to 0.6 μm, and was dominated by defocus and astigmatism. After the AO correction was activated during animal imaging, the RMS wavefront error was reduced to about 50 nm. The AO system performance for a sample of 8 mice (right eye only) is presented by plotting the averaged magnitude ( deviation) for each of the Zernike coefficients before and after correction in Fig. 2(e). Representative images of mouse retina with a custom built standard resolution FD-OCT system and images from our AO FD-OCT system with a similar light source (axial resolution) are presented in Fig. 5. The optical system of the standard lateral resolution rodent FD-OCT system used to acquire these images is described elsewhere.26–28 Briefly, the system had Gaussian waist () , and a depth of focus of (which is long enough to contain the full thickness of the mouse retina). The standard resolution FD-OCT images were acquired and processed with the same custom written software as the images acquired with the AO FD-OCT system presented in this report. The standard resolution B-scan in Fig. 5 was acquired with a 1.5 mm lateral scan length. Note that all the major retinal layers can be identified in the images and all the retinal layers appear to be bright. The inset shown in the yellow dotted box was acquired with the AO FD-OCT system from a mouse of the same strain as the one used for imaging with the standard resolution FD-OCT system. In the inset, the AO FD-OCT beam is focused on the outer retinal layers which are brighter than the inner retinal layers, if compared to the standard resolution FD-OCT image. As expected the speckle size observed in the AO FD-OCT image is significantly smaller than that of the standard resolution FD-OCT image, enhancing the visibility of the retinal layers. Fig. 5A comparison of regular rodent OCT B-scan with high resolution AO-OCT B-scan (inside yellow dotted box acquired with AO-ON). Both images were acquired from C57BL/6J (pigmented) mouse, and were generated by averaging 20 motion-corrected B-scans. A logarithmic intensity scale was used for both sets of data. Note the smaller speckle size seen on AO FD-OCT inset. Scale bar: 100 μm. 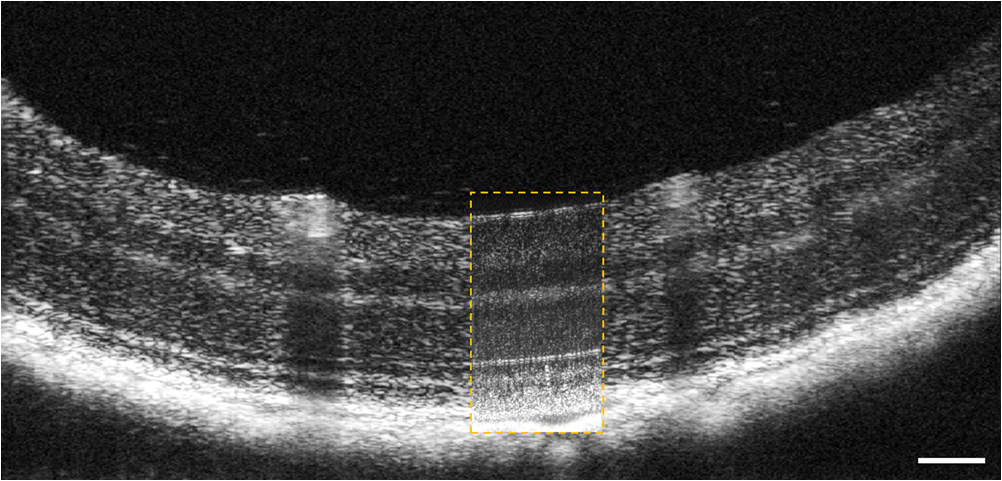 To visualize the effects that the AO system has on the B-scans, we acquired several sets of data at the same retinal location with AO system OFF and ON and displayed the results using linear intensity scale. Figure 6(a) shows an image with the AO system OFF (flat DM) with the focus of the objective lens set on the outer retina. Figure 6(b) shows a B-scan acquired with AO-ON and focused at the outer retina, and Fig. 6(c) shows a B-scan with the focus at the inner retina. With the AO correction activated (AO-ON), the B-scan is brighter as demonstrated on the right panels of Fig. 6; as an example, with the AO activated and focused at the outer retina, the measured intensity of the OLM increased by a factor as can be observed in panels (a) and (b). The effect of the focus shift can be observed by the change of the intensity of corresponding retinal layers in Fig. 6(b) and 6(c). Fig. 6In vivo OCT B-scans images (left) acquired at the same eccentricity from the retinas of C57BL/6J (pigmented) mice and depth intensity profiles (right); (a) was acquired when AO is turned off (DM flat), (b) was acquired when AO was activated and the focus was set on the outer retina, and (c) was acquired when AO was activated and shifting the focus through the AO software to the inner retina. Images (a), (b), and (c) were generated by averaging 20 B-scans and are presented on a linear intensity scale. Scale bar: 50 μm.  After activating the adaptive optics, the focal plane position could be adjusted by changing the defocus in the AO control software. The change in the location of the focal plane in the B-scan image of the mouse retina could be observed in real time as a significant increase in the brightness of the layers at the focus. En face images of the mouse retina were extracted from AO FD-OCT volumes acquired by raster scanning the beam across the retina, with vertically stacked B-scan frames separated by 0.6 μm. Representative images of the retinal nerve fiber layer (RNFL), inner plexiform layer (IPL), and outer plexiform layer (OPL) are presented in Fig. 7. The axial depths indicated by the brackets in the cross-sectional images represent the layers (RNFL, IPL, and OPL) that were in focus and the range of pixels that were summed up to create the en face images. Four sets of volumetric data were acquired at the same location, post-processed with identical parameters (same DC spectrum and same dispersion compensation values), and presented on the same linear intensity scale. The image data in the yellow dotted boxes were averaged along the short axis to generate the intensity plots on the right (the blue line represents AO-ON, and the red dotted line represents AO-OFF). Note the improvement in the sharpness and brightness of the nerve fibers in RNFL and the capillaries in IPL and OPL in Fig. 7 with the AO activated. With the AO-OFF, only the OPL [Fig. 7(f)] had sufficient contrast to enable comparison to the corresponding AO-ON image [Fig. 7(c)], where a 2 to increase in the intensity of the capillaries can be observed from the line graph in the right column. Fig. 7Cross-sectional images of the mouse retina acquired in vivo with the AO FD-OCT system. The focal plane was set on the inner retina by changing the defocus in the AO control software. The axial depths indicated by the brackets in the B-scan represent the locations of (a) to (c) en face projections of different retinal layers with AO-ON and (d) to (f) en face projections at the same location with AO-OFF (DM flat). Scale bar: 30 μm.  Figure 8 shows example images of the retina from a different animal than shown in Fig. 7. Here we visualized different capillary plexus layers and the photoreceptor layer (PRL). Note the improvement in both intensity and resolution (improved width of retinal capillaries) seen on the images. The green dotted boxes in Fig. 8(c) and 8(g) represent the locations where the widths of several capillaries of different sizes were measured with AO ON and OFF. The corresponding line graphs were normalized and are presented in panel (1), (2), and (3) at the bottom of Fig. 8. On average, the diameter of capillaries measured with the AO-ON was narrower than with the AO-OFF. Fig. 8Cross-sectional and en face images (IPL, INL, OPL and PRL) of the mouse retina acquired in vivo with the AO FD-OCT system. The focal plane was adjusted on the layers of interest as indicated by the red brackets in the B-scan images by changing the defocus in the AO control software. The axial depths indicated by the brackets in the B-scan represent the locations of (a) to (d) en face projections of the different retinal layers with AO-ON and (e) (h) en face projections at the same location with AO-OFF (DM flat). Normalized line graphs of the image intensity taken across the capillaries at the locations labeled 1, 2, and 3 in (c) and (g) are presented in the bottom panel. Scale bar: 30 μm.  4.DiscussionThe crucial component in adaptive optics retinal imaging is accurate wavefront sensing. It is particularly challenging with small animals such as mice. Several factors contribute to the complexity of the problem. First, the small size and highly curved eye create large low order aberrations which necessitate a large dynamic range WFS and correction. Second, the quality of the wavefront spots is poor and greatly decreases the accuracy of wavefront measurement. As discussed in the literature,17 the dual peak wavefront spots are likely caused by the two strong reflections in the retina, from the inner retina (RNFL) and from the outer retina (RPE and choroid) which are observed due to the relatively thick retina compared to the short focal length of the eye. Third, the mouse needs to be anesthetized during image acquisition, causing their cornea to dry out and become cloudy. The increased anterior segment scattering blurs the WFS spots and decreases the SNR of light backscattered from the retina if the eyes are not kept moist after anesthetization. Both wavefront images and OCT images will degrade severely with increased clouding of the mouse eye, eventually making wavefront sensing and imaging not possible. One of the design features of our AO FD-OCT system is that we used a fundus lens to remove the refraction at the air-cornea interface, and instead focused the light with an objective lens. This arrangement allowed light to be focused easily on the outer retina by moving the fundus lens and eye combination together axially, where single peak good quality wavefront images could be acquired. Moreover, by using a single beam for both wavefront sensing and FD-OCT, we were able to monitor the region of the retina on which the imaging beam was focused in real time by observing the B-scans. Also, since the eye being imaged was in contact with the fundus lens, drying of the cornea and clouding was effectively reduced. One potential issue of using an objective lens to focus the light on the retina is that the resulting field of curvature of the image plane does not match the curvature of the mouse retina. This is not a concern for our imaging applications because with AO FD-OCT we are only scanning over a very small region. As observed in the B-scan images in Figs. 6 to 8, the retinal surface is effectively flat over small distances. In order to accurately measure and correct the wavefront error, the pupil plane needs to be optically conjugated onto the WFS and DM. We chose to use lens-based telescopes to relay the pupil conjugate planes in order to minimize the astigmatism build-up, a common issue in the mirror based relay systems, and to simplify the optical system design and construction. The compromise with using lenses is the increased back-reflection from the optical refractive elements despite the use of anti-reflection coatings. We mitigated this issue by background subtraction at the WFS, and slightly tilting the lenses. The residual aberrations of our optical system were measured to be on the order of 60 nm RMS, which was negligible compared to the aberrations with the mouse eye present. Alternative techniques to reduce back reflection from the lenses that could be used in the next phase of this research include a confocal pinhole,41 or polarization optics.42 Compared to what has been reported in the literature,17 the defocus term measured in our study with the AO-OFF [presented in Fig. 2(e) as the 4th coefficient of the Zernike polynomial] does not represent the refractive power of the mouse eye, but rather the displacement of the retina relative to the focal plane of the objective. Variations in the measured defocus coefficients may be also affected by the small eye artifact,16,17,43 which arises due to the fact that the mouse retina is relatively thick compared to the focal length of the mouse eye. Additionally, the presence of the fundus lens and objective lens influences the amplitudes of the Zernike coefficients and therefore they should be used as a metric of the optical system performance, rather than as a measure of the remaining aberrations in the mouse eye. The aberrations that can be reliably measured are also limited by the number of lenslets across the pupil; we are using a commercial AO system with 7 lenslets across the pupil (corresponding to 37 lenslets in the WFS). To accommodate to this constraint we adopted a smaller pupil size. The full NA of the mouse eye was not utilized with the current system design. We estimate that a two-fold increase in the resolution will be needed to resolve with high contrast the complete photoreceptor mosaic in cross-sectional and en face images. Unlike cSLO, the axial resolution of OCT depends on the bandwidth of the light source; in order to achieve ultrahigh axial resolution, a wide spectral bandwidth is required. This introduces additional challenges for AO-OCT because as the spectrum is broadened, chromatic aberrations will start to affect the spot size.44 The effect of these chromatic aberrations needs to be studied in further detail to utilize the full NA of the mouse eye. Furthermore, the depth of focus is naturally coupled with the spot size; a small spot size results in a very narrow depth of focus, which is less than the thickness of the PRLs. Fortunately, OCT has very high sensitivity, and out of focus structures are still visible, but with degraded intensity and resolution.44 The work by Geng et al. described that application of a DM with large stroke (45 μm for defocus) was necessary for an ophthalmoscope design utilizing the full NA of the mouse eye.21 In our method, the refraction canceling fundus lens combined with the external objective lens extended the effective focal length of the eye. In combination with the use of a smaller pupil size at the mouse eye, this permitted dynamic focusing throughout the full thickness of the mouse retina even with the use of a small stroke (5 μm) DM. The implementation of our AO FD-OCT system for mouse imaging is generally in agreement with the results of simulations performed for AO imaging in a model of a rat eye.45 By using the same light source for both the OCT imaging and the WFS, the strong chromatic aberrations of the mouse eye resulting in different focal planes were avoided. Furthermore, by using the plano-concave fundus lens in contact with the cornea, we largely removed variation between animals of different strains and ages. The conjugated pupil plane became the objective lens instead of mouse pupil which allows us to place the pupil plane with higher precision, and position the retinal layer of interest to the focal plane. In the future, we plan to improve on the resolution and depth of focus of our system. One of the first steps will be to modify our refractive AO system to allow imaging of the mice through a larger pupil size, thereby increasing the theoretical lateral resolution that is achievable, similarly to recent reports by Geng et al.21 where a 2 mm pupil at the mouse eye was used for imaging with AO-SLO. Using adaptive optics to improve the lateral resolution and eventually achieve cellular resolution imaging of the photoreceptors in vivo is the long range motivation behind this project. Additionally, we plan to incorporate an SLO imaging channel with our rodent AO-OCT system, similar to the design proposed by Zawadzki et al.6 for human retinal imaging. This will allow simultaneous acquisition of structural and potentially functional data from mice in vivo by using novel fluorescent molecular probes offered by optogenetics.46,47 We also plan to investigate ways to extend the depth of focus for the AO FD-OCT system without sacrificing the lateral resolution afforded by AO. Several possible solutions have already been proposed in the literature for high NA OCT imaging, including the use of dynamic focus,48 implementation of a Bessel beam for imaging,49 or the introduction of additional aberrations in AO-OCT system.50 5.ConclusionIn this paper, we presented an AO FD-OCT system for small animal retinal imaging using the same light source for both imaging and wavefront sensing. To facilitate mouse imaging, we used a fundus lens to assist with specimen alignment and cancelation of refraction at the cornea. The in vivo results presented in this paper showed an improvement in the brightness and contrast of capillaries and nerve fiber bundles in mouse retina images. AcknowledgmentsWe acknowledge funding for this research from CIHR–Canadian Institutes of Health Research, NSERC–Natural Sciences and Engineering Research Council of Canada, MSFHR–Michael Smith Foundation for Health Research, and FFB–Foundation Fighting Blindness. R. J. Zawadzki was supported by the National Eye Institute (EY 014743), UC Davis RISE Grant and Research to Prevent Blindness. The authors would like to acknowledge the kind support of Iris AO. ReferencesJ. LiangD. R. WilliamsD. T. Miller,
“Supernormal vision and high-resolution retinal imaging through adaptive optics,”
J. Opt. Soc. Am. A, 14
(11), 2884
–2892
(1997). http://dx.doi.org/10.1364/JOSAA.14.002884 JOAOD6 0740-3232 Google Scholar
A. Roordaet al.,
“Adaptive optics scanning laser ophthalmoscopy,”
Opt. Express, 10 405
–412
(2002). http://dx.doi.org/10.1364/OE.10.000405 OPEXFF 1094-4087 Google Scholar
B. Hermannet al.,
“Adaptive-optics ultrahigh-resolution optical coherence tomography,”
Opt. Lett., 29
(18), 2142
–2144
(2004). http://dx.doi.org/10.1364/OL.29.002142 OPLEDP 0146-9592 Google Scholar
R. J. Zawadzkiet al.,
“Adaptive-optics optical coherence tomography for high-resolution and high-speed 3D retinal in vivo imaging,”
Opt. Express, 13
(21), 8532
–8546
(2005). http://dx.doi.org/10.1364/OPEX.13.008532 OPEXFF 1094-4087 Google Scholar
Y. Zhanget al.,
“High-speed volumetric imaging of cone photoreceptors with adaptive optics spectral-domain optical coherence tomography,”
Opt. Express, 14
(10), 4380
–4394
(2006). http://dx.doi.org/10.1364/OE.14.004380 OPEXFF 1094-4087 Google Scholar
R. J. Zawadzkiet al.,
“Integrated adaptive optics optical coherence tomography and adaptive optics scanning laser ophthalmoscope system for simultaneous cellular resolution in vivo retinal imaging,”
Biomed. Opt. Express, 2
(6), 1674
–1686
(2011). http://dx.doi.org/10.1364/BOE.2.001674 BOEICL 2156-7085 Google Scholar
A. Dubraet al.,
“Noninvasive imaging of the human rod photoreceptor mosaic using a confocal adaptive optics scanning ophthalmoscope,”
Biomed. Opt. Express, 2
(7), 1864
–1876
(2011). http://dx.doi.org/10.1364/BOE.2.001864 BOEICL 2156-7085 Google Scholar
D. X. Hammeret al.,
“Advanced capabilities of the multimodal adaptive optics imager,”
Proc. SPIE, 7785 78850A
(2011). http://dx.doi.org/10.1117/12.876579 PSISDG 0277-786X Google Scholar
S. Manzaneraet al.,
“MEMS segmented-based adaptive optics scanning laser ophthalmoscope,”
Biomed. Opt. Express, 2
(5), 1204
–1217
(2011). http://dx.doi.org/10.1364/BOE.2.001204 BOEICL 2156-7085 Google Scholar
O. P. Kocaogluet al.,
“Imaging cone photoreceptors in three dimensions and in time using ultrahigh resolution optical coherence tomography with adaptive optics,”
Biomed. Opt. Express, 2
(4), 748
–763
(2011). http://dx.doi.org/10.1364/BOE.2.000748 BOEICL 2156-7085 Google Scholar
D. R. Williams,
“Imaging single cells in the living retina,”
Vis. Res., 51
(13), 1379
–1396
(2011). http://dx.doi.org/10.1016/j.visres.2011.05.002 VISRAM 0042-6989 Google Scholar
M. Pircheret al.,
“In vivo investigation of human cone photoreceptors with SLO/OCT in combination with 3D motion correction on a cellular level,”
Opt. Express, 18
(13), 13935
(2010). http://dx.doi.org/10.1364/OE.18.013935 OPEXFF 1094-4087 Google Scholar
Y. Genget al.,
“In vivo imaging of microscopic structures in the rat retina,”
Invest. Ophthalmol. Visual Sci., 50
(12), 5872
–5879
(2009). http://dx.doi.org/10.1167/iovs.09-3675 IOVSDA 0146-0404 Google Scholar
S. RemtullaP. E. Hallett,
“A schematic eye for the mouse, and comparisons with the rat,”
Vis. Res., 25
(1), 21
–31
(1985). http://dx.doi.org/10.1016/0042-6989(85)90076-8 VISRAM 0042-6989 Google Scholar
C. SchmuckerF. Schaeffel,
“A paraxial schematic eye model for the growing C57BL/6 mouse,”
Vis. Res., 44
(16), 1857
–1867
(2004). http://dx.doi.org/10.1016/j.visres.2004.03.011 VISRAM 0042-6989 Google Scholar
E. G. de la Ceraet al.,
“Optical aberrations in the mouse eye,”
Vis. Res., 46
(16), 2546
–2553
(2006). http://dx.doi.org/10.1016/j.visres.2006.01.011 VISRAM 0042-6989 Google Scholar
Y. Genget al.,
“Optical properties of the mouse eye,”
Biomed. Opt. Express, 2
(4), 717
–738
(2011). http://dx.doi.org/10.1364/BOE.2.000717 BOEICL 2156-7085 Google Scholar
D. P. Bisset al.,
“An adaptive optics biomicroscope for mouse retinal imaging,”
Proc. SPIE, 6467 646703
(2007). http://dx.doi.org/10.1117/12.707531 PSISDG 0277-786X Google Scholar
D. P. Bisset al.,
“In vivo fluorescent imaging of the mouse retina using adaptive optics,”
Opt. Lett., 32
(6), 659
–661
(2007). http://dx.doi.org/10.1364/OL.32.000659 OPLEDP 0146-9592 Google Scholar
C. Altet al.,
“An adaptive-optics scanning laser ophthalmoscope for imaging murine retinal microstructure,”
Proc. SPIE, 7550 755019
(2010). http://dx.doi.org/10.1117/12.840583 PSISDG 0277-786X Google Scholar
Y. Genget al.,
“Adaptive optics retinal imaging in the living mouse eye,”
Biomed. Opt. Express, 3
(4), 715
–734
(2012). http://dx.doi.org/10.1364/BOE.3.000715 BOEICL 2156-7085 Google Scholar
V. J. Srinivasan,
“Noninvasive volumetric imaging and morphometry of the rodent retina with high-speed, ultrahigh-resolution optical coherence tomography,”
Investig. Ophthalmol. Vis. Sci., 47
(12), 5522
–5528
(2006). http://dx.doi.org/10.1167/iovs.06-0195 IOVSDA 0146-0404 Google Scholar
O. P. Kocaogluet al.,
“Simultaneous fundus imaging and optical coherence tomography of the mouse retina,”
Investig. Ophthalmol. Vis. Sci., 48
(3), 1283
–1289
(2007). http://dx.doi.org/10.1167/iovs.06-0732 IOVSDA 0146-0404 Google Scholar
M. Ruggeriet al.,
“In vivo three-dimensional high-resolution imaging of rodent retina with spectral-domain optical coherence tomography,”
Investig. Ophthalmol. Vis. Sci., 48
(4), 1808
–1814
(2007). http://dx.doi.org/10.1167/iovs.06-0815 IOVSDA 0146-0404 Google Scholar
S. Haririet al.,
“Limiting factors to the OCT axial resolution for in-vivo imaging of human and rodent retina in the 1060 nm wavelength range,”
Opt. Express, 17
(26), 24304
–24316
(2009). http://dx.doi.org/10.1364/OE.17.024304 OPEXFF 1094-4087 Google Scholar
M. V. Sarunicet al.,
“Longitudinal study of retinal degeneration in a rat using spectral domain optical coherence tomography,”
Opt. Express, 18
(22), 23435
–23441
(2010). http://dx.doi.org/10.1364/OE.18.023435 OPEXFF 1094-4087 Google Scholar
M. D. Fischeret al.,
“Noninvasive, in vivo assessment of mouse retinal structure using optical coherence tomography,”
PloS One, 4
(10), e7507
(2009). http://dx.doi.org/10.1371/journal.pone.0007507 1932-6203 Google Scholar
J. Xuet al.,
“In vivo imaging of the mouse model of x-linked juvenile retinoschisis with Fourier domain optical coherence tomography,”
Investig. Ophthalmol. Vis. Sci., 50
(6), 2989
–2993
(2009). http://dx.doi.org/10.1167/iovs.08-2542 IOVSDA 0146-0404 Google Scholar
Y. Baiet al.,
“Chronic and acute models of retinal neurodegeneration TrkA activity are neuroprotective whereas p75NTR activity is neurotoxic through a paracrine mechanism,”
J. Biol. Chem., 285
(50), 39392
–39400
(2010). http://dx.doi.org/10.1074/jbc.M110.147801 JBCHA3 0021-9258 Google Scholar
M. L. Gabrieleet al.,
“Reproducibility of spectral-domain optical coherence tomography total retinal thickness measurements in mice,”
Investig. Ophthalmol. Vis. Sci., 51
(12), 6519
–6523
(2010). http://dx.doi.org/10.1167/iovs.10-5662 IOVSDA 0146-0404 Google Scholar
R. Leitgebet al.,
“Real-time assessment of retinal blood flow with ultrafast acquisition by color Doppler Fourier domain optical coherence tomography,”
Opt. Express, 11
(23), 3116
–3121
(2003). http://dx.doi.org/10.1364/OE.11.003116 OPEXFF 1094-4087 Google Scholar
W. Choiet al.,
“Measurement of pulsatile total blood flow in the human and rat retina with ultrahigh speed spectral/Fourier domain OCT,”
Biomed. Opt. Express, 3
(5), 1047
–1061
(2012). http://dx.doi.org/10.1364/BOE.3.001047 BOEICL 2156-7085 Google Scholar
D. X. Hammeret al.,
“Imaging flow dynamics in murine coronary arteries with spectral domain optical Doppler tomography,”
Biomed. Opt. Express, 3
(4), 701
–714
(2012). http://dx.doi.org/10.1364/BOE.3.000701 BOEICL 2156-7085 Google Scholar
A. Mariampillaiet al.,
“Speckle variance detection of microvasculature using swept-source optical coherence tomography,”
Opt. Lett., 33
(13), 1530
–1532
(2008). http://dx.doi.org/10.1364/OL.33.001530 OPLEDP 0146-9592 Google Scholar
J. Fingleret al.,
“Volumetric microvascular imaging of human retina using optical coherence tomography with a novel motion contrast technique,”
Opt. Express, 17
(24), 22190
–22200
(2009). http://dx.doi.org/10.1364/OE.17.022190 OPEXFF 1094-4087 Google Scholar
D. W. Cadotteet al.,
“Speckle variance optical coherence tomography of the rodent spinal cord: in vivo feasibility,”
Biomed. Opt. Express, 3
(5), 911
–919
(2012). http://dx.doi.org/10.1364/BOE.3.000911 BOEICL 2156-7085 Google Scholar
Z. Zhiet al.,
“Optical microangiography of retina and choroid and measurement of total retinal blood flow in mice,”
Biomed. Opt. Express, 3
(11), 2976
–2986
(2012). http://dx.doi.org/10.1364/BOE.3.002976 BOEICL 2156-7085 Google Scholar
“American National Standard for the Safe Use of Lasers ANSI Z136.1-2007,”
(2007). Google Scholar
J. Liet al.,
“Performance and scalability of Fourier domain optical coherence tomography acceleration using graphics processing units,”
Appl. Opt., 50
(13), 1832
–1838
(2011). http://dx.doi.org/10.1364/AO.50.001832 APOPAI 0003-6935 Google Scholar
Y. JianK. WongM. V. Sarunic,
“Graphics processing unit accelerated optical coherence tomography processing at megahertz axial scan rate and high resolution video rate volumetric rendering,”
J. Biomed. Opt., 18
(2), 026002
(2013). http://dx.doi.org/10.1117/1.JBO.18.2.026002 JBOPFO 1083-3668 Google Scholar
S. A. RahmanM. J. Booth,
“Adaptive optics for high-resolution microscopy: wave front sensing using back scattered light,”
Proc. SPIE, 8253 82530I
(2012). http://dx.doi.org/10.1117/12.909845 PSISDG 0277-786X Google Scholar
F. Felbereret al.,
“Lens based adaptive optics scanning laser ophthalmoscope,”
Opt. Express, 20
(16), 17297
–17310
(2012). http://dx.doi.org/10.1364/OE.20.017297 OPEXFF 1094-4087 Google Scholar
T. M. S. GreilingJ. I. Clark,
“The transparent lens and cornea in the mouse and zebra fish eye,”
Semin. Cell Dev. Biol., 19
(2), 94
–99
(2008). http://dx.doi.org/10.1016/j.semcdb.2007.10.011 1084-9521 Google Scholar
R. J. Zawadzkiet al.,
“Ultrahigh-resolution optical coherence tomography with monochromatic and chromatic aberration correction,”
Opt. Express, 16
(11), 8126
–8143
(2008). http://dx.doi.org/10.1364/OE.16.008126 OPEXFF 1094-4087 Google Scholar
X. ZhouP. BedggoodA. Metha,
“Limitations to adaptive optics image quality in rodent eyes,”
Biomed. Opt. Express, 3
(6), 1811
–1824
(2012). http://dx.doi.org/10.1364/BOE.3.001811 BOEICL 2156-7085 Google Scholar
L. FennoO. YizharK. Deisseroth,
“The development and application of optogenetics,”
Ann. Rev. Neurosci., 34 389
–412
(2011). http://dx.doi.org/10.1146/annurev-neuro-061010-113817 ARNSD5 0147-006X Google Scholar
D. Oronet al.,
“Two-photon optogenetics,”
Prog. Brain Res., 196 119
–143
(2012). http://dx.doi.org/10.1016/B978-0-444-59426-6.00007-0 PBRRA4 0079-6123 Google Scholar
M. PircherE. GötzingerC. K. Hitzenberger,
“Dynamic focus in optical coherence tomography for retinal imaging,”
J. Biomed. Opt., 11
(5), 054013
(2006). http://dx.doi.org/10.1117/1.2358960 JBOPFO 1083-3668 Google Scholar
R. A. Leitgebet al.,
“Extended focus depth for Fourier domain optical coherence microscopy,”
Opt. Lett., 31
(16), 2450
–2452
(2006). http://dx.doi.org/10.1364/OL.31.002450 OPLEDP 0146-9592 Google Scholar
K. Sasakiet al.,
“Extended depth of focus adaptive optics spectral domain optical coherence tomography,”
Biomed. Opt. Express, 3
(10), 2353
–2370
(2012). http://dx.doi.org/10.1364/BOE.3.002353 BOEICL 2156-7085 Google Scholar
|


