
|
|
1.IntroductionAcute coronary events are primarily caused by thrombogenesis following vulnerable atherosclerotic plaque rupture and are the leading cause of sudden cardiac death in the United States.1 Recent advances in intravascular imaging techniques have provided new insights into the mechanisms underlying the development of unstable atherosclerotic lesions, however, these studies have not produced systematic approaches capable of identifying high-risk plaques prior to rupture.2 It is increasingly probable that combined information on anatomical and physiological parameters is required to determine whether a specific lesion is susceptible to rupture, and several of these parameters may be evaluated through catheter-based intravascular imaging approaches.3–6 Intravascular ultrasound (IVUS) has been widely adopted by the clinical community and is capable of assessing tissue properties within the vessel wall through IVUS elastography and virtual histology techniques.4,6 Optical coherence tomography provides a resolution of 10 to 15 μm, approximately five times better than 40 MHz IVUS, and can evaluate clinically important plaque structural features such as the thickness of fibrous caps and the presence of a necrotic core or lipid deposits.7 While these approaches have demonstrated potential for systematically characterizing the structural components of atherosclerotic plaque, they often fail to provide insight into physiological and biochemical processes that may be precursors to plaque rupture.8–12 To address this deficiency, fluorescence, photoacoustic, and spectroscopic catheters have been developed to optically detect the molecular signatures of vulnerable plaque.13–16 Plaque characterization, via these optical techniques, relies on the detection of endogenous molecules within the plaque or exogenous probes that are either targeted to extracellular ligands or are activated by physiological processes within the vessel wall.17–19 Both approaches enable direct monitoring of physiological function rather than anatomical structure which is hypothesized to further improve the detection and specialized treatment of vulnerable atherosclerotic plaque.20 Intravascular near-infrared fluorescence (NIRF) imaging has emerged as a robust approach for molecular imaging of atherosclerosis due to continued development of targeted imaging agents, high inherent detection sensitivities (nM), relatively low light attenuation through blood, and low background fluorescence from endogenous molecules in the vessel wall.18,21 NIRF catheters have been employed to study animal models of atherosclerosis and have demonstrated the capacity to identify regions of atheroma formation using FDA-approved exogenous fluorophores.19 However, intravascular NIRF acquisition systems cannot acquire anatomical images of the vessel wall and lack a direct means of correcting for light attenuation through unknown quantities of luminal blood. Together, these limitations compromise the accuracy of diagnostic conclusions regarding the risk of vulnerable plaque and are an impediment to future clinical translation of the technique. Interpretation of NIRF measurements is complicated by the distance-dependent attenuation of light through blood. Catheter-to-vessel wall distances cannot be determined directly from NIRF measurements, but they can be estimated from coregistered IVUS images if NIRF and IVUS capabilities are integrated into a single catheter. Precedence exists for using ultrasound ranging data to detect optical sensing distances and, while other multimodality catheters have been presented in the literature, none have demonstrated the capacity to acquire coregistered imaging data for the purposes of correcting for random catheter positioning within the vessel lumen.10,22–24 In this work, we describe the design of a combined NIRF-IVUS catheter for the correction of distance dependent attenuation of light through luminal blood. IVUS and NIRF components are rotated independently of one another, which allows for coincident acquisition of high frame rate IVUS images and long exposure NIRF measurements. Spatial registration of NIRF-IVUS data is achieved by image postprocessing steps that map NIRF measurements to discrete sections of the vessel wall. Catheter-to-vessel wall distance is estimated from IVUS data and is incorporated into a light propagation model in order to correct NIRF measurements for variable sensing distances. In this study, we demonstrate the use of this instrument to correct for variable catheter sensing distances in coronary vessel phantoms and ex vivo porcine arteries using the exogenous fluorophore 1,1'-dioctadecyl-3,3,3',3'-tetramethylindotricarbocyanine iodide (DiR) as a NIRF imaging agent. 2.Materials and Methods2.1.Combined NIRF-IVUS CatheterLight from a 750 nm CW laser (BWF1-750, B&W Tek, Newark, Delaware) was focused into the proximal end of a 200 μm diameter, 0.22 NA, multimode optical fiber (AFS200/220A, Fiberguide Industries, Stirling, New Jersey) and was reflected at a 90 deg angle from the fiber axis by an aluminum-coated microprism (NT66-768, Edmund Optics, Barrington, New Jersey). Fluorescence emission was collected by the same side-viewing optical fiber and was passed through a 770 nm dichroic mirror and a 750 nm band-stop filter to attenuate residual 750 nm excitation light (Iridian Spectral Optics, Ottawa, Ontario, Canada). Emission channel leakage was approximately 2% to 4% of excitation power and was caused primarily by back-reflection of excitation light from the proximal face of the optical fiber. Emission light was passed through a prism-based spectrophotometer to improve detection sensitivity by separating fluorescence signal from residual excitation light and was detected by a CCD camera (C4742-95, Hamamatsu, Bridgewater, New Jersey). A separate photodiode monitored laser power in order to correct NIRF measurements for deviations in excitation power. A schematic of the NIRF-IVUS catheter is shown in Fig. 1(a). The NIRF optical fiber was bound to the sheath of a commercially available IVUS catheter and extended 1 mm beyond the single-element ultrasound transducer (Revolution 45 MHz, Volcano Corp., San Diego, California). Adjustment of the NIRF field-of-view was achieved by rotating the IVUS catheter sheath, in discrete increments, with a separate rotation motor as shown in Fig. 1(b). The position of the NIRF optical fiber, at the time of NIRF sensing, was determined by tracking the center of an acoustic reverberation artifact caused by the optical fiber within the IVUS field-of-view. The NIRF field-of-view was fixed at a 30-deg angle relative to an imaginary line drawn between the centers of the IVUS and optical fiber [Fig. 1(b)]. The IVUS element was rotated within the catheter sheath by a Volcano In-Vision Gold 3 imaging device. The combined NIRF-IVUS catheter had an outer diameter of 1.4 mm (4.2 French). Fig. 1(a) Schematic of the prototype near-infrared fluorescence (NIRF)-intravascular ultrasound (IVUS) imaging system. The IVUS element is rotated by rotation motor R1. The IVUS sheath and NIRF optical fiber are rotated by rotation motor R2. Optical components are abbreviated as follows: PD, photodiode; DM, dichroic mirror; , filter; AP, aperture; , prism. (b) The IVUS element rotates about its axis and the optical fiber is advanced to new angular sensing positions as the catheter sheath is rotated by rotation motor R2.  IVUS images were captured at frame rates exceeding 30 frames per second with a 4 mm radial imaging depth. NIRF measurements were acquired with 50 ms exposure times with 7 mW power. IVUS images were downloaded from the IVUS imaging system to a PC, and were processed in conjunction with NIRF measurements using custom algorithms written in MATLAB (Mathworks Inc., Natick, Massachusetts). 2.2.Analytical Light Propagation Model and Fluorescence EstimationA two-layer analytical model of light propagation was developed to correct NIRF measurements for variable sensing distances through blood. The geometry of the two-layer model is illustrated in Fig. 2. Light propagation through blood was modeled by the following equation, which was originally derived by Twersky, and has proven accurate across physiological ranges of hematocrit and blood oxygenation:25–27 where is the transmitted power, is the excitation power, is the absorption coefficient of hemoglobin, is the propagation distance of light, is the fractional hematocrit, and and are constants related to scattering and detection geometry. This framework resolves the total attenuation from blood into two distinct parts which are absorption caused by hemoglobin and light attenuation due to scattering. Hemoglobin-specific attenuation () was calculated using the extinction coefficient of hemoglobin, scattering is a function of , which is known, and and which are determined by fits to experimental data.28Fig. 2One-dimensional (1-D) model of light propagation. Subscripts denote excitation power, , at the beginning of each layer and cumulative fluorescence intensity, , sensed by the optical fiber. Attenuation through blood is governed by Eq. (1) and fluorescence emission from the vessel wall is estimated by Eq. (2).  Emitted fluorescence was modeled by Eq. (2), which is derived from one-dimensional (1-D) diffusion theory by using the Eddington approximation to model fluorescence emission from a homogenous, semiinfinite, and turbid medium:29 where is the absorption coefficient of the fluorophore, is the fluorophore quantum yield, , is the power of the excitation light incident on the vessel wall, and are the general and particular solutions of the diffusion equation,30 is the total extinction coefficient (), andIn Eqs. (2) and (3), the subscripts and refer to excitation and emission wavelengths, respectively, and is the reduced scattering coefficient [ where is the optical scattering anisotropy]. Optical parameters at excitation and emission wavelengths were assumed to be equal in Eq. (2). Equation 2 models attenuation of the excitation light, fluorescence conversion, and attenuation of fluorescence emission within the vessel wall. The fluorescence intensity sensed by the optical fiber is approximated by multiplication with a constant related to the acceptance angle of the optical fiber.31 Fluorescence intensity is related to fluorophore concentration by the absorption coefficient, , and the quantum yield, , such that values of scale linearly with changes in fluorophore concentration if no quenching occurs. Thus, relative fluorophore concentration is proportional to the magnitude of , which can be determined using an inverse-estimation approach when solving Eq. (2) and assuming that all other parameters in Eqs. (1) and (2) are known. In inverse estimation, the value of that best fits the mathematical model to experimental NIRF data is determined in an iterative least-squares optimization process. A trust-region-reflective algorithm was used in this work. After calibration to known fluorophore concentrations in tissue-mimicking phantoms, estimated values of can be used to determine the concentration of unknown fluorescent samples.32 2.3.NIRF-IVUS Phantom StudiesFour concentrations of the fluorophore DiR (excitation: 750 nm, emission: 780 nm) were prepared in a tissue mimicking medium comprised of 3.5% v/v Intralipid and 0.05% v/v India Ink (, , ).33 The optical parameters of the tissue-mimicking medium were intended to model the intimal layer of the vessel wall.34 DiR samples were placed in cuvettes of varying thickness and were surrounded by whole bovine blood with fractional hematocrits of 0.40, 0.45, and 0.50. Hematocrit was measured by centrifugation of heparinized blood. Coregistered NIRF and IVUS measurements were acquired at increasing sensing distances from the fluorescent samples. Sensing distances, measured manually from the IVUS images, were validated against ground-truth sensing distances provided by a calibrated motion stage. 2.4.NIRF-IVUS Catheter ValidationThe NIRF-IVUS catheter was validated in an in vitro vessel phantom. A transparent PTFE tube, with a 3.1 mm inner diameter and 100 μm thick walls, served as the vessel lumen and was filled with whole bovine blood with 0.40, 0.45, or 0.50 fractional hematocrit. Four borosilicate glass tubes, filled with DiR in the tissue-mimicking medium, were placed around the circumference of the PTFE tube to simulate discrete fluorescent targets within the phantom. Fluorophore concentrations were estimated for each sample of DiR from rotational NIRF-IVUS measurements acquired within the vessel phantom. All data is reported as . Paired two-sample -tests were performed to determine whether the NIRF correction method produced a statistically significant improvement in fluorophore concentration estimation for each concentration tested. 2.5.Image ProcessingThe vessel wall was segmented using an active contours segmentation framework (Fig. 3).35 IVUS images were preprocessed using a two-dimensional (2-D) bilateral filter to suppress speckle and by a Sobel operator to detect the edges of the vessel wall.36 It was assumed that there was a sufficient difference in image contrast between the blood-filled lumen and the vessel wall to enable robust edge detection. Iterative gradient vector flow was performed on the edge-enhanced image to produce an external force term to guide contour evolution.37 A circular contour was initialized in the center of the IVUS image and iteratively evolved until a minimum energy condition was reached that preferentially guided the contour to the edges of the vessel wall. Fig. 3Image processing steps employed to measure NIRF sensing distances from IVUS data. The top path shows intermediate images formed to produce external energy images, Fx and Fy, for the active contours algorithm. The initial contour is seeded around the circumference of the null space in the IVUS image and evolves until the termination condition is met. The bottom path shows thresholding and morphological steps used to isolate the reverberation artifact caused by the optical fiber. 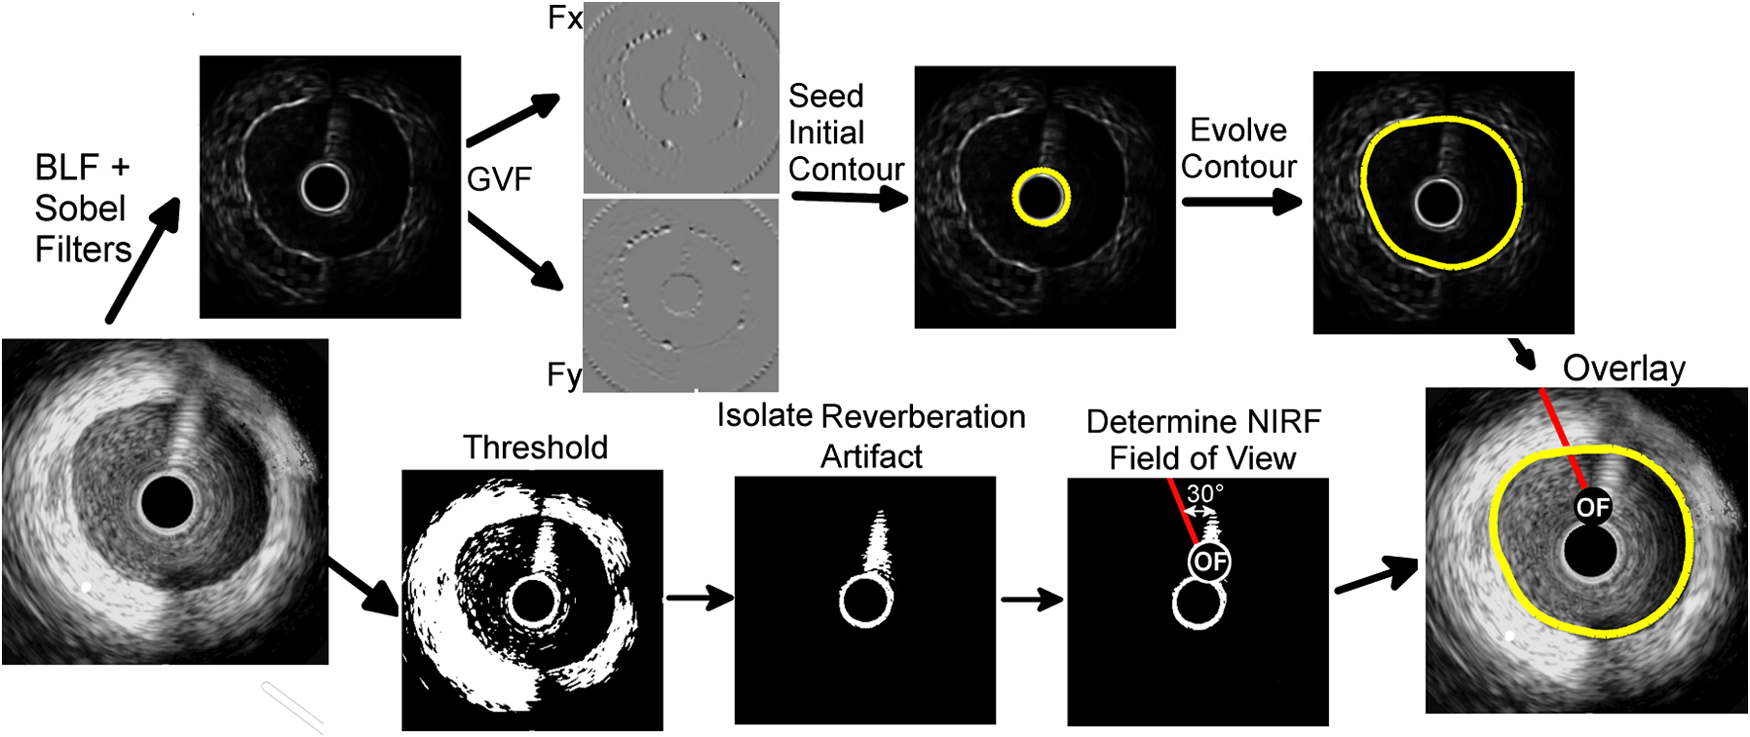 The location of the optical fiber was automatically determined through a series of thresholding steps that segmented the acoustic reverberation artifact caused by the optical fiber from the dark background of the blood-filled vessel. NIRF catheter-to-vessel wall distances were measured, automatically, by finding the intersection of the contour outlining the vessel wall and the line depicting the NIRF field-of-view. 2.6.Ex Vivo Artery StudiesEx vivo porcine carotid arteries, ranging in size between 3 and 5 mm in internal diameter, were acquired from a local abattoir. The arteries were harvested proximal to the carotid bifurcation and were immediately stored in a physiological saline solution at 4°C.38 DiR (100 μM) was applied to one section of the vessel wall to simulate a nonuniform fluorescent target within each artery. DiR was selected for use in this study due to its low toxicity and propensity to integrate directly into cell membranes without migrating from cell to cell.39 Thus, once applied to a specific region of the vessel, DiR does not disperse to label other sections of the vessel. Furthermore, the quantum yield of DiR significantly increases following incorporation into lipid bilayers which ensures low background fluorescence from DiR that may have remained in solution following staining. Carbocyanine dyes, like DiR, have been used extensively in preclinical animal models, and DiR exhibits comparable fluorescence excitation and emission spectra to indocyanine green, an FDA approved fluorophore.39–41 NIRF-IVUS measurements were acquired at multiple axial positions along the length of each artery to simulate a catheter pull-back procedure. Following NIRF-IVUS imaging, each artery was cut open and laid flat on a microscope slide (en face). En face fluorescence microscopy images of the inner vessel wall supplied relative estimates of local fluorophore spatial distributions within the artery. Accurate registration of fluorescence microscopy images and NIRF-IVUS catheter measurements was achieved by using needles to mark axial locations where NIRF-IVUS imaging was performed. 3.Results3.1.NIRF-IVUS Phantom StudiesFour parameters must be determined to model light attenuation through blood using Eq. (1) (, , , and ). Values of used to model hemoglobin absorption at 750 nm (excitation) and 780 nm (fluorescent emission) are shown in Table 1 and are derived from measurements made by Cope.28 Estimates of and , from Eq. (1), were determined by measuring the transmission of 750 nm light through blood at three hematocrit levels (0.40, 0.45, and 0.50) and fitting the results to Eq. (1) via least-squares optimization. In the fitting process, it was assumed that the value of ranged between 0 and 0.2, as broadly describes the fraction of scattered photons that are received by the NIRF optical fiber and has be previously shown to fall within this range.25–27 The value of was allowed to assume any nonnegative value and it was assumed that the values of and did not vary within the narrow wavelength range considered in this work. Table 1Parameters for model fit to Eq. (1).
Similarly, the transmission of 750 nm light was measured through the tissue-mimicking medium. Values of , , and , for the tissue-mimicking phantom, were taken from the literature33 and resulted in a theoretical value of for . The experimentally determined value of as calculated by Beer’s Law () was . Four known concentrations of DiR, in the tissue-mimicking medium, were imaged with the NIRF-IVUS catheter through three different whole blood samples with fractional hematocrits of 0.40, 0.45, and 0.50. NIRF measurements were acquired at increasing sensing distances, and the experimental results and light propagation model fits are shown in Fig. 4(a)–4(c) (). NIRF sensing distances were measured manually on IVUS images and resulted in a 3.9% root mean square error (RMSE) when compared to ground-truth sensing distances provided by a calibrated motion stage. The same DiR samples were placed in cuvettes of different thicknesses and were measured from a constant NIRF sensing distance of 500 μm through whole blood with a fractional hematocrit of 0.45. The majority of the fluorescent light was generated within the first 200 μm of the sample. Experimental results and light propagation model fits are shown in Fig. 4(d) (). Fig. 4Light propagation model fits to NIRF measurements from four different concentrations of DiR imaged through whole bovine blood with (a) 0.40, (b) 0.45, and (c) 0.50 fractional hematocrit. The dashed line represents the approximate noise floor of the NIRF instrumentation. (d) Light propagation model fits to NIRF measurements of DiR samples of different thicknesses. (e) Calibration curve (linear fit) derived from experimental NIRF measurements relating model estimates of to known concentrations of DiR. (f) Estimated DiR concentration of a 10 μM sample of DiR imaged through whole bovine blood with 0.45 fractional hematocrit.  A calibration curve showing the relationship between values of estimated by the light propagation model and DiR concentrations sensed through the three different whole blood samples is presented in Fig. 4(e). Values of scaled linearly with increasing DiR concentration between 0.1 μM and 10 μM () and varied only slightly with changes in the fractional hematocrit (differences were not significant, ). The calibration curve was used to map estimates of derived from raw NIRF measurements to DiR concentrations in subsequent vessel phantom experiments. An example result of the concentration estimation procedure is shown in Fig. 4(f). The fluorescence from a 10 μM sample of DiR was measured with the NIRF-IVUS catheter at increasing sensing distances through whole blood with 0.45 fractional hematocrit. Values of were derived by the light propagation model for each data point using the optical parameters that were previously determined. The values of were used to estimate DiR concentrations using the calibration curve in Fig. 4(e). DiR concentrations were estimated with an RMSE of 6.3%. 3.2.NIRF-IVUS Validation in Vessel PhantomsCoregistered NIRF-IVUS imaging was performed in vessel phantoms [Fig. 5(a)] and catheter-to-vessel wall distances for each NIRF acquisition were measured manually on IVUS images. The measured catheter-to-vessel wall distances supplied the value for within Eq. (1) of the light propagation model and the value of was calculated for each NIRF-IVUS measurement taken within the vessel phantom. Fig. 5(a) Axial schematic of the vessel phantom. Whole bovine blood was placed within the 3.1 mm diameter lumen and four different concentrations of DiR were placed in tubes surrounding the vessel lumen. (b) NIRF sensing distances as measured manually on IVUS images for a single 360-deg acquisition within a vessel phantom. (c) Raw fluorescence intensities and estimates of DiR concentration for each fluorescent target within the vessel phantom for the same 360 deg NIRF-IVUS acquisition presented in (b). (d) Estimated concentrations of fluorescent targets within the vessel phantom at three different blood hematocrits. The NIRF correction method resulted in a statistically significant improvement in fluorophore concentration estimates for each concentration tested (). 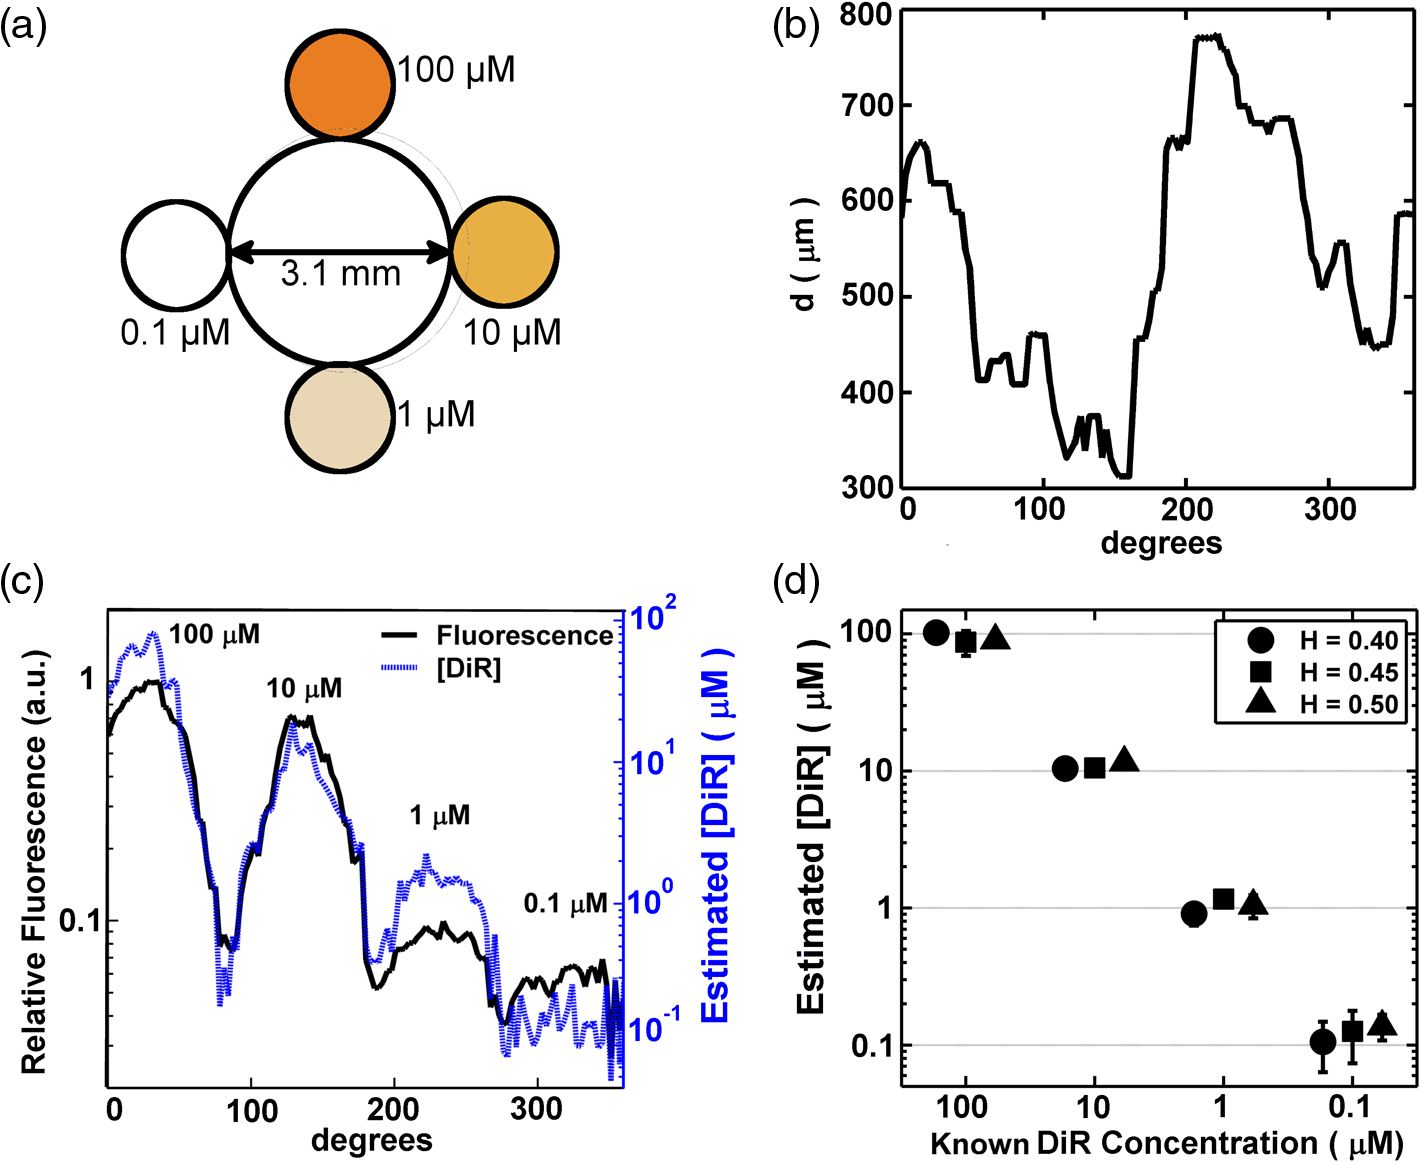 NIRF sensing distances for a complete 360-deg acquisition in the 3.1 mm diameter vessel phantom are shown in Fig. 5(b). The average NIRF sensing distance for the single trial, presented in Fig. 5(b), was 540 μm with a minimum and maximum of 305 and 785 μm, respectively. Minimum and maximum NIRF sensing distances, for all trials performed, were 220 and 1210 μm. Raw fluorescence intensities and estimated fluorophore concentrations, for the same 360-deg acquisition, are presented in Fig. 5(c). Each fluorescent target produced a fluorescence intensity peak with a full-width-half-maximum of approximately 50 deg. A comparison between estimated and known concentrations, for each DiR sample within the vessel phantom, is presented in Fig. 5(d). RMSE for concentration estimates derived by the light propagation model were 16.5, 17.0, 19.0, and 45.4% for the 100, 10, 1, and 0.1 μM DiR samples, respectively. These RMSE values are compiled from all measurements taken through whole blood with hematocrits of 0.40, 0.45, and 0.50. Differences in RMSE, between the three different hematocrit values, were not statistically significant (), thus, demonstrating the ability of the model to correct for variable catheter sensing distances through whole blood with varying hematocrit. Measurements of the 0.1 μM DiR sample were obscured by sensitivity limits of the NIRF instrumentation and were excluded from further analysis. In addition, DiR concentration estimates were made using raw fluorescence intensities by normalizing each uncorrected NIRF measurement to the average fluorescence intensity of the 10 μM DiR sample. RMSE for these concentration estimates with no corrections were 92%, 41.6%, 138%, and 272% for the 100, 10, 1, and 0.1 μM DiR samples, respectively. These large and unpredictable errors are the result of random sensing distances within the vessel phantom which significantly limits the usefulness of conclusions drawn from uncorrected NIRF measurements. 3.3.Fluorescence Estimation in Ex Vivo ArteriesEx vivo arteries were stained with DiR and underwent NIRF-IVUS imaging. Representative results of the automated image processing algorithm are shown in Fig. 6(a). The outline of the vessel wall was generated using an active contours segmentation algorithm and the position of the NIRF optical fiber was determined by tracking its acoustic reverberation artifact.35,37 A comparison of manually and automatically measured NIRF sensing distances is shown in Fig. 6(b) for a single 360 degree NIRF-IVUS acquisition. Average RMSE between manual and automated measurements was 8.2%, which suggests that the proposed NIRF correction can be performed automatically with minimal user interaction. Fig. 6(a) IVUS image of an ex vivo porcine carotid artery with coregistered NIRF overlay. The NIRF optical fiber caused an acoustic reverberation artifact marked by the white arrow. The white double-headed arrow shows the NIRF sensing distance, . Colorbar corresponds to normalized relative fluorescence sensed by NIRF catheter. (b) Comparison between manual and automatic measurement of NIRF sensing distances for a single 360-deg NIRF-IVUS acquisition. (c, d) (top) Two rows, and , of fluorescence microscopy images of an ex vivo artery stained with DiR (). (Bottom) Relative fluorescence intensities measured from fluorescence microscopy and NIRF across rows and .  Coregistered NIRF-IVUS data was acquired from two ex vivo arteries with inner diameters of 3.9 and 4.3 mm. NIRF-IVUS acquisitions were captured at different axial locations along the length of each artery to simulate a pullback procedure. Representative fluorescence microscopy results for two locations in the 3.9 mm artery, and , are shown in Fig. 6(c) and 6(d). Robust DiR staining was localized to approximately one-third of the vessel circumference at depths up to 50 μm, as determined by confocal microscopy. Accordingly, optical parameters of the intima were used to model the vessel wall in the light propagation model (, , ).34 Figure 6(c) and 6(d) shows relative DiR concentrations derived from fluorescence microscopy, uncorrected NIRF, and corrected NIRF measurements for axial locations and . Spatial correlation coefficients between fluorescence microscopy and NIRF estimates of DiR spatial distributions improved from 0.34 to 0.66 for location and from 0.13 to 0.73 for location following correction of the NIRF measurements. Spatial correlation between NIRF and fluorescence microscopy results was assessed for all artery locations examined by the NIRF-IVUS catheter (). Correlation coefficients were transformed into a new variable, the Fisher value, in order to calculate average correlation coefficients and 95% confidence intervals for uncorrected and corrected NIRF measurements.42 The average correlation coefficient between uncorrected NIRF and fluorescence microscopy measurements was 0.24 with a 95% confidence interval between 0.19 and 0.30. The average correlation coefficient between corrected NIRF and fluorescence microscopy measurements was 0.69 with a 95% confidence interval between 0.67 and 0.72. These results demonstrate that correcting NIRF measurements for variable catheter-to-vessel wall sensing distances resulted in a statistically significant improvement (, ) in the correlation between NIRF-IVUS and fluorescence microscopy estimates of local fluorescence intensities in ex vivo arteries. 4.DiscussionA combined NIRF-IVUS catheter was developed to provide intravascular anatomical and molecular imaging of the vessel wall and to determine whether correcting for variable catheter-to-vessel wall sensing distances could improve the accuracy of NIRF measurements. As expected, NIRF imaging sensitivity decreased with increasing blood hematocrit, with maximal sensing distances of the 0.1 μm DiR sample of 1.2 and 0.9 mm at hematocrits of 0.40 and 0.50, respectively. Blood attenuation correction of NIRF measurements acquired beyond these sensitivity limits could not recover accurate fluorophore concentration estimates. This sensitivity is in good agreement with other NIRF imaging catheters described in the literature, but it should be noted that detection sensitivity is also modulated by varying optical properties of the vessel wall tissue, which was not explored in this work.15,43 The least-squares optimization routine resulted in a good fit of Eqs. (1) and (2) to the experimental data (), but because the system is over-determined, the solution used in this work is not unique. However, the solution provided an accurate fit to blood attenuation across three hematocrit levels and enabled accurate blood attenuation correction in the phantom studies. An advantage of the analytical light propagation model over Monte Carlo-based approaches is that the analytical model can estimate relative fluorophore concentrations from NIRF data in real-time during a catheterization procedure. While a Monte Carlo formulation may improve the accuracy of light attenuation estimates, it is not capable of producing real-time results on the standard computer hardware typically employed within catheterization laboratories. Model-based correction of NIRF concentration estimates in vessel phantoms reduced average RMSE from 90.5% to 17.5%, comparing well to the results of other analytical models cited in the literature. Diffusion models of light propagation have demonstrated average RMSE between 5% and 25% when measuring fluorescence from tissue-mimicking phantoms, and a similar 1-D formulation demonstrated less than 10% RMSE when assessing fluorescence from epithelial and stromal tissues within the human cervix.29,31,32,44 A limitation of these approaches is the reliance on a priori knowledge of the optical properties of the tissues being studied. The attenuation of whole blood can be measured prior to an imaging procedure, but the optical properties of the vessel wall cannot. Nevertheless, significant effort has been devoted to modeling the optical characteristics of both whole blood and atherosclerotic lesions.34,45–48 Furthermore, a variety of techniques for quantitatively measuring fluorophore concentrations, with and without a priori knowledge of tissue optical properties, have been developed for noncatheter based applications. However, it remains to be seen whether these methods are compatible with intravascular imaging through blood and whether they can be integrated into the small form factor of a catheter.49–56 As demonstrated in Fig. 6, the model-based corrections resulted in a statistically significant improvement in fluorophore spatial distribution estimates in ex vivo arteries when compared to relative fluorescence as measured by fluorescence microscopy. While fluorescence microscopy does not provide a quantitative measure of local fluorophore concentration, it does provide an independent measure of relative fluorescence that is unaffected by attenuation of intraluminal blood. The accuracy of the model-based correction technique relies upon accurate catheter-to-vessel wall distance measurements derived from IVUS images, which exhibited a 3.9% RMSE in phantom studies, however, they were greater in the ex vivo studies due to inferior delineation of the soft vessel wall. This source of measurement error and possible variation in the optical properties of the vessel wall could be limiting factors that reduced the correlation between the two measures of relative fluorescence. Nevertheless, the model-based blood attenuation correction approach improved the correlation of NIRF measurements to fluorescence microscopy in all samples tested. Temporary vessel occlusion followed by saline flushes or deflection of the catheter towards the vessel wall during NIRF sensing may also improve the accuracy of NIRF measurements, however, neither of these approaches are complete solutions.23,57 Saline flushes are not appropriate for patients who are sensitive to increases in blood volume and precise control of the catheter tip is difficult to achieve in vivo. The approach demonstrated here is not constrained by these limitations and enables new capabilities. First, independent rotation of the IVUS and NIRF elements enables different IVUS and NIRF acquisition speeds. Conventional IVUS catheters are rotated in excess of 1500 rotations per minute to enable real-time imaging and to reduce nonuniform rotational distortion, however, NIRF sensing requires longer, variable exposure times to optimize fluorescence signal-to-noise ratios.49,58 Second, this method of NIRF-IVUS integration does not require significant modifications to existing IVUS instrumentation and can be made more robust through the use of a double lumen catheter. 5.ConclusionsA combined NIRF-IVUS catheter was developed to acquire coregistered molecular and anatomic images of the vessel wall. NIRF-IVUS measurements were corrected for inaccuracies caused by variable catheter-to-vessel wall distances through the use of a light propagation model. The NIRF correction method resulted in an average RMSE of 17.5% when estimating known fluorophore concentrations in vessel phantoms compared to an average RMSE of 90.5% without correction. Furthermore, the NIRF correction method resulted in a statistically significant improvement in correlation between spatially resolved NIRF measurements and known fluorophore distributions in ex vivo arteries (, ). Future studies are required to determine whether such corrections will enable semiquantitative assessment of exogenous NIRF fluorophores targeted to biomarkers associated with atherosclerosis and whether such techniques can inform clinical treatment decisions or aid in the study of disease progression in preclinical models. AcknowledgmentsThe authors would like to thank Dr. William Guilford for assistance with optical design and Dr. Song Hu for careful review of this manuscript. This work was supported in part by the National Institutes of Health NHLBI under Grant No. HL090700 to JAH and Virginia Commonwealth and National Science Foundation Graduate Research Fellowships to AJD. The content is solely the responsibility of the authors and does not necessarily represent the official views of the NIH. ReferencesM. NaghaviE. Falk,
“From Vulnerable Plaque to Vulnerable Patient,”
Asymptomatic Atherosclerosis: Pathophysiology, Detection and Treatment, 13
–38 Humana Press, Totowa, New Jersey
(2010). Google Scholar
Z. A. FayadV. Fuster,
“Clinical imaging of the high-risk or vulnerable atherosclerotic plaque,”
Circ. Res., 89
(4), 305
–316
(2001). http://dx.doi.org/10.1161/hh1601.095596 CIRUAL 0009-7330 Google Scholar
M. Takanoet al.,
“In vivo comparison of optical coherence tomography and angioscopy for the evaluation of coronary plaque characteristics,”
Am. J. Cardiol., 101
(4), 471
–476
(2008). http://dx.doi.org/10.1016/j.amjcard.2007.09.106 AJNCE4 0258-4425 Google Scholar
J. A. Schaaret al.,
“Characterizing vulnerable plaque features with intravascular elastography,”
Circulation, 108
(21), 2636
–2641
(2003). http://dx.doi.org/10.1161/01.CIR.0000097067.96619.1F CIRCAZ 0009-7322 Google Scholar
P. R. Morenoet al.,
“Detection of lipid pool, thin fibrous cap, and inflammatory cells in human aortic atherosclerotic plaques by near-infrared spectroscopy,”
Circulation, 105
(8), 923
–927
(2002). http://dx.doi.org/10.1161/hc0802.104291 CIRCAZ 0009-7322 Google Scholar
A. Nairet al.,
“Coronary plaque classification with intravascular ultrasound radiofrequency data analysis,”
Circulation, 106
(17), 2200
–2206
(2002). http://dx.doi.org/10.1161/01.CIR.0000035654.18341.5E CIRCAZ 0009-7322 Google Scholar
H. Yabushitaet al.,
“Characterization of human atherosclerosis by optical coherence tomography,”
Circulation, 106
(13), 1640
–1645
(2002). http://dx.doi.org/10.1161/01.CIR.0000029927.92825.F6 CIRCAZ 0009-7322 Google Scholar
C. L. de Korteet al.,
“Characterization of plaque components with intravascular ultrasound elastography in human femoral and coronary arteries in vitro,”
Circulation, 102
(6), 617
–623
(2000). http://dx.doi.org/10.1161/01.CIR.102.6.617 CIRCAZ 0009-7322 Google Scholar
A. Katouzianet al.,
“Challenges in atherosclerotic plaque characterization with intravascular ultrasound (IVUS): from data collection to classification,”
IEEE Trans. Inform. Technol. Biomed., 12
(3), 315
–327
(2008). http://dx.doi.org/10.1109/TITB.2007.912352 ITIBFX 1089-7771 Google Scholar
J. Yinet al.,
“Novel combined miniature optical coherence tomography ultrasound probe for in vivo intravascular imaging,”
J. Biomed. Opt., 16
(6), 060505
(2011). http://dx.doi.org/10.1117/1.3589097 JBOPFO 1083-3668 Google Scholar
F. D. Kolodgieet al.,
“Localization of apoptotic macrophages at the site of plaque rupture in sudden coronary death,”
Am. J. Pathol., 157
(4), 1259
–1268
(2000). http://dx.doi.org/10.1016/S0002-9440(10)64641-X AJPAA4 0002-9440 Google Scholar
G. M. Sangiorgiet al.,
“Plaque vulnerability and related coronary event prediction by intravascular ultrasound with virtual histology: ‘it’s a long way to tipperary’?,”
Catheter. Cardiovasc. Interv., 70
(2), 203
–210
(2007). http://dx.doi.org/10.1002/(ISSN)1522-726X 1522-1946 Google Scholar
A. B. KarpioukB. WangS. Y. Emelianov,
“Development of a catheter for combined intravascular ultrasound and photoacoustic imaging,”
Rev. Sci. Instrum., 81
(1), 014901
(2010). http://dx.doi.org/10.1063/1.3274197 RSINAK 0034-6748 Google Scholar
C. M. Gardneret al.,
“Detection of lipid core coronary plaques in autopsy specimens with a novel catheter-based near-infrared spectroscopy system,”
JACC Cardiovasc. Imag., 1
(5), 638
–648
(2008). http://dx.doi.org/10.1016/j.jcmg.2008.06.001 1936-878X Google Scholar
F. A. Jafferet al.,
“Two-dimensional intravascular near-infrared fluorescence molecular imaging of inflammation in atherosclerosis and stent-induced vascular injury,”
J. Am. Coll. Cardiol., 57
(25), 2516
–2526
(2011). http://dx.doi.org/10.1016/j.jacc.2011.02.036 JACCDI 0735-1097 Google Scholar
L. Marcuet al.,
“Discrimination of human coronary artery atherosclerotic lipid-rich lesions by time-resolved laser-induced fluorescence spectroscopy,”
Arterioscler. Thromb. Vasc. Biol., 21
(7), 1244
–1250
(2001). http://dx.doi.org/10.1161/hq0701.092091 ATVBFA 1079-5642 Google Scholar
K. Jansenet al.,
“Intravascular photoacoustic imaging of human coronary atherosclerosis,”
Opt. Lett., 36
(5), 597
–599
(2011). http://dx.doi.org/10.1364/OL.36.000597 OPLEDP 0146-9592 Google Scholar
R. Weisslederet al.,
“In vivo imaging of tumors with protease-activated near-infrared fluorescent probes,”
Nat. Biotechnol., 17
(4), 375
–378
(1999). http://dx.doi.org/10.1038/7933 NABIF9 1087-0156 Google Scholar
C. Vinegoniet al.,
“Indocyanine green enables near-infrared fluorescence imaging of lipid-rich, inflamed atherosclerotic plaques,”
Sci. Transl. Med., 3
(84), 1
–20
(2011). http://dx.doi.org/10.1126/scitranslmed.3001577 STMCBQ 1946-6242 Google Scholar
F. A. JafferR. Weissleder,
“Molecular imaging in the clinical arena,”
J. Am. Med. Assoc., 293
(7), 855
–862
(2005). http://dx.doi.org/10.1001/jama.293.7.855 JAMAAP 0098-7484 Google Scholar
F. A. Jafferet al.,
“Real-time catheter molecular sensing of inflammation in proteolytically active atherosclerosis,”
Circulation, 118
(18), 1802
–1809
(2008). http://dx.doi.org/10.1161/CIRCULATIONAHA.108.785881 CIRCAZ 0009-7322 Google Scholar
S. Warrenet al.,
“Combined ultrasound and fluorescence spectroscopy for physico-chemical imaging of atherosclerosis,”
IEEE Trans. Biomed. Eng., 42
(2), 121
–132
(1995). http://dx.doi.org/10.1109/10.341824 IEBEAX 0018-9294 Google Scholar
D. N. Stephenset al.,
“Intraluminal fluorescence spectroscopy catheter with ultrasound guidance,”
J. Biomed. Opt., 14
(3), 030505
(2009). http://dx.doi.org/10.1117/1.3146813 JBOPFO 1083-3668 Google Scholar
S. Lianget al.,
“Intravascular atherosclerotic imaging with combined fluorescence and optical coherence tomography probe based on a double-clad fiber combiner,”
J. Biomed. Opt., 17
(7), 070501
(2012). http://dx.doi.org/10.1117/1.JBO.17.7.070501 JBOPFO 1083-3668 Google Scholar
V. Twersky,
“Absorption and multiple scattering by biological suspensions,”
J. Opt. Soc. Am., 60
(8), 1084
–1093
(1970). http://dx.doi.org/10.1364/JOSA.60.001084 JOSAAH 0030-3941 Google Scholar
N. M. AndersonP. Sekelj,
“Light-absorbing and scattering properties of non-haemolysed blood,”
Phys. Med. Biol., 12
(2), 173
–184
(1967). http://dx.doi.org/10.1088/0031-9155/12/2/303 PHMBA7 0031-9155 Google Scholar
J. M. SteinkeA. P. Shepherd,
“Role of light scattering in whole blood oximetry,”
IEEE Trans. Biomed. Eng., 33
(3), 294
–301
(1986). http://dx.doi.org/10.1109/TBME.1986.325713 IEBEAX 0018-9294 Google Scholar
M. Cope,
“The application of near infrared spectroscopy to non invasive monitoring of cerebral oxygenation in the newborn infant,”
316
–323 University College London,
(1991). Google Scholar
J. WuM. S. FeldR. P. Rava,
“Analytical model for extracting intrinsic fluorescence in turbid media,”
Appl. Opt., 32
(19), 3585
–3595
(1993). http://dx.doi.org/10.1364/AO.32.003585 APOPAI 0003-6935 Google Scholar
A. Ishimaru,
“Diffusion of light in turbid material,”
Appl. Opt., 28
(12), 2210
–2215
(1989). http://dx.doi.org/10.1364/AO.28.002210 APOPAI 0003-6935 Google Scholar
S. K. Changet al.,
“Analytical model to describe fluorescence spectra of normal and preneoplastic epithelial tissue: comparison with Monte Carlo simulations and clinical measurements,”
J. Biomed. Opt., 9
(3), 511
–522
(2004). http://dx.doi.org/10.1117/1.1695559 JBOPFO 1083-3668 Google Scholar
K. R. DiamondM. S. PattersonT. J. Farrell,
“Quantification of fluorophore concentration in tissue-simulating media by fluorescence measurements with a single optical fiber,”
Appl. Opt., 42
(13), 2436
–2442
(2003). http://dx.doi.org/10.1364/AO.42.002436 APOPAI 0003-6935 Google Scholar
J. R. CookR. R. BouchardS. Y. Emelianov,
“Tissue-mimicking phantoms for photoacoustic and ultrasonic imaging,”
Biomed. Opt. Express, 2
(11), 3193
–3206
(2011). http://dx.doi.org/10.1364/BOE.2.003193 BOEICL 2156-7085 Google Scholar
M. Keijzeret al.,
“Fluorescence spectroscopy of turbid media: autofluorescence of the human aorta,”
Appl. Opt., 28
(20), 4286
–4292
(1989). http://dx.doi.org/10.1364/AO.28.004286 APOPAI 0003-6935 Google Scholar
M. Kasset al.,
“Snakes: active contour models,”
Int. J. Comput. Vis., 1
(4), 321
–331
(1988). http://dx.doi.org/10.1007/BF00133570 IJCVEQ 0920-5691 Google Scholar
L. AlvarezP.-L. LionsJ.-M. Morel,
“Image selective smoothing and edge detection by nonlinear diffusion. II,”
SIAM J. Numer. Anal., 29
(3), 845
–866
(1992). http://dx.doi.org/10.1137/0729052 SJNAEQ 0036-1429 Google Scholar
C. XuJ. L. Prince,
“Snakes, shapes, and gradient vector flow,”
IEEE Trans. Image Process., 7
(3), 359
–369
(1998). http://dx.doi.org/10.1109/83.661186 Google Scholar
A. V. Patilet al.,
“A real-time technique for improving molecular imaging and guiding drug delivery in large blood vessels: in vitro and ex vivo results,”
Mol. Imaging, 10
(4), 238
–247
(2011). http://dx.doi.org/10.2310/7290.2011.00002 MIOMBP 1535-3508 Google Scholar
Y. Liet al.,
“Direct labeling and visualization of blood vessels with lipophilic carbocyanine dye DiI,”
Nat. Protoc., 3
(11), 1703
–1708
(2008). http://dx.doi.org/10.1038/nprot.2008.172 NPARDW 1750-2799 Google Scholar
L. C. Phillipset al.,
“Focused ultrasound-mediated drug delivery from microbubbles reduces drug dose necessary for therapeutic effect on neointima formation—brief report,”
Arterioscler. Thromb. Vasc. Biol., 31
(12), 2853
–2855
(2011). http://dx.doi.org/10.1161/ATVBAHA.111.238170 ATVBFA 1079-5642 Google Scholar
I. Texieret al.,
“Cyanine-loaded lipid nanoparticles for improved in vivo fluorescence imaging,”
J. Biomed. Opt., 14
(5), 054005
(2009). http://dx.doi.org/10.1117/1.3213606 JBOPFO 1083-3668 Google Scholar
R. R. SokalF. J. Rohlf, Biometry, 551
–602 4th ed.W. H. Freeman, New York
(2012). Google Scholar
M. A. Calfonet al.,
“Intravascular near-infrared fluorescence molecular imaging of atherosclerosis: toward coronary arterial visualization of biologically high-risk plaques,”
J. Biomed. Opt., 15
(1), 011107
(2010). http://dx.doi.org/10.1117/1.3280282 JBOPFO 1083-3668 Google Scholar
K. R. DiamondT. J. FarrellM. S. Patterson,
“Measurement of fluorophore concentrations and fluorescence quantum yield in tissue-simulating phantoms using three diffusion models of steady-state spatially resolved fluorescence,”
Phys. Med. Biol., 48
(24), 4135
–4149
(2003). http://dx.doi.org/10.1088/0031-9155/48/24/011 PHMBA7 0031-9155 Google Scholar
A. Rogganet al.,
“Optical properties of circulating human blood in the wavelength range 400–2500 nm,”
J. Biomed. Opt., 4
(1), 36
–46
(1999). http://dx.doi.org/10.1117/1.429919 JBOPFO 1083-3668 Google Scholar
M. Meinkeet al.,
“Optical properties of platelets and blood plasma and their influence on the optical behavior of whole blood in the visible to near infrared wavelength range,”
J. Biomed. Opt., 12
(1), 014024
(2007). http://dx.doi.org/10.1117/1.2435177 JBOPFO 1083-3668 Google Scholar
G. van Soestet al.,
“Atherosclerotic tissue characterization in vivo by optical coherence tomography attenuation imaging,”
J. Biomed. Opt., 15
(1), 011105
(2010). http://dx.doi.org/10.1117/1.3280271 JBOPFO 1083-3668 Google Scholar
F. J. van der Meeret al.,
“Localized measurement of optical attenuation coefficients of atherosclerotic plaque constituents by quantitative optical coherence tomography,”
IEEE Trans. Med. Imaging, 24
(10), 1369
–1376
(2005). http://dx.doi.org/10.1109/TMI.2005.854297 ITMID4 0278-0062 Google Scholar
R. Upadhyayet al.,
“Quantitative real-time catheter-based fluorescence molecular imaging in mice,”
Radiology, 245
(2), 523
–531
(2007). http://dx.doi.org/10.1148/radiol.2452061613 RADLAX 0033-8419 Google Scholar
R. A. Shethet al.,
“Quantitative endovascular fluorescence-based molecular imaging through blood of arterial wall inflammation,”
Radiology, 251
(3), 813
–821
(2009). http://dx.doi.org/10.1148/radiol.2513081450 RADLAX 0033-8419 Google Scholar
P. A. Valdéset al.,
“Quantitative, spectrally-resolved intraoperative fluorescence imaging,”
Sci. Rep., 2 798
(2012). http://dx.doi.org/10.1038/srep00798 SRCEC3 2045-2322 Google Scholar
P. A. Valdeset al.,
“Quantitative fluorescence in intracranial tumor: implications for ALA-induced PplX as an intraoperative biomarker,”
J. Neurosurg., 115
(1), 11
–17
(2011). http://dx.doi.org/10.3171/2011.2.JNS101451 JONSAC 0022-3085 Google Scholar
R. B. Saageret al.,
“Quantitative fluorescence imaging of protoporphyrin IX through determination of tissue optical properties in the spatial frequency domain,”
J. Biomed. Opt., 16
(12), 126013
(2011). http://dx.doi.org/10.1117/1.3665440 JBOPFO 1083-3668 Google Scholar
R. S. BradleyM. S. Thorniley,
“A review of attenuation correction techniques for tissue fluorescence,”
J. R. Soc. Interface, 3
(6), 1
–13
(2006). http://dx.doi.org/10.1098/rsif.2005.0066 1742-5689 Google Scholar
D. E. Hydeet al.,
“A diffusion theory model of spatially resolved fluorescence from depth-dependent fluorophore concentrations,”
Phys. Med. Biol., 46
(2), 369
–383
(2001). http://dx.doi.org/10.1088/0031-9155/46/2/307 PHMBA7 0031-9155 Google Scholar
E. Hullet al.,
“Noninvasive, optical detection of diabetes: model studies with porcine skin,”
Opt. Express, 12
(19), 4496
–4510
(2004). http://dx.doi.org/10.1364/OPEX.12.004496 OPEXFF 1094-4087 Google Scholar
J. G. Fujimotoet al.,
“High resolution in vivo intra-arterial imaging with optical coherence tomography,”
Heart, 82
(2), 128
–133
(1999). http://dx.doi.org/10.1136/hrt.82.2.128 1355-6037 Google Scholar
E. M. TuzcuO. BayturanS. Kapadia,
“Invasive imaging: coronary intravascular ultrasound: a closer view,”
Heart, 96
(16), 1318
–1324
(2010). http://dx.doi.org/10.1136/hrt.2009.178434 1355-6037 Google Scholar
|


