
|
|
1.IntroductionBreast cancer is one of the most common types of cancers in the United States, with the projected number of new cases for 2012 estimated at 226,870 in women and 2190 in men; the projected number of deaths among these patients is estimated at 39,920.1 Based on the wide occurrence of this disease, it is imperative that a quick and reliable method for the early detection and diagnosis of cancer circulating cells be identified and tested. The most commonly used breast cancer detection method is the collection of mammography images. However, these images can suffer from relatively low sensitivity in discriminating between benign and malignant tumors. As a result, they function best as a screening tool, rather than a detection and diagnostic tool.2 Additionally, breast biopsies generally require surgical intervention. The entire biopsy process hinges on choosing the proper sample for diagnosis, and it may have to be repeated several times to confirm the final results. The development of a malignant tumor is relatively difficult to detect in its early stages, often taking several years to confirm clinically. In order to reduce cancer mortality rates, methods that are reliable, sensitive and highly specific and provide precise information in the early stages of malignancy must be developed to identify tumor markers. Furthermore, the clinical assay should reveal the stage of cancer to determine what treatment should be followed and to monitor the treatment progression. However, there are currently no clinical assays providing 100% accurate results. Despite extensive research that describes promising new methods and biochemical markers for the early detection of cancer cells, none have sufficient sensitivity to detect cancer in its earliest stages.3 Cancer cells have a tendency to spread to other organs through the bloodstream or lymphatic system. These cells that circulate via the bloodstream are known as circulating tumor cells (CTC). In the past, CTCs were thought to spread only during the final stages of malignant progression.4 However, recent research has demonstrated that CTCs also can be found in the bloodstream during early stages.5 Consequently, the detection and quantification of CTCs have become major goals of many research efforts. The detection of CTCs and their extent would provide very important information about the aggressiveness of a tumor, how well patients are responding to treatment, and why some patients do not respond to a specific therapy. Cancer studies have recently identified the possibly significant role that the epithelial cell adhesion molecule (EpCAM) plays in cancer biology, given the fact that it is overexpressed on the surface of many epithelial tumor cells and can be targeted by using anti-EpCAM antibodies.6 EpCAM is associated with all types of epithelial cells, and approximately 90% of human cancer cells are known to originate from epithelial tissues.7,8 The covalent and noncovalent attachment of nanomaterials to a specific targeting agent, such as antibodies and receptors for targeting cancer cells, are promising methods that are being developed for the identification, prevention, and treatment of a variety of diseases, including cancer. These targeting nano-agents are used in various aspects of oncology, including therapy and diagnostics, and there are approximately 120 clinical assays using nano-agent formulations under evaluation.9 Among these nanosystems, the carbon nanotubes (CNT) form a class of nanomaterials that have unique electrical, mechanical, structural, and optical features.10 These properties make CNTs promising for many biological and medical applications, such as biomarkers, biosensors, and drug delivery materials. Raman spectra arise from the vibrational frequencies of molecules that depend directly on molecular structure, thereby providing a molecular fingerprint that is valuable in all aspects of materials chemistry. Raman spectroscopy is a versatile technique requiring little or no sample preparation and allowing analysis in virtually every physical state. Continuing advances in Raman instrumentation have dramatically increased the ability to detect weak Raman signals, making it possible to study chemical systems that generally yield unusually weak Raman signals. Recently, Raman spectroscopy and surface-enhanced Raman spectroscopy have been used for detecting and imaging various types of cancer cells.11 In this paper, covalent anti-EpCAM-SWCNT complexes are developed and proposed as high-sensitivity Raman nano-agents for the detection and discrimination of cancer cells from normal cells. The prepared nano-agents can detect single cancer cells from among thousands of normal cells within 30 min of the targeting process. The targeting/detection complex is prepared by mixing anti-EpCAM antibody with surface-functionalized single-walled carbon nanotubes (SWCNT) and is characterized using a transmission electron microscope (TEM) and Raman spectroscopy. Human breast cancer cells (MCF-7) and normal fibroblast cells are used in this study as the detection/targeting model in order to simulate the presence of CTCs among normal cells, as shown in Fig. 1. Fig. 1Diagram of Raman nano-agent anti-epithelial cell adhesion molecule (EpCAM)-single-walled carbon nanotube (SWCNT) molecules’ specific targeting of MCF-7 cells and the Raman signal generated from SWCNTs attached on the cell surface membrane for cancer cell detection. The actual molecular and cellular sizes are different.  2.Experimental Method2.1.Preparation of SWCNTsA chemical vapor deposition method was utilized to synthesize SWCNTs. In this method, methane gas was used as the carbon source; Fe-Co/MgO was used as the catalyst; and a radio-frequency source (Pillar MK 20, 350 kHz) was used to heat the reaction chamber to 850°C. Prepared SWCNTs were purified extensively by using HCl () with sonication for 30 min. They were then stirred with acid overnight in order to remove catalyst residues. The SWCNTs were then filtered under vacuum and washed with distilled water several times until the pH of the supernatant became neutral. After the first step of purification, there were several impurities that had to be removed, such as amorphous carbon and catalyst residues. Therefore, another purification step was conducted. The prepared SWCNTs were dried at 120°C, heated at until reaching a temperature of 450°C, and held constant for 15 min to burn amorphous carbon and oxidize the catalyst impurities. After this thermal treatment, another washing process with HCl was performed to remove the residual catalyst oxides. Finally, the prepared SWCNTs were filtered and washed again as described in the first step.12 2.2.Preparation of Anti-EpCAM-SWCNT ComplexAnti-EpCAM antibodies were purchased from Millipore. In order to associate the SWCNTs with the anti-EpCAM molecules, they must be functionalized with carboxyl (-COOH) groups along the SWCNT body. As a result, the following process was performed according to the literature.13,14 SWCNTs were oxidized by sonication of a certain amount with for about 4 h and then washed and filtered thoroughly to remove any acid residues. Then 10 mg of prepared, functionalized SWCNTs (f-SWCNTs) were resuspended with 25 ml of deionized water. Next, 5 ml of were added to adjust the pH to 6.8. In order to bind SWCNTs covalently with anti-EpCAM proteins, the f-SWCNTs were esterified with -hydroxysuccinimide (NHS) and -ethyl--(3-dimethylaminopropyl) carbodiimide hydrochloride (EDC) as described previously. After that, 9 mg of NHS esterified CNTs were resuspended in 25 ml of (pH 7.4), and 0.75 ml of solution of anti-EpCAM antibodies were added and mixed at 0°C for 4 h. At each 1-h interval, the suspension was sonicated for 5 min. The resulting suspension was centrifuged (15,000 rpm) and washed with four times. The remaining precipitate was collected as anti-EpCAM-SWCNT complex. 2.3.Transmission Electron MicroscopyTEM images were collected on a field emission JEM-2100F TEM (JEOL USA, Peabody, Massachusetts) equipped with a CCD camera. The acceleration voltage was 80 kV for the SWCNT and EpCAM-CNT complex analysis. The SWCNT samples were homogeneously dispersed in 2-propanol under ultra-sonication for 30 min. Next, a few drops of the suspension were deposited on the TEM grid, dried, and evacuated before analysis. For the anti-EpCAM-SWCNT complex, a few drops of homogenized water-based solution were deposited on to lacey carbon-coated copper grids, which were then allowed to dry for 15 min and evacuated before analysis. Energy-dispersive x-ray spectroscopy (EDX) elemental analysis was collected under Scanning Electron Microscopy (SEM)-7000F (JEOL USA, Peabody, Massachusetts) with an accelerating voltage of 15 kV and a working distance of 10 mm. The SWCNT sample was mounted on aluminum pins, and the corresponding EDX elemental spectrum and data were obtained. 2.4.UV-Vis-NIRWe ultrasonicated of SWCNT sodium cholate solution in a bath (FS20, Fisher Scientific, Pittsburgh, Pennsylvania) for about 1 h. The suspension was centrifuged for 2 h at 15,000-g speed using a high-revolution centrifuge (Galaxy 16 Microcentrifuge, VWR International, Radnor, Pennsylvania) until a stable SWCNT suspension was formed and kept for subsequent experimentation. A Shimadzu double-beam spectrophotometer UV-3600 (UV-Visible-NIR) was used to record electronic spectra for both the SWCNT solution and the MCF-7 cells PBS suspension (). 2.5.Confocal Raman SpectroscopyRaman spectra were recorded using a Raman spectrometer (Horiba Jobin Yvon LabRam HR800, Edison, New Jersey) occupied by He-Ne laser (17 mW) with wavelength of 633 nm and three Olympus BX-51 lenses with micro-objectives magnitude connected to a Peltier-cooled CCD camera. The spectra were collected using gratings with the same acquisition time. The spectrometer also has a three-dimensional (3-D) () automatic adjustable stage that can map Raman scanning for a specific area at a minimum distance of 1 μm. In all measurements, the Raman spectrometer was calibrated using the Si-Si Raman signal, which is located at a Raman shift. The mixture of normal and cancer cell lines in Eagle’s minimum essential medium (EMEM, ATCC) was incubated on two-well chamber slides at a density of with the presence of of anti-EpCAM-SWCNTs or f-SWCNTs. After a specific incubation time, the cells were fixed using 4% formaldehyde and then washed twice with DI water. After incubation, the Raman spectra were recorded in two forms: mapping and linear scanning with the desired periods of incubation (0, 0.5, and 12 h). 2.6.Cell CultureHuman breast adenocarcinoma (MCF-7) cells were obtained from the American Type Culture Collection and maintained using established procedures. Cells were normally grown in T75 culture flasks (density of ) with Dulbecco’s minimum essential medium (DMEM, ATCC) containing 10% fetal bovine serum (FBS), 1% penicillin (), and streptomycin () at 37°C in 5% atmosphere and then subcultured by trypsinization for further experiments. The cells were kept in aseptic conditions, and the medium was changed every 48 h. Human normal skin fibroblast (BJ) cells were obtained from the American Type Culture Collection. The cells were maintained in EMEM (ATCC) supplemented with 10% FBS, 1% penicillin (), and 1% streptomycin () and incubated under the same conditions. The medium was changed every three days, and the cells were subcultured by trypsinization before confluence. For the mixture of fibroblast and MCF-7 cells, EMEM medium was used. 2.7.Immunocytochemistry Staining AssayIn order to confirm that the EpCAM was expressed only in cancer cells and not in normal fibroblast cells, the immunocytochemistry (ICC) staining assay was employed. Briefly, both cell lines were incubated in two-well chamber slides at a desired density of filled 90% with fibroblastic BJ cells and 10% with cancerous MCF-7 cells. The mixed cells were incubated for 24 h. After incubation, the cells were washed three times using of phosphate buffer saline solution. We added 200 μl of 4% paraformaldehyde to each well and incubated for 20 min at room temperature for fixation. The paraformaldehyde was removed, and the cells were washed three times with ice cold . Next, 200 μL of blocking buffer ( BSA) was added to each well and incubated for 30 min at room temperature. During the incubation period, a 1:200 solution of anti-EpCAM (Millipore, Billerica, Massachusetts) was prepared using blocking buffer. The blocking buffer was removed, and the diluted anti-EpCAM was added to each well and incubated for 1 h at room temperature. The cells were then washed three times using . The secondary antibody Goat anti-mouse IgG, tetramethylrhodamineisothiocyanate (TRITC)-conjugated (Millipore) was added to each well and incubated for 1 h in the dark at room temperature. The cells were washed twice with , and then 200 μL of 0.5% of 4',6-diamidino-2-phenylindole (DAPI) was added and incubated for 5 min at room temperature in the dark to perform nuclear staining. The cells were washed three times with . To preserve the stained cells, the slide plastic chamber was removed, and a mounting reagent was added. A coverslip was placed over the slide, and the edges were sealed. Finally, the cells were examined under the fluorescence microscope using an Olympus BX 51 microscope. 3.Results and Discussion3.1.Functionalization and Characterization of the Anti-EpCAM-SWCNT Raman Nano-AgentsFigure 2 shows the process by which the anti-EpCAM-SWCNT complex was prepared and used as a Raman nano-agent molecule during the detection and discrimination of cancer cells from normal cells. Fig. 2Diagram showing the functionalization process of SWCNTs in three steps: (1) Carboxylation of SWCNT by adding carboxyl groups, (2) esterification with - carbodiimide hydrochloride (EDC) and (NHS), and (3) amide formation with anti-EpCAM antibody (anti-EpCAM-SWCNT). Anti-EpCAM antibody protein structure was downloaded from the Protein Data Bank ( http://www.rcsb.org/) as a pdb file and restructured with software. 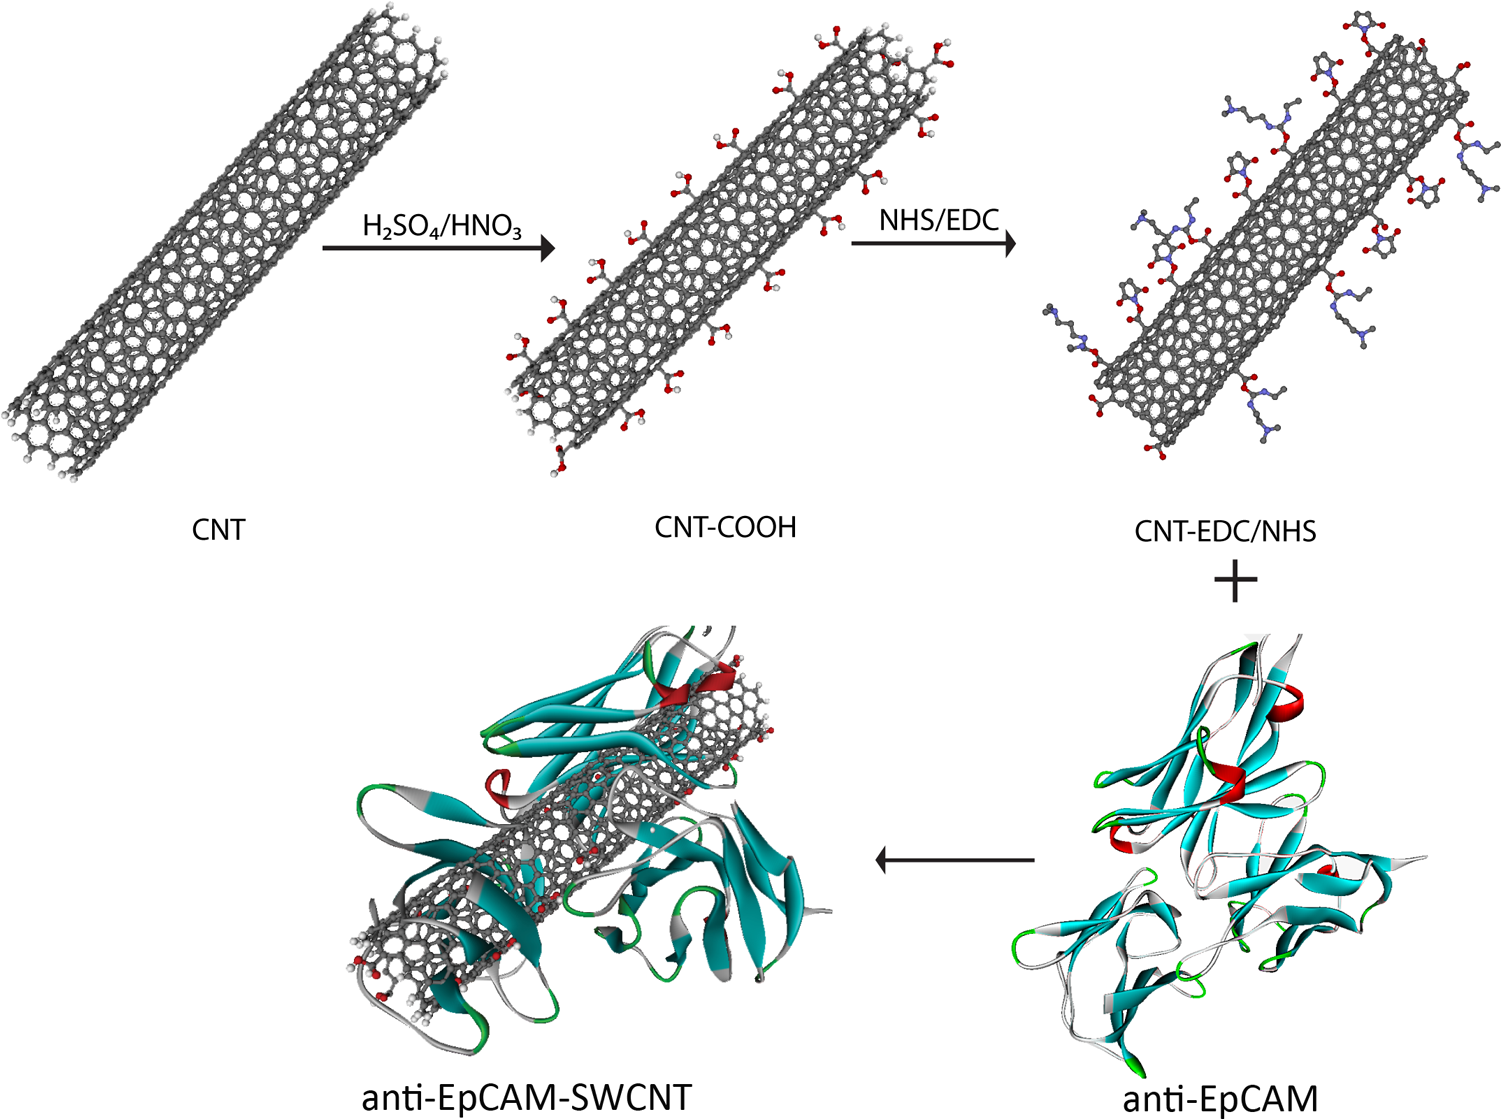 The anti-EpCAM-SWCNT complexes were prepared according to earlier reports13 that the SWCNTs covalently bonded with proteins through the EDC/NHS reaction. SWCNT Raman spectra contain several vibrational modes, depending on the perfection or imperfection of the structural properties alongside the SWCNT body. There are four distinguishing spectral bands that are well known as specific bands for SWCNTs.15–17 These bands are the Radial Breathing Mode at around 150 to , the longitudinal optic or in-plane transverse optic mode (D-band) at around , the Raman active mode for graphite (G-band) at around 1565 to , and the overtone of the D-band (G’-band) at around . In this research, the Raman spectra were recorded based on the G-band only, due to interferences and the low intensity of other bands. The Raman spectra for prepared anti-EpCAM-SWCNT were tested to investigate any possible changes that occurred in the characteristic SWCNT Raman signals, such as elevation of the D-band intensity due to the defect increasing and shifting of the G-band owing to the functionalization groups, as shown in Fig. 3(a). The Raman spectra that were recorded for the complex showed several characteristic bands, starting with the disorder-induced D band at around , then the tangential (G-band) band at , and ending with the overtone of the D-band (G’-band) at around . Fig. 3(a) Raman spectrum for the prepared complex anti-EpCAM-SWCNT nano-agent and prepared SWCNTs showing the characteristic signals corresponding to each of the scattering modes. The spectrum has been baseline-corrected to improve data visualization. (b) UV-visible-NIR spectra for SWCNTs at showing van Hove electronic transitions and breast cancer cells (MCF-7, ) showing little absorption in the scanning range. (c) Transmission electron microscopy (TEM) image for carbon nanotubes (CNT). (d) TEM image for anti-EpCAM-SWCNT at 20 nm.  Another optical characterization was conducted for further confirmation that the MCF-7 cells have no absorption in that range (300 to 1300 nm). UV-visible-NIR spectra, as shown in Fig. 3(b), were also recorded for both SWCNTs and breast cancer cells (MCF-7). The spectra revealed that the cancer cells do not have any kind of absorption range (300 to 1300 nm). However, SWCNTs show strong absorption peaks in this range, due to van Hove electronic transitions,18 which are easily predicted in the Vis-NIR range. The SWCNTs were largely dispersed individually in the solution and had a diameter range of 0.7 to 1.7 nm. The TEM images in Fig. 3(c) and 3(d) demonstrate that the majority of the SWCNTs had an average diameter of 0.7 to 1.7 nm, a length of about 0.3 to 3 μm, and an overall purity higher than 97%, based on the energy-dispersive x-ray spectroscopy elemental analysis. TEM imaging was performed to confirm the EpCAM molecule’s linkage with SWCNTs. Figure 3 shows the SWCNT TEM image before (c) and after (d) the anti-EpCAM molecules were attached on the surface of SWCNTs with different magnifications. (Scale bars are 20 and 100 nm.) These images confirmed the binding of the SWCNTs with anti-EpCAM antibody as presented in Fig. 2. 3.2.Immunocytochemistry StudyTo determine the capacity of anti-EpCAM antibodies to target cancer cells specifically, as well as its ability to distinguish between the two cell lines (MCF-7 and fibroblast), ICC techniques were used based on the overexpression of the EpCAM antigen on the surface of cancer cells and the antigen–antibody interactions. The antibody binding was identified using a secondary antibody labeling method. As shown in Fig. 4, the anti-EpCAM antibody was found to bind selectively to MCF-7 cancer cells (red color) and not to the normal fibroblast cells. Therefore, it could provide a mechanism for the specific delivery of SWCNTs to breast cancer cells only. The bright view image further confirmed that the SWCNTs were selectively attached on the surface of MCF-7 cells (small, rounded cell body), but not the fibroblast cells (elongated cell body), as shown in Fig. 4(d), owing to the fact that EpCAM was highly expressed on the surface of MCF-7. Fig. 4Identification of MCF-7 cells in mixed culture with fibroblast cells. (a) Immunocytochemistry (ICC) staining cells with anti-EpCAM antibody (), followed by goat anti-mouse IgG, TRITC-conjugated secondary antibody. (b) DAPI nuclear staining of both cell lines. (c) Merged images. The arrows indicate the presence of EpCAM antigen localized on the surface of breast cancer cells, and not on the surface of fibroblast cells. This is represented by the formation of a red shell around MCF-7 cells and the absence of any red fluorescence signal from the fibroblast cells. (d) Bright view of MCF-7 and fibroblast cells with DAPI staining, which shows the anti-EpCAM-SWCNT complex attached only on the surface of MCF-7 cells after 0.5-h incubation.  3.3.Targeting MCF-7 Cells by Anti-EpCAM-SWCNT Nano-AgentsThe ultimate goal of this work was to develop a highly sensitive and spectroscopically active system based on anti-EpCAM-SWCNT complexes that would specifically target breast cancer cells. It has been reported previously that SWCNTs have concentration- and coating-dependent cytotoxicity.19,20 The concentration used here showed very little toxicity for the MCF-7 and fibroblast cells. The use of such nano-agents has also been proposed for the early detection and discrimination of cancer cells based on the unique Raman signature of SWCNTs. To prove the efficacy of this approach, MCF-7 breast cancer cells were treated in vitro with anti-EpCAM-SWCNTs and f-SWCNTs for different incubation times: 0.5, 1, 3, 6, 12, and 24 h. For each time point, Raman spectra were collected from randomly selected mono-layered cells. The Raman investigation focused on measuring and mapping (imaging) cancer cells based on the intensity and area of the G-band (), which has the highest intensity and is significantly stronger than signals collected from biological samples.21 The G-band Raman intensity increases proportionately with the concentration of SWCNTs present in the laser’s focal volume. This method has been used previously to map the concentration of SWCNTs present in various biological tissues and determine their clearance rates.21 Our results indicated that the intensity of the SWCNT-specific G-band increased with the incubation time, as shown in Fig. 5. The Raman signal collected from the cancer cells exposed to anti-EpCAM-SWCNT complexes shows the presence of the G-band even after the first 30 min of incubation, which confirms that the receptors (EpCAM molecules) on the surface of the cancer cells were being recognized and bound to the anti-EpCAM-SWCNT complexes. The G-band was approximately 250,000 a.u., while the signal from untreated cancer cells (control, cancer cells only) was 342 a.u. Furthermore, after 6 h, the signal becomes approximately 500,000 a.u. These are increases of to orders of magnitude. However, the f-SWCNTs, which were not specifically delivered to the surface of the cells due to the lack of a specific receptor-ligand activity, were not found to generate a strong enough G-band signal before 3 h of incubation. The signals were more intense after 12 h, at which time the nanoparticles had probably been taken up by the cells due to endocytosis, diffusion, or subsequent adhesive interactions.21,22 Fig. 5Raman intensity (area under curve) corresponding to the various incubation periods of MCF-7 cells with anti-EpCAM-SWCNTs (blue columns) and functionalized SWCNTs (f-SWCNTs) only (green columns), with the presence of of anti-EpCAM-SWCNTs or f-SWCNTs, , point scan detection. MCF-7 cells without anti-EpCAM-SWCNT served as the control. Each measurement was an average of four experiments (). 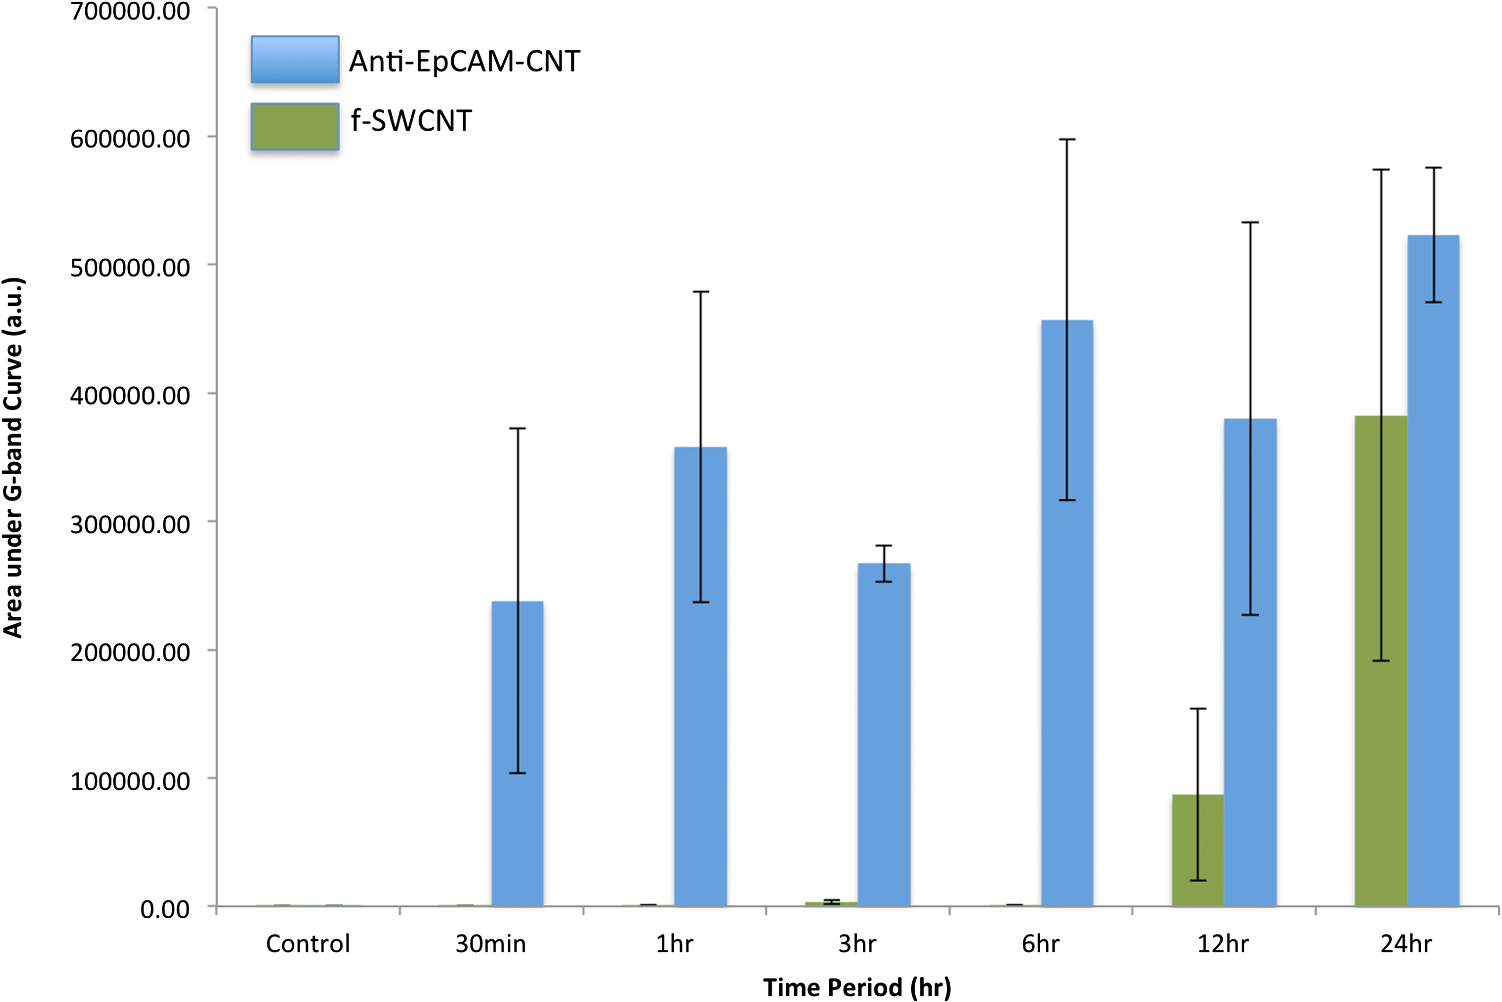 3.4.Detection of Breast Cancer Cells via Raman ImagingEpCAM receptors are highly expressed on the surface of MCF-7 breast cancer cells, but not on the surfaces of normal cells. Fibroblast cells were chosen as a normal cell model to be cocultured along with the breast cancer cells. Fibroblast cells and MCF-7 cells were incubated together for different times (0.5, 1, 3, 6, 12, and 24 h) with both the anti-EpCAM-SWCNT complex and f-SWCNTs. Then a monolayer of these cells was used for Raman spectroscopy imaging based on the intensity of the G-band. The results are shown in Fig. 6. The Raman images clearly indicate that the MCF-7 cells were targeted with anti-EpCAM-SWCNT within the first 30 min, whereas the fibroblast cells did not reveal any Raman signal for this time period. Additionally, the f-SWCNTs revealed a strong signal only at longer incubation times, and there was absolutely no signal available from the cells incubated with these nanomaterials after 30 min, as shown in Fig. 7). These results are in complete agreement with the results shown in the previous section. Fig. 6Raman images based on the two-dimensional mapping of the G-band intensity () for both MCF-7 and fibroblast cells targeted by the anti-EpCAM-SWCNT antibody within 30 min. Contour map (: μm single cell area, : G-band intensity heat map, dimensionless), three-dimensional (3-D) (: μm single cell area, : G-Band intensity heat map, dimensionless), and optical image for scanned cells obtained directly from the Raman spectroscope at measurement time. MCF-7 cells without anti-EpCAM-SWCNT served as the control. 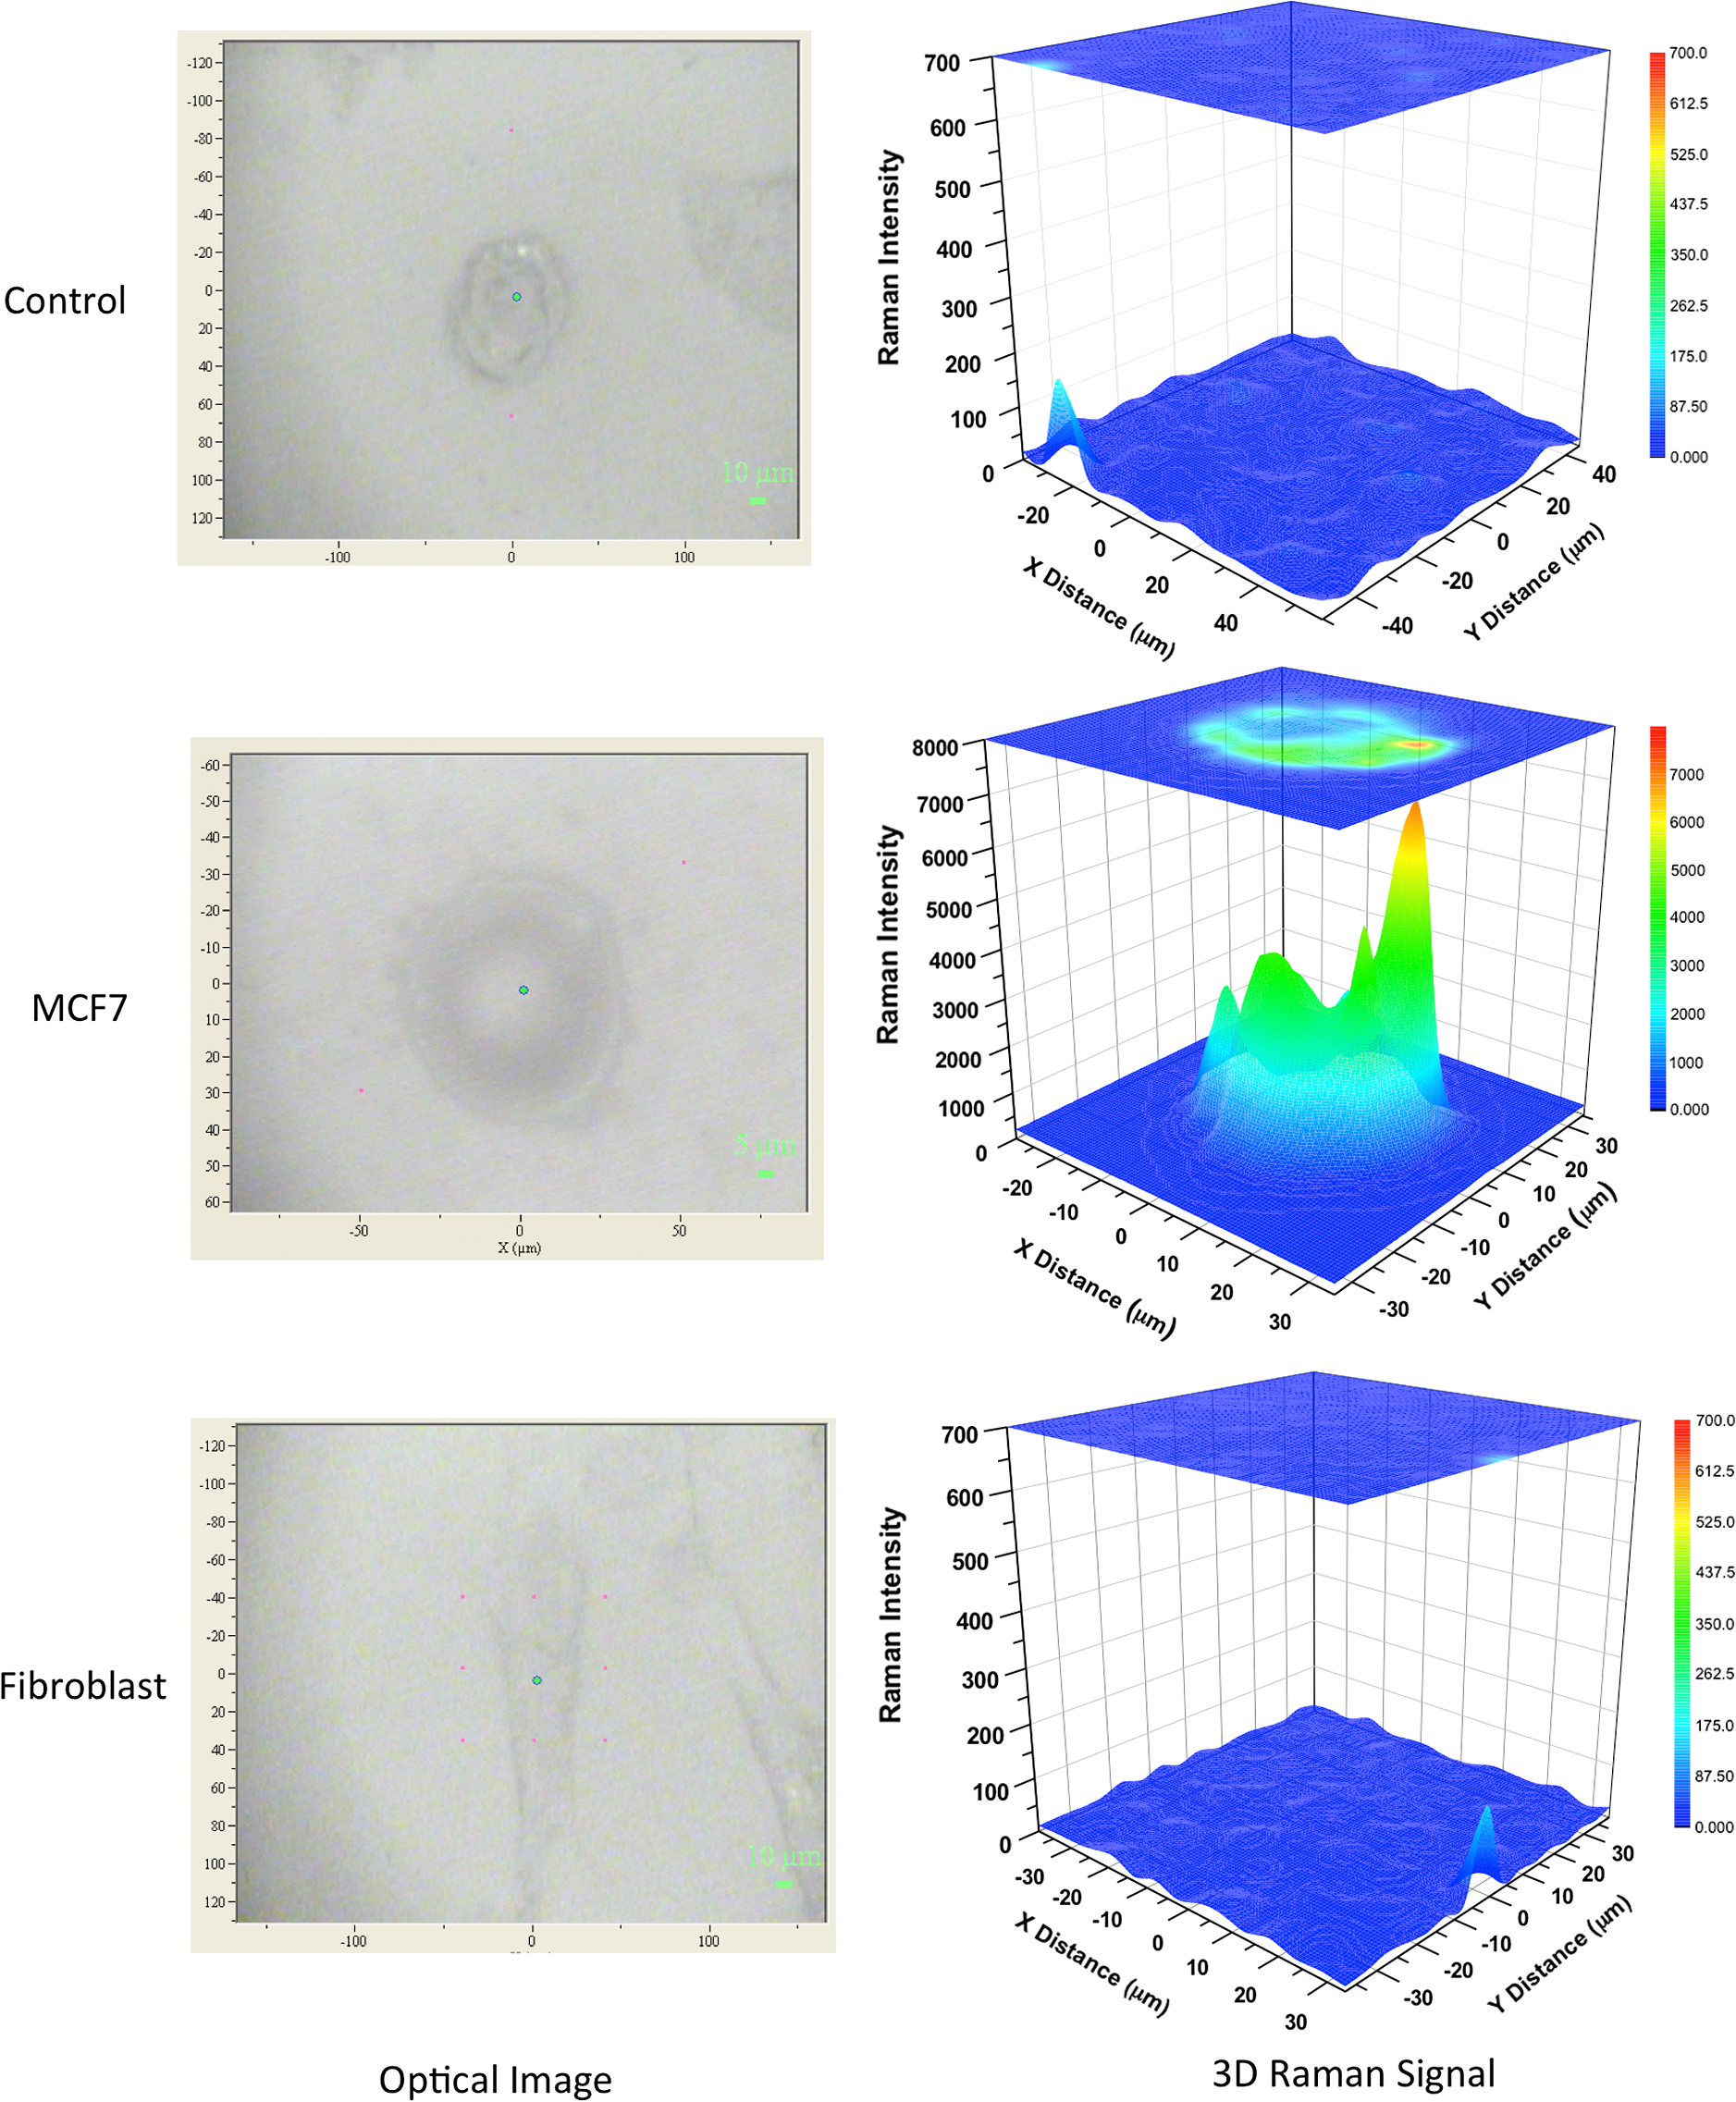 Fig. 7Raman images at G-band intensity () for both MCF-7 and fibroblast cells incubated with of f-SWCNT within 30 min. Contour map (: μm single cell area, : G-band intensity heat map, dimensionless), 3-D (: μm single cell area, : G-Band intensity heat map, dimensionless), and optical image for scanned cells obtained directly from the Raman spectroscope at measurement time. MCF-7 cells without f-SWCNTs served as the control. 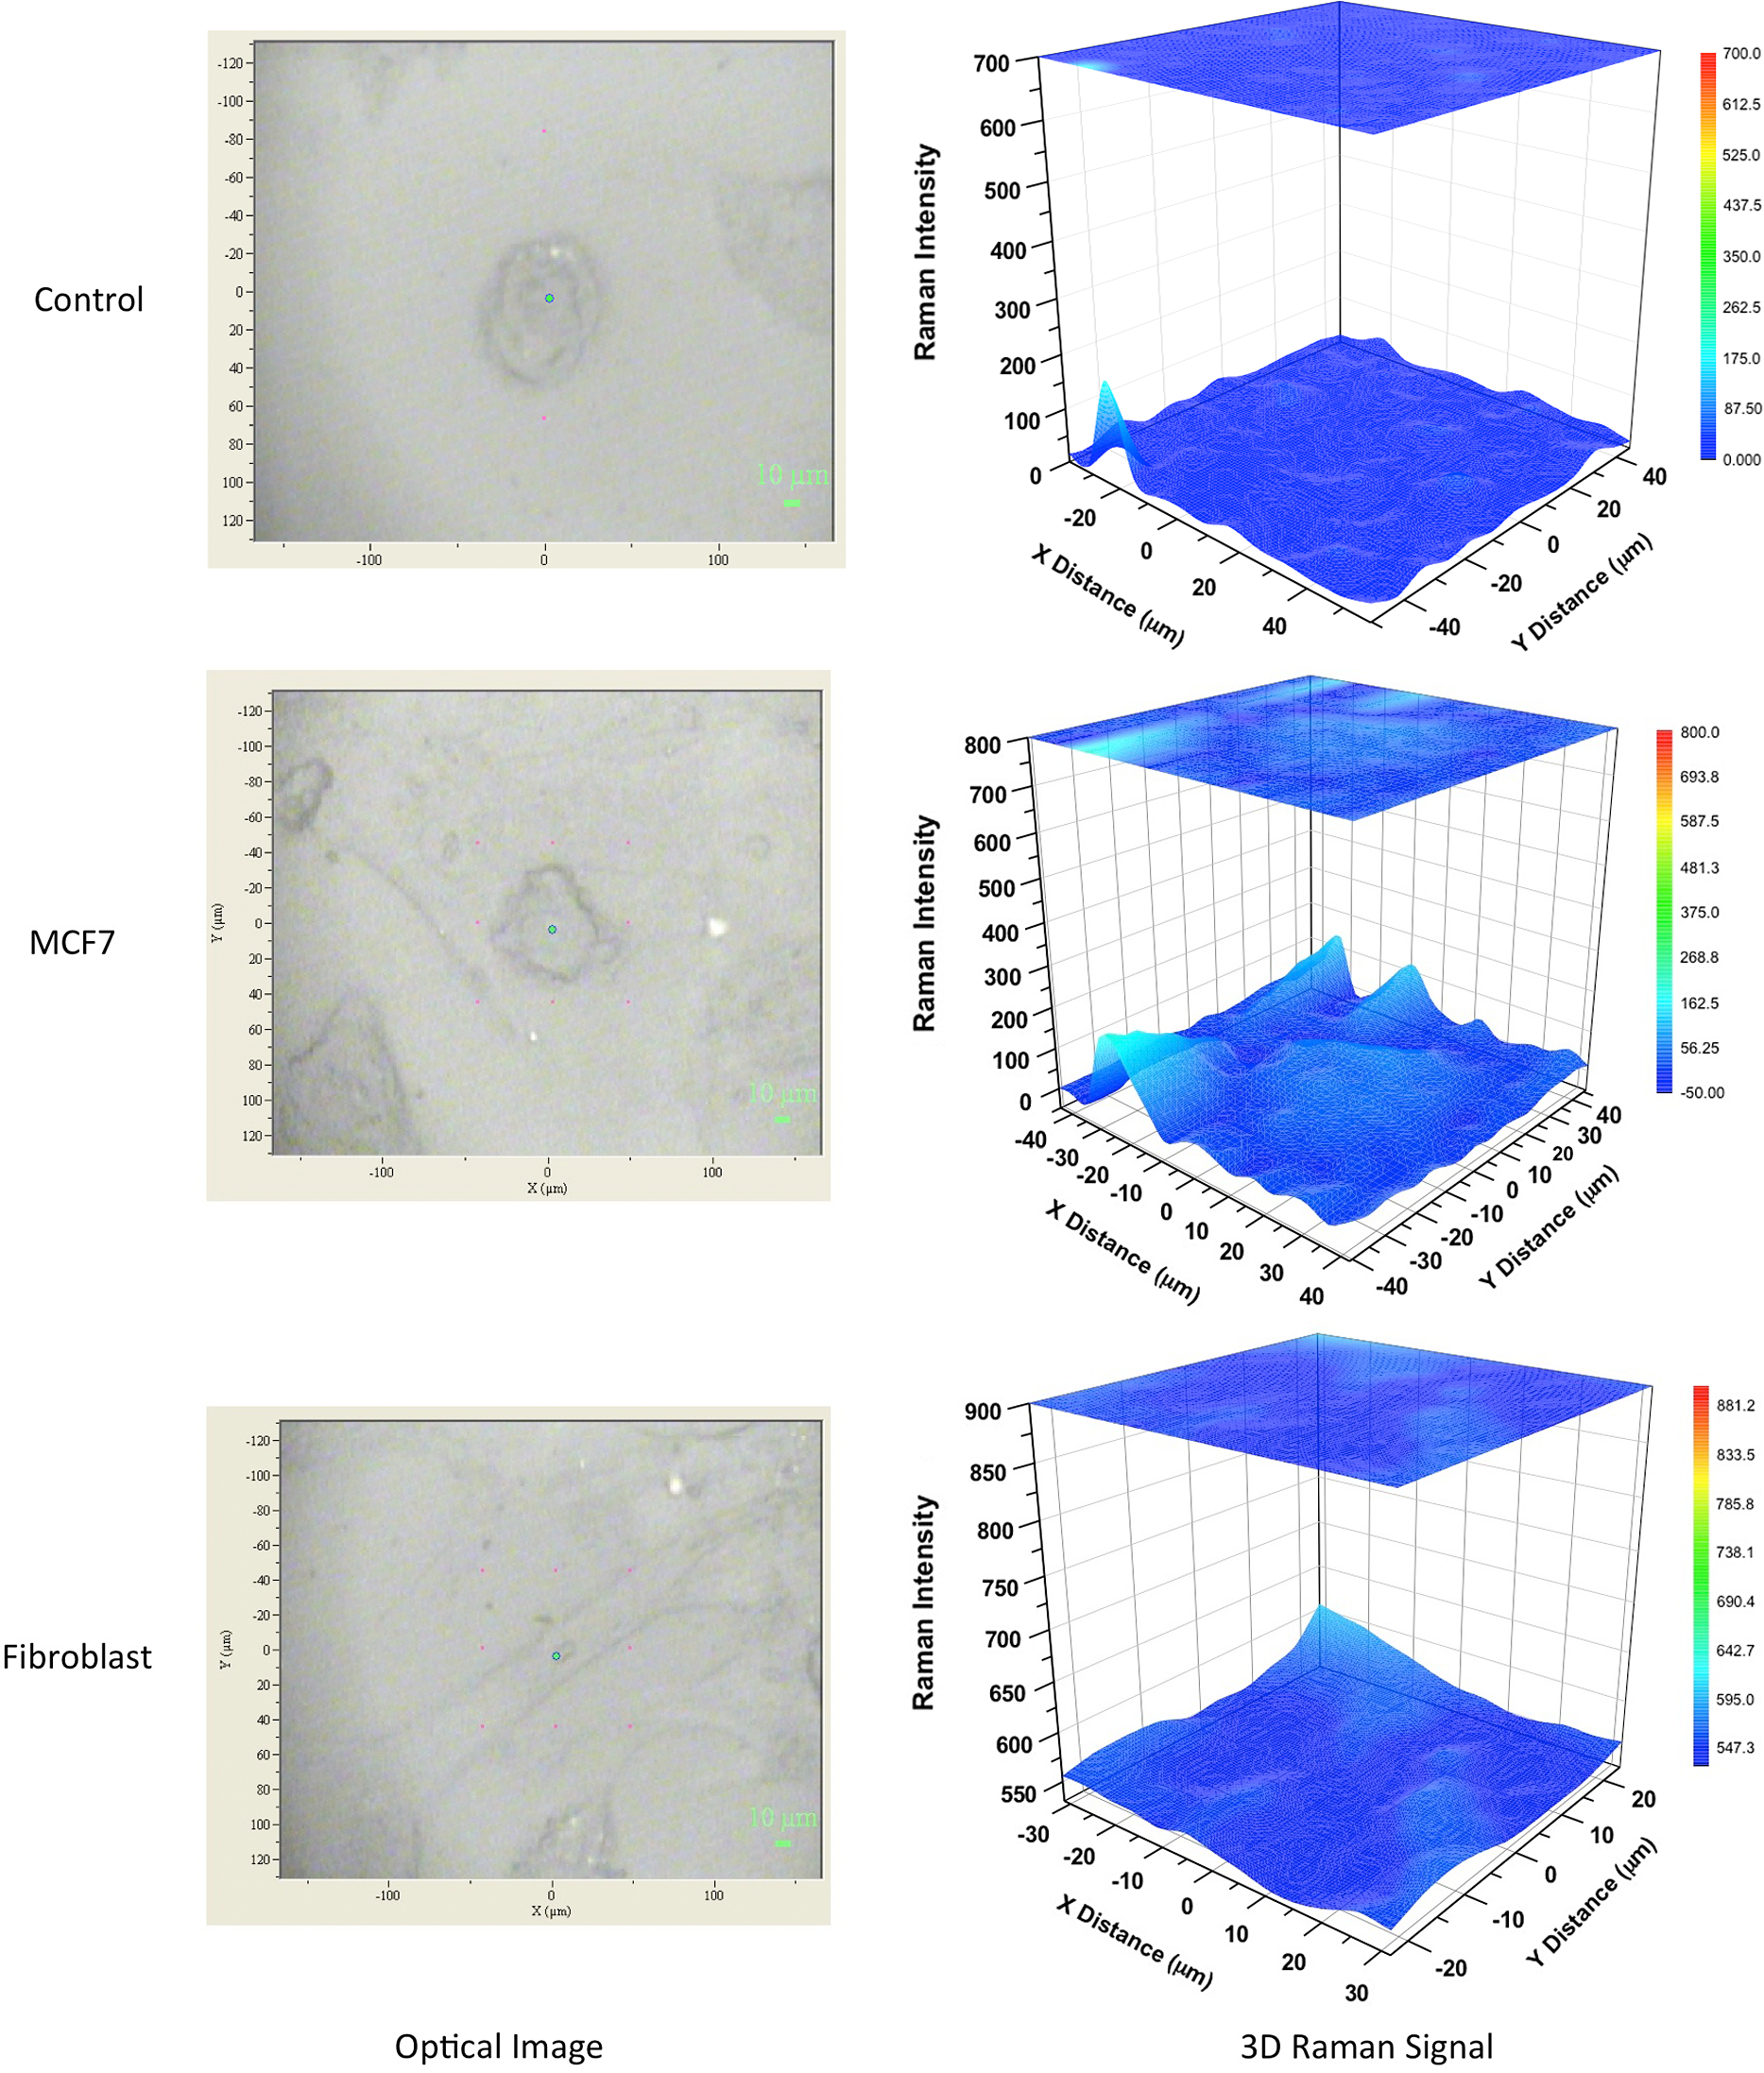 3.5.Single Cancer Cell DetectionA linear section of approximately 1000 μm (1 cm) of a monolayer of a mixture (9:1) of fibroblast cells and a few MCF-7 cells, incubated with anti-EpCAM-SWCNT for specific time periods (0.5, 1, 3, 6, 12, and 24 h), was studied in order to determine the efficacy of this approach for the detection and discrimination of single breast cancer cells among normal cells. Figure 8 shows the detection results of the cells exposed to the anti-EpCAM-SWCNT complexes for 30 min of incubation. The results were very promising and indicated that anti-EpCAM-SWCNT antibodies target MCF-7 cells only. No Raman signals were recorded from the fibroblast cells, suggesting that this method has potential use for clinical early detection of breast and other cancer cells. After a 30-min incubation time with Raman agents, we were able to differentiate the MCF-7 cells from the fibroblast cells based on the unique Raman signal of the SWCNTs. However, the linear scanning of the same mixture of cells incubated with only f-SWCNTs showed nonspecific Raman signals both for cancer cells and normal cells after 12 and 24 h of incubation, which confirmed our previous observations, as shown in Fig. 9. Fig. 8Raman linear scanning images at G-band intensity () for a mixture of monolayer MCF-7 and fibroblast cells incubated with of anti-EpCAM-SWCNT antibody within 30 min. Contour map (: linear scan distance around 1000 μm, : Raman shift 1450 to , : G-band intensity heat map, dimensionless), 3-D sketch (: linear scan distance around 1000 μm, : Raman shift 1450 to , : G-band intensity heat map, dimensionless), and optical image for linear scanned cells obtained directly from the Raman spectroscope at measurement time. MCF-7 + fibroblast cells without anti-EpCAM-SWCNTs served as the control. 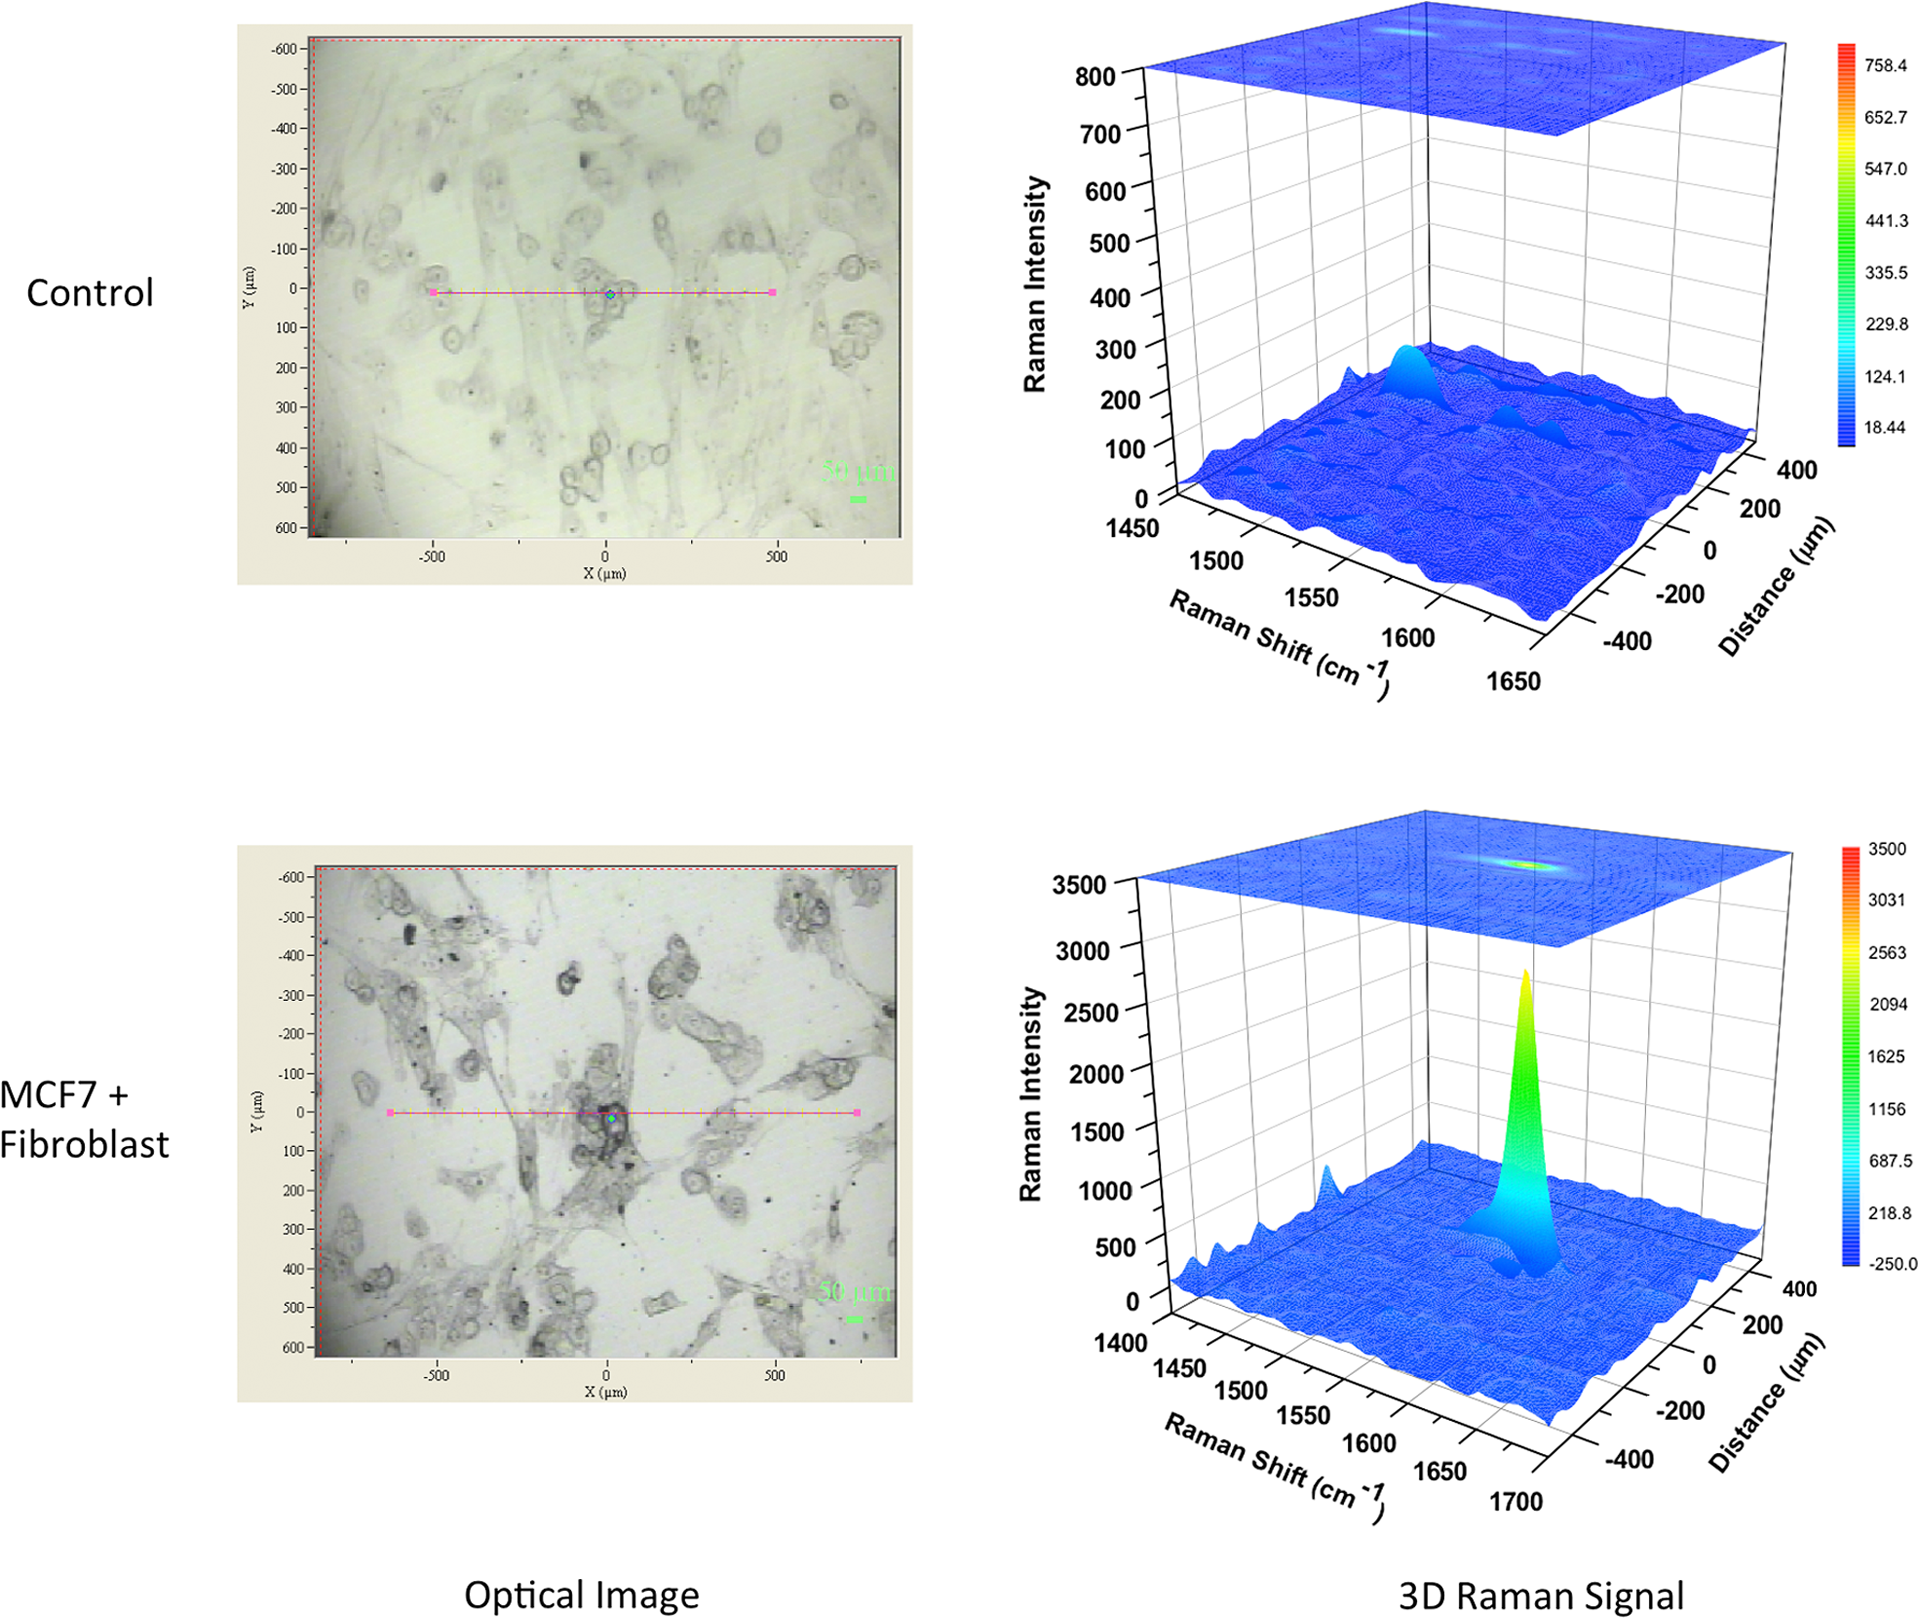 Fig. 9Raman linear scanning images at G-band intensity () for a mixture of monolayer MCF-7 and fibroblast cells incubated with of f-SWCNT only within 30 min. Contour map (: linear scan distance around 1000 μm, : Raman shift 1450 to , : G-band intensity heat map, dimensionless), 3-D sketch (: linear scan distance around 1000 μm, : Raman shift 1450 to , : G-band intensity heat map, dimensionless), and optical image for linear scanned cells obtained directly from the Raman spectroscope at measurement time. MCF-7 + fibroblast cells without f-SWCNTs served as the control.  These results clearly show that anti-EpCAM antibody can target cancer cells after being covalently bonded with f-SWCNTs, indicating that the active binding site is still available for the receptors located on the surface of cancer cells. Furthermore, the discrimination assay based on scanning Raman signal specifically on the G-band was able to detect single breast cancer cells surrounded by a large population of normal cells. 4.ConclusionsIn this study, SWCNTs were covalently linked to a cancer cell-targeting molecule, anti-EpCAM, and used successfully in vitro as a Raman nano-agent for the detection and discrimination of single cancer cells from normal cells within 30 min of incubation. The covalent connection between SWCNTs and anti-EpCAM was confirmed by using TEM. The Raman signal from a monolayer of MCF-7 cells was observed during the first 30 min of incubation and reached a maximum after 12 h as observed using Raman mapping. However, there was no Raman signal obtained from the normal fibroblast cells, either as independently grown cultures or in a mixture of cancer and normal cells. We also investigated the targeting ability of carboxylated SWCNTs (f-SWCNTs), and the results showed that there were significant increases in the Raman signal after 12 h of incubation with monolayered MCF-7 cells, whereas there was no signal with fibroblast cells. AcknowledgmentsSupport for this research from the Arkansas Science and Technology Authority (Grant No. 08-CAT-03) is greatly appreciated. The financial support provided by the US Army TATRC program is highly appreciated. The editorial assistance of Dr. Marinelle Ringer is also acknowledged. ReferencesAmerican Cancer Society, “Breast Cancer Facts and Figures,”
(2012) http://www.cancer.org/research/cancerfactsfigures/breastcancerfactsfigures/breast-cancer-facts-and-figures-2011-2012 January ). 2012). Google Scholar
A. S. Hakaet al.,
“Diagnosing breast cancer by using Raman spectroscopy,”
Proc. Natl. Acad. Sci. U. S. A., 102
(35), 12371
–12376
(2005). http://dx.doi.org/10.1073/pnas.0501390102 1091-6490 Google Scholar
G. GaspariniD. Hayes, Biomarkers in Breast Cancer: Molecular Diagnostics for Predicting and Monitoring Therapeutic Effect, Humana Press, Totowa, NJ
(2006). Google Scholar
Y.-K. Chunget al.,
“An electrical biosensor for the detection of circulating tumor cells,”
Biosens. Bioelectron., 26
(5), 2520
–2526
(2011). http://dx.doi.org/10.1016/j.bios.2010.10.048 BBIOE4 0956-5663 Google Scholar
Y. Husemannet al.,
“Systemic spread is an early step in breast cancer,”
Cancer Cell, 13
(1), 58
–68
(2008). http://dx.doi.org/10.1016/j.ccr.2007.12.003 CCELER 1042-2196 Google Scholar
N. A. Andrews,
“Circulating and disseminated tumor cells: many challenges, and even more opportunities, for the cancer and bone field,”
IBMS BoneKEy, 9
(12), 1
–4
(2012). http://dx.doi.org/10.1038/bonekey.2012.12 1940-8692 Google Scholar
K.-Y. T. Shine-Gwo ShiahC.-W. Wu,
“Epigenetic regulation of EpCAM in tumor invasion and metastasis,”
J. Cancer Mol., 3
(6), 165
–168
(2008). JCMOCF 1816-0735 Google Scholar
P. SapraT. M. Allen,
“Ligand-targeted liposomal anticancer drugs,”
Prog. Lipid Res., 42
(5), 439
–462
(2003). http://dx.doi.org/10.1016/S0163-7827(03)00032-8 PLIRDW 0163-7827 Google Scholar
E. Dervishiet al.,
“Carbon nanotubes: synthesis, properties, and applications,”
Particul. Sci. Technol., 27
(2), 107
–125
(2009). http://dx.doi.org/10.1080/02726350902775962 PTCHDS 0272-6351 Google Scholar
L. Duoet al.,
“Colorectal cancer detection by gold nanoparticle based surface-enhanced Raman spectroscopy of blood serum and statistical analysis,”
Opt. Express, 19
(14), 13565
–13577
(2011). http://dx.doi.org/10.1364/OE.19.013565 OPEXFF 1094-4087 Google Scholar
A. R. Biriset al.,
“Catalyst excitation by radio frequency for improved carbon nanotubes synthesis,”
Chem. Phys. Lett., 429
(1–3), 204
–208
(2006). http://dx.doi.org/10.1016/j.cplett.2006.08.007 CHPLBC 0009-2614 Google Scholar
K. Jianget al.,
“Protein immobilization on carbon nanotubes via a two-step process of diimide-activated amidation,”
J. Mater. Chem., 14
(1), 37
–39
(2004). http://dx.doi.org/10.1039/b310359e JMACEP 0959-9428 Google Scholar
Y. GaoI. Kyratzis,
“Covalent immobilization of proteins on carbon nanotubes using the cross-linker 1-ethyl-3-(3-dimethylaminopropyl)carbodiimide-a critical assessment,”
Bioconjugate Chem., 19
(10), 1945
–1950
(2008). http://dx.doi.org/10.1021/bc800051c BCCHES 1043-1802 Google Scholar
P. B. C. Pesceet al.,
“Calibrating the single-wall carbon nanotube resonance Raman intensity by high resolution transmission electron microscopy for a spectroscopy-based diameter distribution determination,”
Appl. Phys. Lett., 96
(5), 051910
(2010). http://dx.doi.org/10.1063/1.3297904 APPLAB 0003-6951 Google Scholar
M. S. Dresselhauset al.,
“Raman spectroscopy of carbon nanotubes,”
Phys. Rep., 409
(2), 47
–99
(2005). http://dx.doi.org/10.1016/j.physrep.2004.10.006 PRPLCM 0370-1573 Google Scholar
A. Jorioet al.,
“Characterizing carbon nanotube samples with resonance Raman scattering,”
New J. Phys., 5
(1), 139.1
–139.17
(2003). http://dx.doi.org/10.1088/1367-2630/5/1/139 NJOPFM 1367-2630 Google Scholar
J. Wuet al.,
“Structure-dependent hydrostatic deformation potentials of individual single-walled carbon nanotubes,”
Phys. Rev. Lett., 93
(1), 017404
(2004). http://dx.doi.org/10.1103/PhysRevLett.93.017404 ELSIE3 1064-8208 Google Scholar
Z. Yongbinet al.,
“Cytotoxicity effects of graphene and single-wall carbon nanotubes in neural phaeochromocytoma-derived PC12 cells,”
ACS Nano, 4
(6), 3181
–3186
(2010). http://dx.doi.org/10.1021/nn1007176 1936-0851 Google Scholar
Y. Zhanget al.,
“Mechanistic toxicity evaluation of uncoated and PEGylated single-walled carbon nanotubes in neuronal PC12 cells,”
ACS Nano, 5
(9), 7020
–7033
(2011). http://dx.doi.org/10.1021/nn2016259 1936-0851 Google Scholar
A. S. Biriset al.,
“In vivo Raman flow cytometry for real-time detection of carbon nanotube kinetics in lymph, blood, and tissues,”
J. Biomed. Opt., 14
(2), 021006
(2009). http://dx.doi.org/10.1117/1.3119145 JBOPFO 1083-3668 Google Scholar
T. Mustafaet al.,
“Impact of gold nanoparticle concentration on their cellular uptake by MC3T3-E1 mouse osteoplastic cells as analyzed by transmission electron microscopy,”
J. Nanomed. Nanotechnol., 2
(6), 1000118
(2011). http://dx.doi.org/10.4172/2157-7439.1000118 JNNODU 2157-7439 Google Scholar
|


