|
|
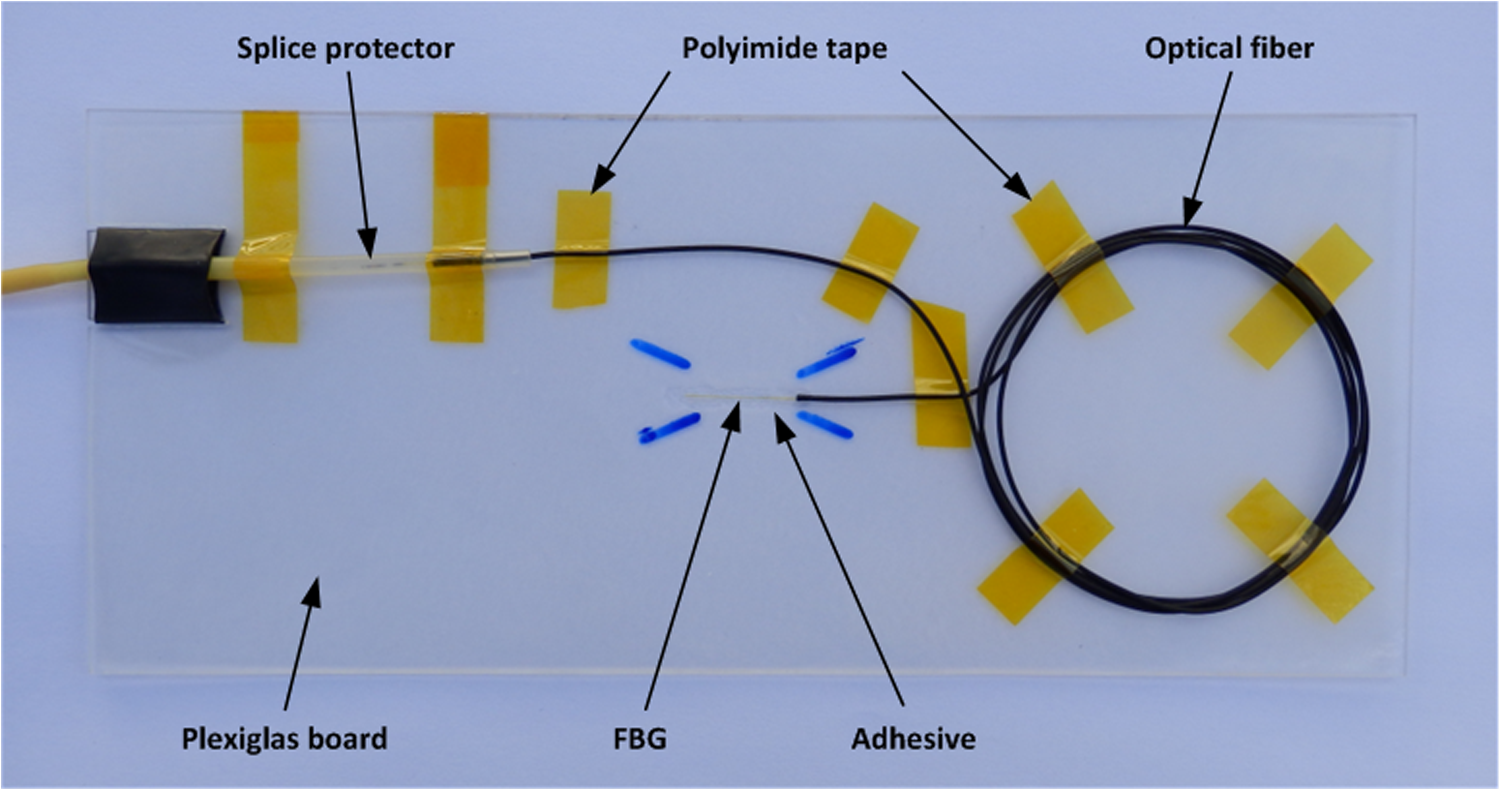
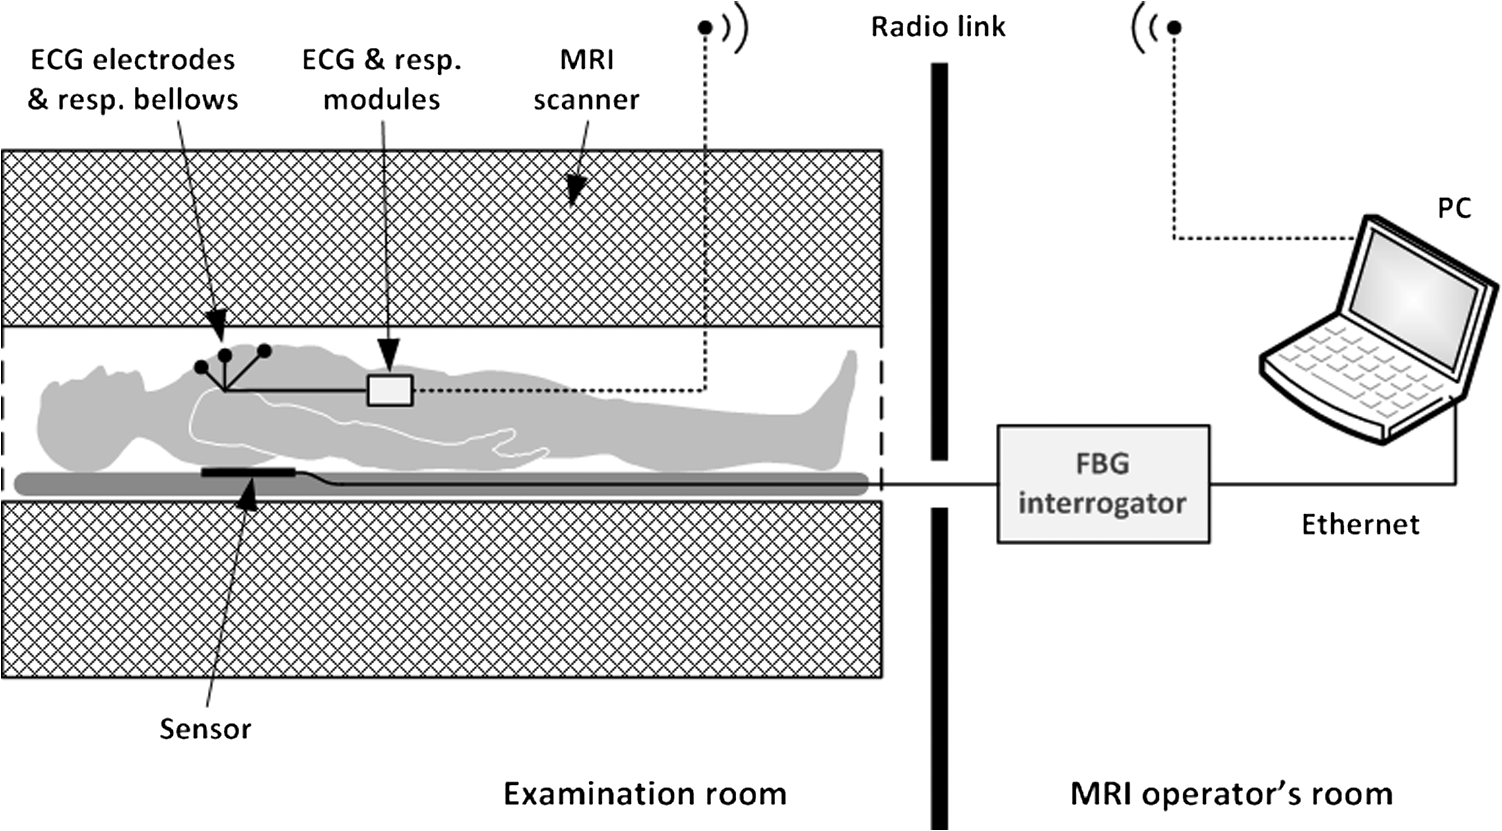
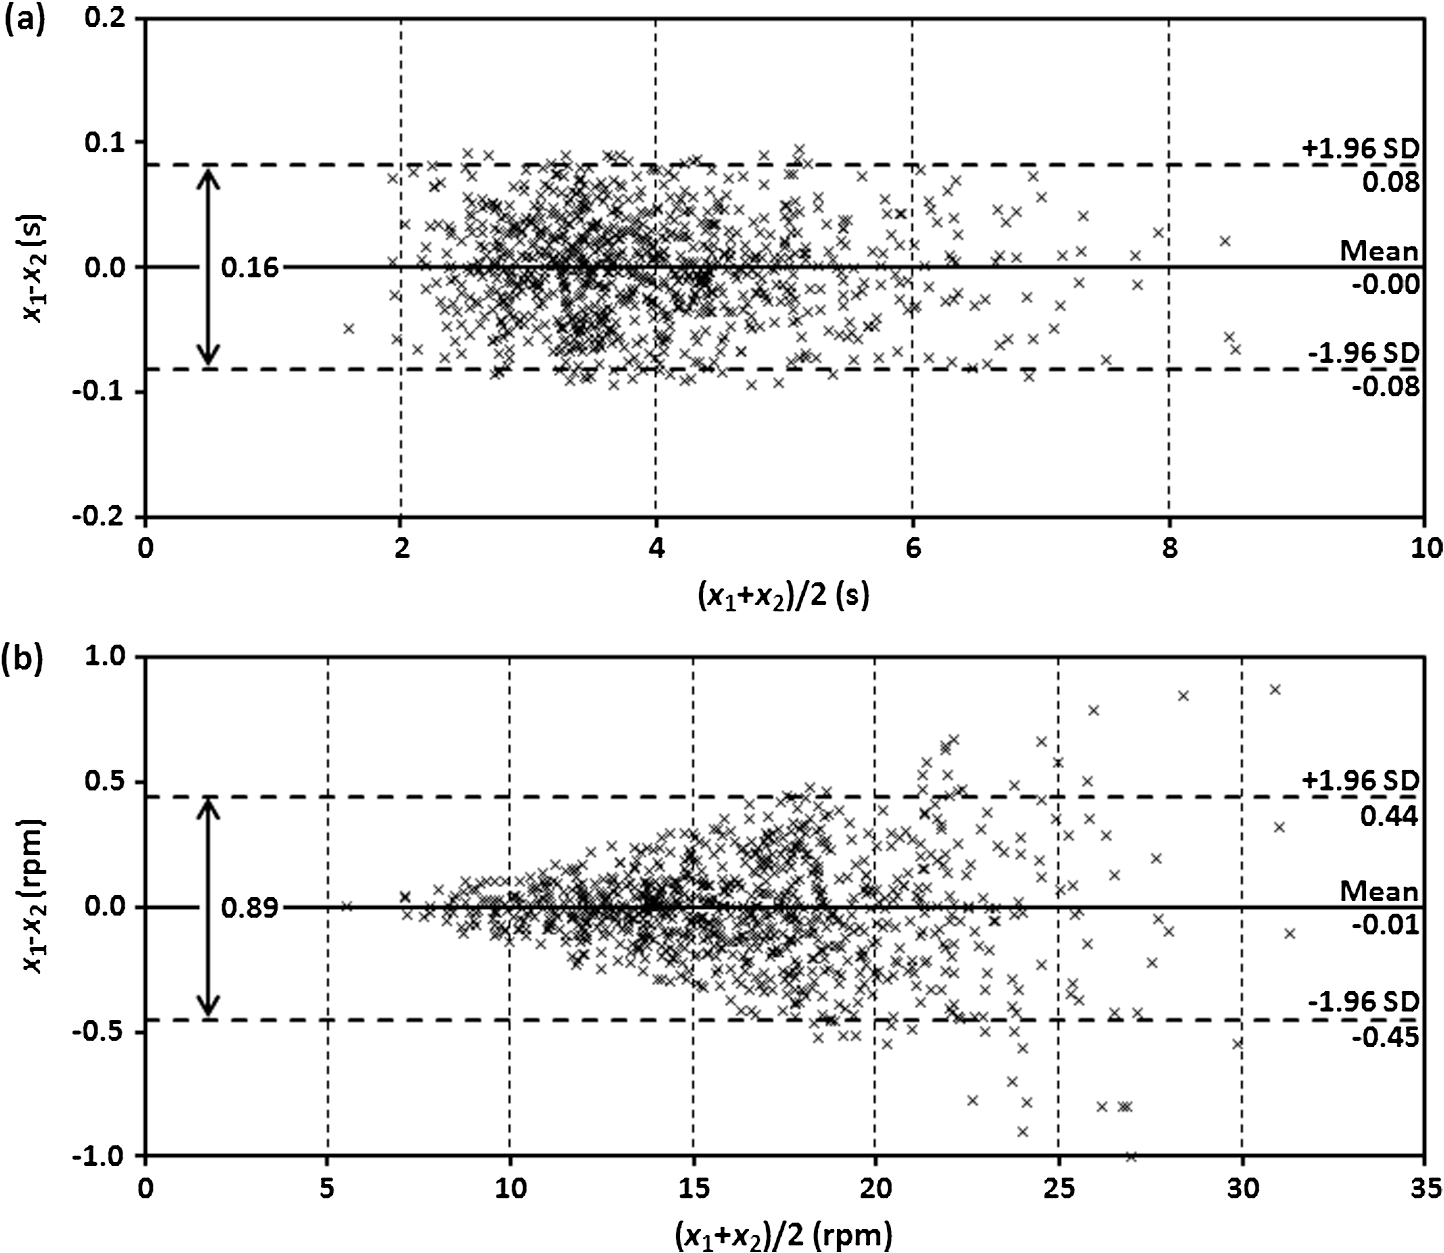
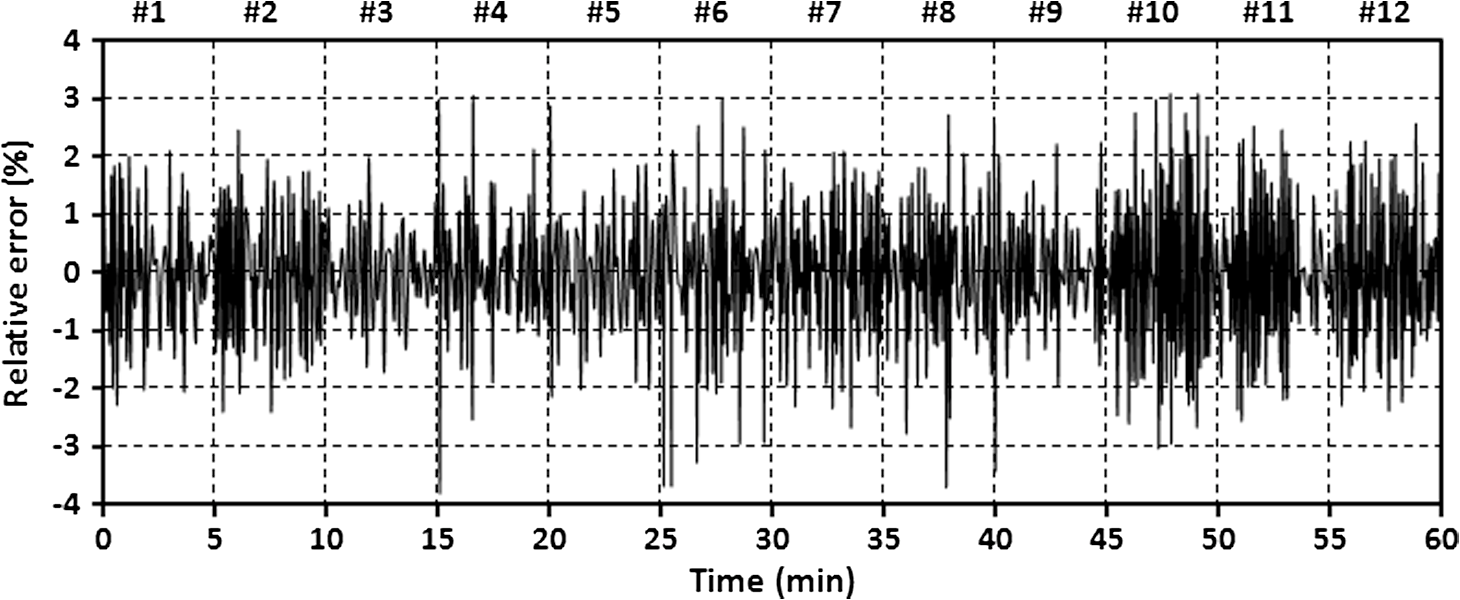
1.IntroductionRecently, magnetic resonance imaging (MRI) has become one of the most common and reliable diagnostic methods in medicine. The results of the still improving imaging performances, new functionalities, and more affordable prices represent a pronounced trend toward equipping hospitals and clinics with MRI scanners.1 The rapid development of this technology has created the need to construct devices capable of monitoring vital signs of at-risk patients during MRI examinations. The risk group in the context of MRI includes neonatal, pediatric, disabled, anesthetized, and insensible patients.2 The monitoring of life functions is also recommended for persons with implanted pacemakers, patients developing reactions to contrast media, and persons with mental disorders who may not be able to communicate with the system operator or to use the alarm button. However, efforts are being made to monitor at least some basic physiological parameters such as respiration and heart activity3 during each MRI examination, regardless of the patient category. Although MRI is a noninvasive method of investigation and does not expose patients to ionizing radiation, it has some psychological effects on patients. Some researchers4,5 have already demonstrated that 5% to 10% of patients undergoing MRI examinations experience severe claustrophobia or panic attacks during the scanning process, whereas 30% report milder distress and fear. Such increased stress stimuli and arousal may in turn lead to a phenomenon known as hyperventilation, which is increased ventilation of the lungs and significant acceleration and deepening of the breath, often resulting in fainting. Hyperventilation has numerous theoretical and empirical links to anxiety, panic, and fear episodes.6,7 This phenomenon was investigated in order to understand psychological and physiological mechanisms connected with hyperventilation that cause and maintain anxiety. On the other hand, attempts were also made to find a link between hyperventilation and the therapies used to treat different types of anxiety disorders. Some results8 support the idea of higher variability and irregularity in the respiratory patterns of subjects with panic disorder. Other clinical studies9 have shown that controlling and normalizing the subject’s breathing activity helps to reduce both anxiety and panic symptoms. On the basis of this assumption, different training and therapeutic programs10 have been created and carried out with the aim of teaching patients to breathe in a specific way to avoid or reverse hyperventilation, e.g., capnometry-assisted respiratory training.11 Furthermore, attempts have also been made to study the relationship between different anxiety disorders and cardiological parameters. The latest literature12 reveals an increased heart rate (HR) level in a group of people suffering from panic, anxiety disorders, and hyperventilation symptoms. In light of recent scientific reports, it seems obvious that MRI examinations can be a source of extreme stress and cause anxiety and panic symptoms in some patients. People who experience anxiety, fear, or hyperventilation during an MRI scan may either discontinue the procedure altogether or refuse to undergo MRI surveys in the future. In practice, it is important to identify those who are likely to panic and experience anxiety-related symptoms in the MRI unit as early as possible because only early detection ensures that appropriate actions can be taken to avoid psychological discomfort for the patient undergoing the scan and unnecessary use of the machine, as well as staff involvement in the entire procedure. Real-time monitoring of certain life functions in the patient, such as respiration rate (RR) and HR, can be helpful in controlling the arousal and anxiety level associated with the MRI examination itself and predicting the probability of a panic attack. Conventional monitoring equipment is not designed to work in the harsh MRI environment, distinguished by a magnetic induction of 1.5, 3.0 T, or even higher values and with radio frequency impulses of considerable electromagnetic (EM) field intensity.13 The presence of metal or electronic components under such conditions can cause burns on the patient’s skin and alter the EM field distribution and, thus, degrade the quality of imaging. Additionally, the signal transmitted using electrical conductive wires is vulnerable to the effects of a strong EM field, which complements the list of drawbacks of typical electronic measuring devices. On the other hand, optical sensors are fully penetrable in terms of the EM radiation applied in MRI, causing no interference. They are free from metal parts and function via optical fibers, resulting in their immunity to EM fields. There are solutions based on phase interferometry, in which the signal directed toward the sensing part of the optical fiber that is situated close to the patient is compared with the outgoing signal that is modified by confounding factors such as respiration and heartbeat.14–19 The lung- and heart-induced body movements cause phase changes between the input and output signals and further generate a time-varying serial pattern of fringes. A major disadvantage of this measuring method is the necessity of using sophisticated signal analysis in order to detect breathing and cardiac activity. A similar problem concerns sensors in the modalmetric configuration, which are comprised of multimode fibers sensitive to mechanical strain so that acousto-mechanical signals from the patient are coupled into the single-mode optical fiber.20 The modal field distribution in the multimode fiber changes in time proportionally to body movements and is detected by the single-mode fiber. Another problem associated with the modalmetric sensors is the difficulty in obtaining simultaneous monitoring of respiratory and heart function. We previously demonstrated that it is possible to detect respiration and heart activity simultaneously, using a fiber Bragg grating (FBG) mounted inside a pneumatic cushion, to be placed between the backrest of the seat and the back of the monitored person.21–23 Other pillow-based solutions have been reported in the literature,24–26 in which a microbending fiber-optic sensor was used instead of an FBG. In this paper, we show a sensor of a simplified construction, designed to be immune to the EM field, and thus suitable for MRI applications. Similar techniques for breath detection have been demonstrated by other groups, but their sensors are embedded into special textile belts or vests to be fixed to the monitored person’s body.27–39 The sensor proposed in this paper is configured for measurements that do not require any special wearable textiles, thereby avoiding the need to carry out processes for preparing the patient for monitoring. The solution closest to the proposed sensor is one comprising a 12-element FBG array embedded into a bed,40 although only laboratory trials evaluating the RR detection have been carried out so far. This article describes in detail the issue of patient monitoring during MRI scanning using the FBG-based sensor and discusses the proposed solution with regard to other known devices. 2.Methods2.1.Fiber Bragg GratingsThe sensor is designed using a Bragg grating inscribed into a single-mode optical fiber as the sensing element. FBGs have been one of the most widely researched optical components within the last decade. They have found manifold applications in telecommunications, laser, and sensor technology. The sensor applications of FBGs alone cover many fields, such as structural health monitoring,41 monitoring of conditions in electrical plants,42 and physiological activity monitoring.43 FBGs owe their popularity to their immunity to optical signal intensity modulation, which is possible on account of their spectral encoding as well as excellent multiplexing and self-referencing capabilities, thus allowing for the addressing of several sensors with one optical cable. At the same time, they offer the standard benefits of fiber-optic technology such as EM immunity, intrinsically safe modes of operation, a chemically inert nature, small size, and light weight. The FBG acts as a stop-band filter, except that part of the incident light, , is not stopped but is reflected from periodically arranged layers formed by refractive index modulation (see Fig. 1). The reflected beams from each of the layers destructively interfere with each other unless they are all in phase. This only occurs at one wavelength, known as the Bragg wavelength (or the central wavelength), , which is given by where is the effective refractive index of the fiber core,44 and is the period of the refractive index modulation.The light reflected from the grating, , assumes the spectral form of a sharp “peak” located at the Bragg wavelength, whereas the transmitted light, , is characterized by a narrow “dip” at the same wavelength. In most sensing applications, the central wavelength is determined on the basis of the peak position, as the reflected signal shape can be more easily demodulated. Thus, FBG-based sensors offer the unique advantages of a single-ended connection to the interrogation system. 2.2.Sensor ConstructionA starting point from which to build the sensor for monitoring respiration and heart activity was the susceptibility of the FBG to strain, which produces a shift in the Bragg wavelength, , and that is described by the following relation:41 where and are the silica photo-elastic tensor components, is the Poisson’s ratio, is the strain change, and is the stress-optic coefficient. For a germanium-doped fiber core and a wavelength of 1550 nm, the strain change can be summarized as follows:23The sensor design is based on the approach in which a springboard is used to convert body movements, including lung- and heart-induced vibrations, to strain, and an FBG attached to the board is used to measure this strain. The instantaneous spectral position of the FBG reflection peak can be calibrated in terms of respiration and heart activity readings. For the sensor to work properly, the board has to be placed between the bed mattress and the back of the patient. As the base of the sensor, a polymethyl methacrylate (PMMA) (i.e., Plexiglas) board with dimensions of and a thickness of 1.5 mm was used. A springboard of this size and thickness provides proximity to the body without a loss of comfort for the patient lying on it. At the same time, the board size ensures both that the body vibrations are sufficiently transferred to the FBG and that the vibrations can be decoded in the form of FBG elongations/contractions. The FBG, with at a temperature of 20°C, was attached with epoxy adhesive to the center part of the board, as shown in Fig. 2. After adhesive curing, the peak position shifted in the direction of higher wavelength values; its full width at half maximum increased slightly, and the peak amplitude decreased. One of the FBG pigtails was spliced with a pigtail that ended with an angled physical contact fiber connector connector capable of connecting the interrogation system. The splice protector was equipped with a ceramic reinforcing rod, instead of a steel one, in order to allow the sensor to be used in an MRI environment. The excess fiber between the FBG and the splice protector was formed into a loop, consisting of several turns, and was taped to the PMMA board. The other FBG pigtail was cut off a few centimeters from the grating and also taped to the board. 2.3.Experimental SetupA block diagram of the experimental setup is depicted in Fig. 3. The study was conducted at the Military Institute of Aviation Medicine, Warsaw, Poland, equipped with the Achieva 1.5 T MRI scanner by Philips, Andover. The sensor was placed in the MRI examination room between the mattress of the track table in the MRI system and the back of the lying patient in the area of the shoulders to ensure proximity to the heart and the lungs. The sensor lead, in the form of a 10-m optical cable, was threaded through an opening in the wall and connected to the FBG interrogation system in the MRI system operator’s room. To interrogate the sensor, a commercially available sm130-700 unit from Micron Optics, Atlanta was used.45 The device consists of two main modules: a broadband light source to illuminate the FBG, and a high-speed scanning Fabry–Pérot (FP) tunable filter to analyze the signal reflected from the grating. Using a FP tunable filter is the most common technique for monitoring an FBG; any changes in the Bragg wavelength located within the free spectral range of the FP filter can be tracked by the spectrally scanning filter.23 The sm130-700 interrogator allows for scanning a band of 1510 to 1590 nm with a frequency of 1 kHz and a resolution of , which in turn, according to Eq. (3), ensures measurement of strains as low as . The data from the interrogator were sent via the Ethernet interface to a laptop PC with software developed for signal visualization, data archiving, processing, and analysis.22 The experimental setup was equipped with respiration and electrocardiogram (ECG) recorders from Invivo, Gainesville,46 designed to operate in the MRI environment, as a source of signals used to determine the reference RR and HR. The respiration and ECG signals were acquired from the patient using pneumatic bellows placed on the patient’s chest and carbon electrodes fixed to his or her chest, respectively, and transmitted from the recorders to a PC wirelessly via a 2.4 GHz radio link. As the data were transmitted in two different ways (i.e., by Ethernet and radio), to minimize the possible occurrence of a shift between the signals, they were synchronized by means of motion artifacts introduced in the reference signals and the sensor signal at the beginning and the end of the recording. 2.4.SubjectsTwelve adult volunteers were involved in the experimental studies (four females, eight males); age: ()years, weight: , and height: . When the sensor was placed under the back of each patient in the same manner, no significant correlations were observed between the quality of the received signal and the age, weight, or height of the subjects. Any differences in the representation of the sensor signal are instead a result of individual features of the subjects, such as the size of internal organs or the pattern of blood vessels. 3.Results3.1.Frequency ResponseFor the purpose of demonstrating the system’s frequency response, the sensor was vibrated by a modified high-power loudspeaker driven by a signal generator, as shown in Fig. 4. A reference FBG was mounted on the flexible cone suspension of the loudspeaker to provide a strain measurement that is proportional to the cone excursion. This allowed the sinusoidal vibration to be set to a constant amplitude within the measurement range. The signal amplitude recorded by the sensor that was referred to the signal amplitude measured by the reference FBG is shown in Fig. 5 in the form of transmittance corresponding with the frequency response of the measurement system. The sensor performance within the range of the ballistocardiographic (BCG) signal being measured (i.e., 1 to 20 Hz17,47) shows that signals are sensed without any degradation of the physiological information. The BCG frequency range lies clearly below the resonant frequency of the sensor. 3.2.Determining RRThe main phase of the experiments covered clinical evaluation of the sensor’s RR and HR measurement capabilities, in real MRI conditions. Each of the subjects was asked to lie down on the track table of the MRI scanner, and the physiological activities of their bodies were recorded during a 5-min exposure that was part of a thoracic spine examination. Thus, the total recording time was 60 min. A 14-s portion derived from the entire recording made on a 36-year-old man (weight: 86 kg; height: 183 cm) is shown in Fig. 6. The upper trace represents the respiration curve recorded with the reference module for respiration monitoring, and the lower one shows the corresponding part of the signal coming from the sensor (shown in gray). Additionally, the original signal was denoised through an averaging of 250 samples (with the result shown by the black line).23 The slowly changing “waving” pattern in the sensor signal reflects the activity of the lungs. The arrows indicate the maximum values of the signal during subsequent breaths used by the authors as distinctive points for determining an RR trace. In this way, local maxima were extracted for the processed 5-min sensor signal. The RR value at the time , at which the ’th maximum occurred, is defined by the formula Figure 7 shows the 5-min RR traces obtained for each of the subjects, successively, using both (a) readings from the reference recorder and (b) the set of local maxima extracted from the sensor signal. In both cases, the reference RR trace and that obtained on the basis of the sensor signal are of similar shape, and therefore the Bland–Altman plot was used for quantitatively assessing the sensor’s RR measurement capability.48,49 In this graphical method, the differences between the two techniques (i.e., ) are plotted against the averages of the two techniques [i.e., ]. The better the reproducibility is considered to be, the narrower the SD range containing approximately 95% of the results is. The accuracy of determining the characteristic points from the sensor signal in relation to those determined from the reference signal is shown in Fig. 8(a) for the total pool of data (all subjects). Among the values, 96.10% lie within the limits of agreement (LoA); the results show no systematic error, have no proportional character, and do not depend on the frequency of the distinctive point occurrence. Going further, the sensor’s RR determination capability is estimated in Fig. 8(b), in which 95.02% of the values lie within the LoA of 0.89 respirations per minute (rpm). In contrast to the Bland–Altman assessment of the characteristic point determination, the sample distributions for the RR determination clearly show the dependence on the RR values. This can be explained by the fact that the error in determining characteristic points that is independent on the RR translates into the error in determining the RR, which increases with RR, according to Eq. (4). Fig. 7Respiration rate extracted from (a) reference signal and (b) sensor signal shown successively for all of the subjects.  The sensor’s RR measurement capability is also estimated in Fig. 9 by calculating the differences between the reference and measured RR values in relation to the average value between them. The relative error span is below 7% [mean relative error (MRE) of RR detection: ], which in relation to the number of inhalations per minute gives a value of approximately [mean absolute error (MAE) of intervals between respiration events: ]. The results of the sensor’s RR measurement capability evaluation are summarized in Table 1 for each of the subjects as well as for the total pool of data. Table 1Results of the sensor’s RR measurement capability evaluation.
3.3.Determining Heart RateThe cyclic disturbances seen on the envelope of the sensor signal shown earlier in Fig. 6 represent the activity of the heart. Hence the following stage of experimental studies included sensor signal processing in the context of the sensor’s HR measurement capability. For a better visualization of the heart activity and due to the need for HR detection, the sensor signal was normalized by reducing it to the reference level of zero through low-pass filtering with a cutoff frequency of 60 Hz, which did not cause a loss of physiological information. Figure 10 shows an enlarged 2.5-s portion of a recording made with the same male subject whose respiration traces were shown in the previous section. The upper trace represents the reference ECG signal (CM5 lead), whereas the lower one shows the corresponding part of the signal recorded by the sensor (gray line). In addition to the low-pass filtering, the signal was denoised by averaging over 25 samples (black line).23 According to the literature,50–53 the general waveform of the BCG consists of an early peak (H, Fig. 10) related to the motion of the heart early in systole, and the main IJK complex related to the ventricular ejection and aortic flow. It can be assumed approximately that the highest peak (J) occurs at the maximum value of the ECG T-wave. It is easy to see that the BCG signal acquired by the sensor is also a sort of a kinetocardiogram54,55 in which the movement of the subject’s back in relation to the mattress of the track table is registered rather than the movement of the chest. However, the signal shape can also reflect the flow of blood in the organs of the body. The arrows shown in Fig. 10 indicate the J peaks of the BCG signal during subsequent heartbeats used for determining the HR trace, in a manner similar to the RR detection procedure. Thus, J peaks (local maxima) were extracted for the processed 5-min signal from the sensor. The HR value at the time , at which the ’th maximum occurred, is defined as follows: Figure 11 shows 5-min HR traces obtained for each of the subjects using both (a) the ECG recorder and (b) the HR detection procedure performed on the sensor signal. Again, the sensor and reference traces have similar shapes, and the differences between them are better depicted in Fig. 12 by means of the Bland–Altman plot. First, the accuracy of determining the J peaks from the BCG signal in relation to the R waves determined from the ECG signal is shown in Fig. 12(a) for the total pool of data. 95.89% of the considered samples lie within the SD range. Subsequently, the sensor’s HR determination capability is estimated in Fig. 12(b). 95.11% of the values lie within the LoA, and this range is equal to 3.64 beats per minute (bpm). In the same way as the respiration data shown previously, the data for the distinctive point determination are relatively normally distributed (i.e., there are no systematic or proportional errors), and no dependence on the frequency of the distinctive point occurrence is observed, whereas the HR sample collections strongly depend on the HR value. Again, the error in determining characteristic points that is independent on the HR translates into the error in determining the HR (where the error increases with HR), according to Eq. (5). In addition to the Bland–Altman analysis, a fractional error was shown in Fig. 13 to characterize the usefulness of the proposed measurement method. The error varies within the range of 6.5% (MRE of HR detection: ), which corresponds with approximately (MAE of beat-to-beat intervals: ). Table 2 summarizes the results of the sensor’s HR measurement capability evaluation, both for individual subjects and for the total pool of data. Table 2Results of the sensor’s HR measurement capability evaluation.
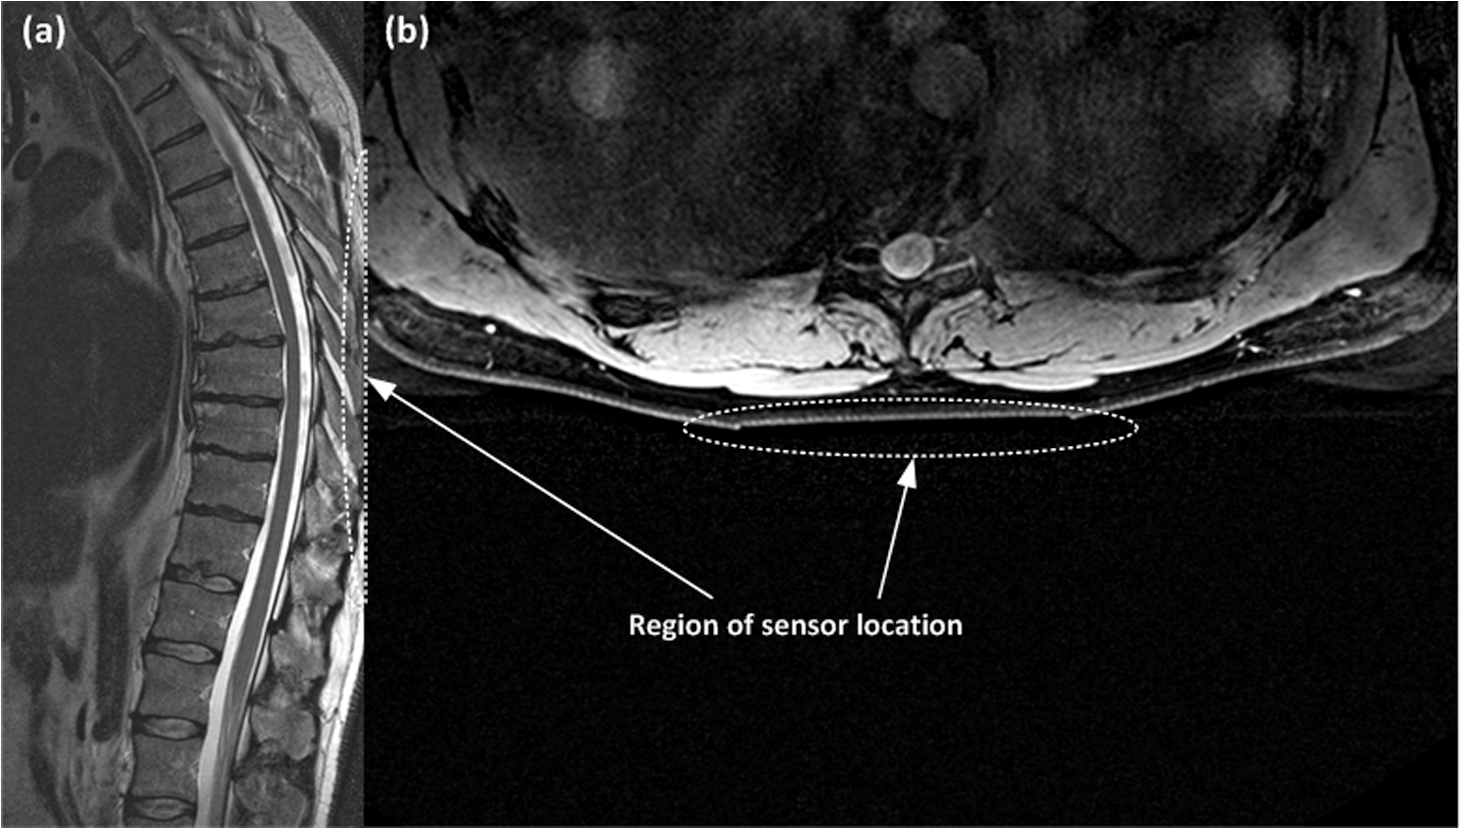
3.4.Patient Comfort and SafetyAt the end of each test, the subject was asked about any negative feelings caused by the presence of the sensor in his or her back, such as excessive rigidity or size of the board, leading to galls or bruises on the subject. None of the subjects reported any symptoms of discomfort caused by the sensor location; no one suffered any prejudice. Finally, the same male subject, whose respiratory and cardiac recordings are shown above in Figs. 6 and 10, was asked to undergo a complete thoracic spine MRI examination for the purpose of assessing the comfort of a subject remaining in the same position for a long time with his back in contact with the sensor. Figure 14 shows (a) RR and (b) HR traces obtained on the basis of the sensor signal acquired during a 39-min exposure. The subject does not need to lie down at a designated position to enable the sensor to acquire his physiological signals. He was able to simply remain in the supine position identical to that taken by patients during a normal spine MRI examination. The physiological signals were correctly acquired from the subject during the entire duration of the scan. The subject did not complain of any discomfort associated with the presence of the sensor in his back. High values of the EM field generated during the examination did not affect the optical signal propagated in the fiber and did not disturb the sensor operation even once. The clinical evaluation proved that the signal was identical to that obtained without exposure to the EM field. Moreover, the presence of the sensor during the MRI examination did not pose a threat to the patient and had no influence over the quality of the imaging. Figure 15 shows an image of the region of the body under which the sensor was placed; the proposed transducer is transparent to the MRI system. It was verified that the sensor does not introduce any artifacts to the spin-echo (SE) T1-weighted and T2-weigtened or to the gradient-echo (GE) T2-weighted imaging sequences. 3.5.Signal QualityThe quality of the sensor signal depends to a large extent on the thickness of the clothing the monitored person is wearing over his or her torso. The thicker the layer of clothing is, the more distorted is the transmission of lung- and heart-induced vibrations to the sensing element. During the experimental studies, the subjects were wearing one or two layers of clothing (i.e., a shirt or T-shirt and a sweatshirt), and no difficulties in the physiological signal acquisition were observed. Although MRI patients usually wear not more than two layers of light, indoor torso garments (room temperature), there are plans for improvement of the system’s reliability by locating several FBGs at various positions inside the mattress that the patient rests on.40,56 This treatment will also reduce the influence of other factors that can deteriorate the quality of the signal, such as the sensor arrangement under the patient, the force exerted by the lying patient on the sensor located behind him, and individual features of the patient. All of these elements determine the value of the signal-to-noise ratio (SNR), which for the respiration wave presented in Fig. 6 is specified as 18.27 dB with respect to the signal obtained during the 0.5-min period of apnea. Similarly, the SNR level for the BCG signal shown in Fig. 10 is equal to 3.37 dB, estimated on the basis of the normalized signal in relation to the same signal but with heart-induced disturbances removed.57 One of the main features of ballistocardiography-based systems is their sensitivity to any body movements, which disturbs the signal carrying physiological information.58 Figure 16 shows an example of a signal artifact induced by a short displacement of the track table. The artifact amplitude is five times higher than the signal amplitude produced by the heartbeat. Other movements such as coughs or changes to the body position may cause more significant distortions of the sensor signal. Therefore, BCG devices designed for clinical use usually have to be equipped with additional software or hardware modules that can eliminate or compensate for high-amplitude body movements. Software filtering is the simplest means by which to compensate, at least partially, for the disturbances. Special arrangements of equipment that eliminate the influence of high vibrations can be based, for example, on FBGs or accelerometers not registering vibrations produced by the activity of the lungs or heart. The output signals in these arrangements were used for compensating the influence of disturbances to the sensor output signal. However, the sensor in the presented version can be successfully used to monitor respiration and heart rate during an MRI examination, where the patient remains still for tens of minutes. 4.DiscussionThe RR and HR determination capabilities of the sensor depend mainly on the signal quality, and this issue was discussed in the previous section. In general, a noisier sensor signal indicates less unequivocal location of the distinctive points proposed for determining the RR and HR. The sensor shows maximum errors of and when compared with the reference RR and HR, respectively, and these values should be referred to results obtained using other fiber-optic sensors. Although it is difficult to compare our results with those publicized by other groups as their outcomes are often very modest and thus not objective, we attempt in this section to assess the proposed sensor with respect to other solutions. The largest group of publications has been presented by the research team that worked on the OFSETH project.27–35 They developed three different fiber-optic designs, all textile-based: an FBG sensor, a macrobending sensor, and an optical time domain reflectometry sensor. Their sensors measure elongations of the abdominal circumference during breathing movements and target the monitoring of sedated or anaesthetized patients under MRI. In their numerous publications, they provide information on the percentage textile elongation only, and make no mention of measurement error or accuracy. Other MRI-compatible fiber-optic sensors embedded into textiles are presented in Ref. 36, though the paper concentrates mainly on the signal processing and does not deliver quantitative data on the sensor performance, and in Ref. 37 where the authors verified the influence of the sensor over the quality of imaging, but did not provide sufficient respiratory data. A simultaneous respiratory and cardiac frequency measurement using a single FBG sensor embedded into a polymeric foil attached to the patient’s T-shirt is described in Ref. 38. The sensor was tested on a group of 12 healthy subjects (ages 20 to 30 years) in laboratory conditions, without exposure to the EM field. In contrast with the results shown in this paper, where the figures are supplemented by the tabulated data, those authors present their outcomes mainly in graphical form, and therefore it is difficult to compare the two techniques objectively. However, careful analysis of the graphical data shows an improved sensitivity of the sensor embedded in wearable textiles; specifically, such a sensor has a BCG signal amplitude that is approximately two times larger and a respiratory signal amplitude that is approximately three times larger. An innovative system for respiratory function monitoring comprising an array of 40 FBGs embedded into a specially designed textile vest is presented in Ref. 39. The sensor system is distinguished by a high accuracy but is complex, and the authors aimed at advanced measurements of three-dimensional volumetric changes of the human torso rather than common RR monitoring. Another multisensor system employs 12 FBGs (in a array) embedded in arc-shaped metal bridges and is deployed on the bed beneath the mattress supporting the patient.40 The authors carried out laboratory trials on 10 subjects and showed a maximum error of when compared with manual counting. They noted the sensor’s ability to measure HR; however, corroborating data have not been made available so far. BCG signal acquisition has been documented in several papers,24–26 where a macrobending fiber-optic sensor was embedded into a cushion to either be placed on a chair or used as a pillow. The laboratory evaluations involved five volunteers (ages 25 to 49 years), and the authors demonstrated an average accuracy above 95%; however, the maximum error achieved was . The list of fiber-optic devices for monitoring human vital signs should include interferometric and modalmetric sensors, of which the Michelson interferometer presented in Refs. 17 to 19 deserves special attention as the literature provides the most relevant data. The sensor was distributed on the bed surface and tested with the participation of 20 subjects during rest and 10 subjects after cycling an ergometer. The measurement system exhibits an MRE equal to for intervals between respiration events, and for beat-to-beat intervals, during rest. Slightly worse results were obtained after physical effort. However, the maximum relative error exceeds the value of 30% for the RR detection and is within 17% for the HR detection. Among various fiber-optic devices for monitoring vital signs in the MRI environment, the sensor presented in this paper allows respiration and heart activity signals to be acquired simultaneously, without the need for the patient to wear any special clothes. Compared with the results obtained by other groups, the difference plots as well as the relative error traces demonstrate the RR and HR detections with an acceptable accuracy for multiple subjects. As a logical next step following the in-depth literature analysis presented in this section, our future works will be directed toward multiplying sensing elements in order to improve the system’s reliability and accuracy. 5.ConclusionsWe have proposed and tested a simple sensor design based on well-known components of fiber-optic technology, which allows for noninvasive monitoring of respiration and heart activity. The main advantage of the presented solution is its immunity to EM interference that predisposes the sensor for use in the MRI environment. The signal from the FBG-based sensor is spectrally encoded, enabling protection against amplitude distortions. It was shown that high values of the EM field generated by the MRI scanner neither affected the optical signal propagated in the fiber nor disturbed the sensor operation. The metal-free construction ensured safety for the patient and did not affect the quality of imaging. The results showed that the sensor was able to accurately reflect the BCG signal enabling determination of the RR and HR traces. The statistical analysis confirmed good measuring properties of the sensor that met the basic requirements for monitoring a patient during an MRI examination. The Bland–Altman method allowed the depiction of the normal distribution of the data for the characteristic point determination as well as to show the clear dependence of the data on the RR and HR values for the RR and HR determination, respectively. In addition to the statistical results, the maximum errors in RR and HR were within 7% () and 6.5% () of the average values, respectively. The spectrally encoded sensor signal brings another benefit in the form of easy multiplexing. This feature will enable signal acquisition from multiple FBGs located in several different places under the monitored person’s body, and addressing all the FBGs with one optical fiber. The aim of this approach will be to improve the reliability and optimize the measuring system, while maintaining its simple design and low costs. Future work will also concentrate on implementing the sensor into routine MRI examinations, which will enable increasing the number, and diversity, of the subjects as well as performing various types of additional research. In particular, the subjects’ behavior and their respiration rate variability will be a matter of thorough analysis in terms of the hyperventilation phenomenon frequently seen during MRI examinations. A deep investigation is highly desirable in the context of preventing panic symptoms in patients examined using MRI scanners and will therefore facilitate such a diagnostic test. AcknowledgmentsThis article includes the results of work carried out within the framework of Project No. DOBR/0052/R/ID1/2012/03 “Development of the ORTHO-LBNP (Lower Body Negative Pressure) technology for research and training of Polish Air Force pilots under conditions of ischemic hypoxia and orthostatic stress,” financed by the Program for National Defense and Security, Poland. The Philips Achieva 1.5 T scanner was purchased with a grant from the Fund for Polish Science and Technology, Agreement No. 581/FNiTP/739/2010. ReferencesMagnetic Resonance Imaging (MRI) Equipment—A Global Strategic Business Report, Global Industry Analysts, Inc., San Jose, CA
(2011). Google Scholar
F. G. Shellock,
“Patient monitoring in the MRI environment,”
Magnetic Resonance Procedures: Health Effects and Safety, 217
–241 CRC Press, Boca Raton, FL
(2001). Google Scholar
A. von Smekalet al.,
“Patient monitoring and safety during MRI examinations,”
Eur. Radiol., 5
(3), 302
–305
(1995). EURAE3 1432-1084 Google Scholar
J. C. MeléndezE. McCrank,
“Anxiety-related reactions associated with magnetic resonance imaging examinations,”
J. Am. Med. Assoc., 270
(6), 745
–747
(1993). http://dx.doi.org/10.1001/jama.1993.03510060091039 JAMAAP 0098-7484 Google Scholar
L. M. HarrisJ. RobinsonR. G. Menzies,
“Predictors of panic symptoms during magnetic resonance imaging scans,”
Int. J. Behav. Med., 8
(1), 80
–87
(2001). Google Scholar
A. E. Meuretet al.,
“Voluntary hyperventilation in the treatment of panic disorder - functions of hyperventilation, their implications for breathing training, and recommendations for standardization,”
Clin. Psychol. Rev., 25
(3), 285
–306
(2005). http://dx.doi.org/10.1016/j.cpr.2005.01.002 CPSRDZ 0272-7358 Google Scholar
C. L. Badouret al.,
“Specificity of peritraumatic fear in predicting anxious reactivity to a biological challenge among traumatic event-exposed adolescents,”
Cogn. Ther. Res., 36
(4), 397
–406
(2012). http://dx.doi.org/10.1007/s10608-011-9380-0 CTHRD8 0147-5916 Google Scholar
M. Grassiet al.,
“Baseline respiratory parameters in panic disorder: a meta-analysis,”
J. Affect. Dis., 146
(2), 158
–173
(2013). http://dx.doi.org/10.1016/j.jad.2012.08.034 JADID7 0165-0327 Google Scholar
D. Rosenfieldet al.,
“New breathing therapy reduces panic and anxiety by reversing hyperventilation,”
J. Med. Sci., 11
(8), 327
–328
(2011). 1682-4474 Google Scholar
E. WollburgW. T. RothS. Kim,
“Effects of breathing training on voluntary hypo- and hyperventilation in patients with panic disorder and episodic anxiety,”
Appl. Psychophysiol. Biofeedback, 36
(2), 81
–91
(2011). http://dx.doi.org/10.1007/s10484-011-9150-5 1090-0586 Google Scholar
A. E. Meuretet al.,
“Respiratory and cognitive mediators of treatment change in panic disorder: evidence for intervention specificity,”
J. Consult. Clin. Psychol., 78
(5), 691
–704
(2010). http://dx.doi.org/10.1037/a0019552 JCLPBC 0022-006X Google Scholar
A. Pittiget al.,
“Heart rate and heart rate variability in panic, social anxiety, obsessive—compulsive, and generalized anxiety disorders at baseline and in response to relaxation and hyperventilation,”
Int. J. Psychophysiol., 87
(1), 19
–27
(2013). http://dx.doi.org/10.1016/j.ijpsycho.2012.10.012 IJPSEE 0167-8760 Google Scholar
T. NiendorfL. WinterT. Frauenrath,
“Electrocardiogram in an MRI environment: clinical needs, practical considerations, safety implications, technical solutions and future directions,”
Advances in Electrocardiograms—Methods and Analysis, 309
–324 InTech, Rijeka, Croatia
(2012). Google Scholar
M. Życzkowskiet al.,
“Interferometric fiber optics based sensor for monitoring of the heart activity,”
Acta Phys. Pol. A, 120
(4), 782
–784
(2011). ATPLB6 0587-4246 Google Scholar
F. C. FaveroJ. VillatoroV. Pruneri,
“Microstructured optical fiber interferometric breathing sensor,”
J. Biomed. Opt., 17
(3), 037006
(2012). http://dx.doi.org/10.1117/1.JBO.17.3.037006 JBOPFO 1083-3668 Google Scholar
D. ZazulaD. ĐonlagićS. Šprager,
“Application of fibre-optic interferometry to detection of human vital signs,”
J. Laser Health Acad., 1 27
–32
(2012). Google Scholar
S. ŠpragerD. Zazula,
“Heartbeat and respiration detection from optical interferometric signals by using a multimethod approach,”
IEEE Trans. Biomed. Eng., 59
(10), 2922
–2929
(2012). http://dx.doi.org/10.1109/TBME.2012.2213302 IEBEAX 0018-9294 Google Scholar
S. ŠpragerD. Zazula,
“Detection of heartbeat and respiration from optical interferometric signal by using wavelet transform,”
Comput. Methods Programs Biomed.,
(2013). http://dx.doi.org/10.1016/j.cmpb.2013.03.003 CMPBEKx 0169-2607 Google Scholar
M. Zyczkowskiet al.,
“Using modalmetric fiber optic sensors to monitor the activity of the heart,”
Proc. SPIE, 7894 789404
(2011). http://dx.doi.org/10.1117/12.873379 PSISDG 0277-786X Google Scholar
L. Dziudaet al.,
“Fiber-optic sensor for monitoring respiration and cardiac activity,”
413
–416
(2011). Google Scholar
L. Dziudaet al.,
“Monitoring respiration and cardiac activity using fiber Bragg grating-based sensor,”
IEEE Trans. Biomed. Eng., 59
(7), 1934
–1942
(2012). http://dx.doi.org/10.1109/TBME.2012.2194145 IEBEAX 0018-9294 Google Scholar
Z. Chenet al.,
“Smart pillow for heart-rate monitoring using a fiber optic sensor,”
Proc. SPIE, 7894 789402
(2011). http://dx.doi.org/10.1117/12.871208 PSISDG 0277-786X Google Scholar
Z. Chenet al.,
“Portable fiber optic ballistocardiogram sensor for home use,”
Proc. SPIE, 8818 82180X
(2012). http://dx.doi.org/10.1117/12.909768 PSISDG 0277-786X Google Scholar
C. J. Deepuet al.,
“A smart cushion for real-time heart rate monitoring,”
in IEEE BioCAS Conf. Proc.,
53
–56
(2012). Google Scholar
J. De jonckheere,
“OFSETH: Optical fibre embedded into technical textile for healthcare, an efficiency way to monitor patient under magnetic resonance imaging,”
in IEEE EMBS Conf. Proc.,
3950
–3953
(2007). Google Scholar
L. T. D'Angeloet al.,
“A system for respiratory motion detection using optical fibers embedded into textiles,”
in IEEE EMBS Conf. Proc.,
3694
–3697
(2008). Google Scholar
J. De jonckheereet al.,
“FBG-based smart textiles for continuous monitoring of respiratory movements for healthcare applications,”
in IEEE Healthcom Conf. Proc.,
277
–282
(2010). Google Scholar
J. De jonckheereet al.,
“Optical fibre sensors embedded into technical textile for a continuous monitoring of patients under magnetic resonance imaging,”
in IEEE EMBS Conf. Proc.,
5266
–5269
(2008). Google Scholar
F. Narbonneauet al.,
“OFSETH: Optical technologies embedded in smart medical textile for continuous monitoring of respiratory motions under magnetic resonance imaging,”
Proc. SPIE, 7715 7715D-1
(2010). http://dx.doi.org/10.1117/12.854386 PSISDG 0277-786X Google Scholar
J. De jonckheereet al.,
“OFSETH: a breathing motions monitoring system for patients under MRI,”
in IEEE EMBS Conf. Proc.,
1016
–1019
(2010). Google Scholar
K. Krebberet al.,
“Smart technical textiles with integrated POF sensors,”
Proc. SPIE, 6933 69330V
(2008). http://dx.doi.org/10.1117/12.776758 PSISDG 0277-786X Google Scholar
A. Grilletet al.,
“Optical fiber sensors embedded into medical textiles for healthcare monitoring,”
IEEE Sens. J., 8
(7), 1215
–1222
(2008). http://dx.doi.org/10.1109/JSEN.2008.926518 ISJEAZ 1530-437X Google Scholar
J. Wittet al.,
“Smart medical textiles with embedded optical fibre sensors for continuous monitoring of respiratory movements during MRI,”
Proc. SPIE, 7653 76533B
(2010). http://dx.doi.org/10.1117/12.866434 PSISDG 0277-786X Google Scholar
C. Zhanget al.,
“Smart textile sensing system for human respiration monitoring based on fiber Bragg grating,”
Proc. SPIE, 7381 738104
(2009). http://dx.doi.org/10.1117/12.834970 PSISDG 0277-786X Google Scholar
W. Jae Yooet al.,
“Development of respiration sensors using plastic optical fiber for respiratory monitoring inside MRI system,”
J. Opt. Soc. Korea, 14
(3), 235
–239
(2010). http://dx.doi.org/10.3807/JOSK.2010.14.3.235 1226-4776 Google Scholar
A. F. Silvaet al.,
“Simultaneous cardiac and respiratory frequency measurement based on a single fiber Bragg grating sensor,”
Meas. Sci. Technol., 22
(7), 075801
(2011). http://dx.doi.org/10.1088/0957-0233/22/7/075801 MSTCEP 0957-0233 Google Scholar
T. Allsopet al.,
“Respiratory function monitoring using a real-time three-dimensional fiber-optic shaping sensing scheme based upon fiber Bragg gratings,”
J. Biomed. Opt., 17
(11), 117001
(2012). http://dx.doi.org/10.1117/1.JBO.17.11.117001 JBOPFO 1083-3668 Google Scholar
J. Haoet al.,
“FBG-based smart bed system for healthcare applications,”
Front. Optoelectron. China, 3
(1), 78
–83
(2010). http://dx.doi.org/10.1007/s12200-009-0066-0 1674-4128 Google Scholar
M. Majumderet al.,
“Fibre Bragg gratings in structural health monitoring—present status and applications,”
Sensor. Actuator. A Phys., 147
(1), 150
–164
(2008). http://dx.doi.org/10.1016/j.sna.2008.04.008 SAAPEB 0924-4247 Google Scholar
L. Dziudaet al.,
“Hybrid fiber optic voltage sensor for remote monitoring of electrical submersible pump motors,”
Opt. Eng., 44
(6), 064401
(2005). http://dx.doi.org/10.1117/1.1926947 OPEGAR 0091-3286 Google Scholar
E. Al-Fakihet al.,
“The use of fiber Bragg grating sensors in biomechanics and rehabilitation applications: the state-of-the-art and ongoing research topics,”
Sensors, 12
(10), 12890
–12926
(2012). http://dx.doi.org/10.3390/s121012890 SNSRES 0746-9462 Google Scholar
R. A. Bettset al.,
“Nonlinear refractive index in erbium doped optical fiber: theory and experiment,”
IEEE J. Quant. Electron., 27
(4), 908
–913
(1991). http://dx.doi.org/10.1109/3.83325 IEJQA7 0018-9197 Google Scholar
, “Optical sensing interrogator sm130,” Micron Optics Technical Information,
(2010) http://www.micronoptics.com/ Google Scholar
Invivo International, “Precess (model 3160) MRI patient monitoring system,” Invivo Technical Data Sheet,
(2010) http://www.invivocorp.com/ Google Scholar
K. Younghoet al.,
“Evaluation of unconstrained monitoring technology used in the smart bed for u-Health environment,”
Telemed. J. e-Health, 17
(6), 435
–441
(2011). http://dx.doi.org/10.1089/tmj.2010.0211 1530-5627 Google Scholar
J. M. BlandD. G. Altman,
“Statistical methods for assessing agreement between two methods of clinical measurement,”
Lancet, 327
(8476), 307
–310
(1986). http://dx.doi.org/10.1016/S0140-6736(86)90837-8 LANCAO 0140-6736 Google Scholar
J. M. BlandD. G. Altman,
“Measuring agreement in method comparison studies,”
Stat. Meth. Med. Res., 8
(2), 135
–160
(1999). http://dx.doi.org/10.1191/096228099673819272 0962-2802 Google Scholar
R. S. GubnerM. RodsteinH. E. Ungerleider,
“Ballistocardiography: an appraisal of technic, physiologic principles, and clinical value,”
Circulation, 7 268
–286
(1953). http://dx.doi.org/10.1161/01.CIR.7.2.268 CIRCAZ 0009-7322 Google Scholar
O. T. Inanet al.,
“Robust ballistocardiogram acquisition for home monitoring,”
Phys. Meas., 30
(2), 169
–185
(2009). http://dx.doi.org/10.1088/0967-3334/30/2/005 PMEAE3 0967-3334 Google Scholar
O. T. Inanet al.,
“Noninvasive measurement of physiological signals on a modified home bathroom scale,”
IEEE Trans. Biomed. Eng., 59
(8), 2137
–2143
(2012). http://dx.doi.org/10.1109/TBME.2012.2186809 IEBEAX 0018-9294 Google Scholar
L. Giovangrandiet al.,
“Ballistocardiography–a method worth revisiting,”
in IEEE EMBS Conf. Proc.,
4279
–4282
(2011). Google Scholar
W. H. Bancroft Jr.,
“Kinetocardiography: past and present,”
Bibl. Cardiol., 37 58
–72
(1979). BCSCAL 0067-7906 Google Scholar
R. Maniewski, Magnetic Examinations of Electrical and Mechanical Cardiac Activity, Ossolineum, Wroclaw
(1987). Google Scholar
M. NishyamaM. MiyamotoK. Watanabe,
“Respiration and body movement analysis during sleep in bed using hetero-core fiber optic pressure sensors without constraint to human activity,”
J. Biomed. Opt., 16
(1), 017002
(2011). http://dx.doi.org/10.1117/1.3528008 JBOPFO 1083-3668 Google Scholar
O. T. InanG. T. KovacsL. Giovangrandi,
“Evaluating the lower-body electromyogram signal acquired from the feet as a noise reference for standing ballistocardiogram measurements,”
IEEE Trans. Inform. Technol. Biomed., 14
(5), 1188
–1196
(2010). http://dx.doi.org/10.1109/TITB.2010.2044185 ITIBFX 1089-7771 Google Scholar
R. M. Wiardet al.,
“Automatic detection of motion artifacts in the ballistocardiogram measured on a modified bathroom scale,”
Med. Biol. Eng. Comput., 49
(2), 213
–220
(2011). http://dx.doi.org/10.1007/s11517-010-0722-y MBECDY 0140-0118 Google Scholar
|