|
|
|
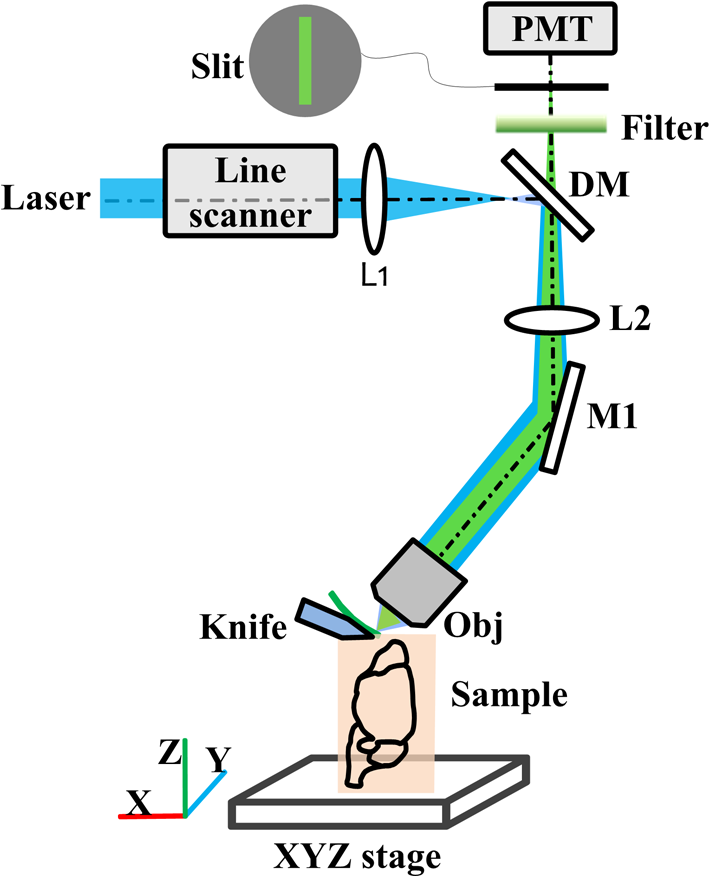
Mapping neuronal circuits is essential for understanding the brain function.1,2 In neuronal circuits, the nerve fiber connecting one cell to another is as thin as a submicron, and some extend broadly across the whole brain. To obtain single-fiber-resolution neuronal connectivity, optical imaging with submicron resolution is a powerful tool.3 However, it is difficult to obtain whole mouse brain images by regular confocal or two-photon microscopy, mainly due to the intrinsic light scattering.4 With optical clearing and confocal detection, light-sheet imaging that provided 2 μm in lateral and 9 μm in axial resolution might be a good candidate.5 Using a vibratome, serial-two-photon tomography is capable of full three-dimensional (3-D) comprehensive imaging and presented data of an entire mouse olfactory bulb. Moreover, it provided an optical section () in every 50-μm-thick slice of a fluorescent whole mouse brain6; this method shows new potential. However, a truly effective way to solve light scattering and improve the image contrast is to mechanically slice the specimen into thin sections and before imaging. With a section thickness of 50 nm, the imaging results are better than any optical section.7 Serial sectioning and imaging simultaneously, the so-called knife-edge imaging strategy,8 greatly improves the speed and provides submicron 3-D resolution over a large volume very fast. Based on this strategy, a micro-optical sectioning tomography (MOST) system has been reported to gain a whole mouse brain atlas at submicron resolution with significantly improved signal-to-noise ratio, imaging precision, and stability.9 However, for more interesting applications involving molecularly labeled fluorescent samples, there is no report using knife-edge imaging technique. For these applications, an intuitive idea is to directly merge the fluorescence excitation and detection in the knife-edge imaging system. This can be readily implemented in a MOST system with its epi-detection microscope structure, e.g., switching to laser excitation and fluorescence detection, and replacing the diamond sectioning knife with an opaque one. The opaque knife can efficiently block the excitation light from passing through the knife, avoid excitation of the sample under the knife, and also block the potential background fluorescence from below the knife. Therefore, it provides good image contrast. However, during sectioning [Fig. 1(a)], tear burr10,11 occurs at the side interface as a result of tissue tearing loose from the bulk tissue rather than being sheared, resulting in an irregular edge (see Fig. 1(a), the left or right edge of the slice on the knife) where a small portion (micron-scale) of the tissue image is broken, which causes interruptions in laterally adjacent images [Fig. 1(b) and 1(c)]. Though this interface is small compared to the whole field of view, every nerve fiber passing this interface is broken. This artifact produces confusion in single fiber tracing, which ruins the entire neuronal circuits. Fig. 1(a) Schematic diagram of sectioning and imaging; tear burr occurs at the lateral edge of the slice; some part of slice stretches out over the knife side. (b) An example of stitched fluorescence image of two adjacent slices. Scale bar, 15 μm. (c) Enlarged view of the region marked in (b), demonstrating connection loss of nerve fibers. Scale bar, 5 μm.  The tear burrs stretched out over the side of the knife. This portion of tissue is still within the imaging field of view, while its signal is drowned in the strong fluorescence background from the adjacent bulk tissue beneath the knife. Using a confocal concept3,12 that an aperture (here, a slit) can be placed at conjugate focal plane in front of the detector, the slit will act as a spatial filter and can effectively block background signal not present in the tissue tear burrs at the edge. In this way, we combined mechanical sectioning and confocal detection to restore the signal of the slice at the lateral edge and recover the fiber connections. The schematic diagram of the fluorescent micro-optical sectioning tomography is shown in Fig. 2. The setup consists of a laser scanning fluorescence microscopy, and a microtome, and works in the serial sectioning and imaging strategy. A laser beam (488 nm, 100 mw, continuous wave mode, Sapphire), used as excitation light source, passed a beam expander and a line scanner for -axis scanning, and a scanning lens (L1, ), a tube lens (L2, ), an objective (LUMPFLN , Olympus) to excite a line (along axis, see the coordinate and arrow in Fig. 1(a)) of the specimen walking on an opaque diamond knife (Diatome AG, Switzerland). The excited fluorescence was collected using the same objective and detected using a photomultiplier tube (PMT, R1924A, Hamamatsu), working with a data acquisition card (PXI-5122, National Instruments). The pixel dwell time is . A slit () is placed in front of the PMT, located at the conjugate position of the focal plane of the objective. The specimen was sectioned and moved along the axis using a 3-D precise motion platform (3AXES motion stage, AEROTECH). Therefore, one strip of two-dimensional () fluorescence signal was recorded (see Fig. 1(a) for directions). Then the microtome was stepped in the direction and sliced the adjacent strip with the aid of the platform, and the strip was imaged again. After recording the whole section of the specimen, the platform was moved along the axis to another section, and the aforementioned process was repeated to acquire the whole 3-D fluorescence signal of the specimen. At last, 3-D volumetric images can be reconstructed by aligning the images of each serial section. In our case, the imaging site is about 10 microns from the knife-edge, e.g., about 7 microns from the background bulk tissue for the worst case of imaging the tissue extending outside the knife. With practical experiments, we found a proper slit width of 50 μm can give good balance between the signal intensity and the signal-to-background ratio (SBR) for our experiments to resolve the thin nerve fiber. We followed the method described earlier3 to measure the light intensity changes at the different axis locations by moving a reflection mirror away from the focus of objective and observed that with this slit, the signal intensity decreases quickly with defocus distance (approximately half at 2.0 um out-of-focus distance). This confirmed that this slit can effectively reject background fluorescence in our system. To demonstrate the improved detectability of neuronal connections with confocal detection, we compared images obtained using the system in Fig. 2 in the mode with and without the slit. The sample is brain tissue from a B6.Cg-Tg(Thy1-EGFP)MJrs/J transgenetic mouse (male, adult) in which a variety of neuronal subsets are labeling with green fluorescence protein.13 The fluorescent tissue is plastically embedded using glycol methacrylate water-soluble resin (Ted Pella Inc., USA) to maintain the fluorescence property and ensure its rigidity for ultrathin sectioning. The pixel resolution is for and , and 2 μm for axis. To reliably show the thin and long nerve fibers, the slices of 100 μm are made of 50 sections, and each section has a 2-μm thickness to provide good image contrast to resolve the nerve fibers. Figure 3 shows such a comparison. Figure 3(a) is the stitched fluorescence image of two adjacent slices (separated by the dashed line) obtained without confocal detection. The image is a maximum intensity projection image. The nerve fibers are clear in the main area but remain unresolved and not connected between two adjacent strips (see the dashed line and the arrow). However, in Fig. 3(b) with confocal detection (slit ), the SBR significantly increases. The nerve fibers can be clearly distinguished from the background and effectively connected between two adjacent strips. The artifact in the middle part of the image was caused by the residual fluorescence background from the uncut tissue that was not eliminated by the confocal slit. For the other part of the image, this residual fluorescence background was actually blocked by the sectioning blade. Figure 3(c) shows two intensity profiles along the lines in Fig. 3(a) and 3(b). The SBR of nerve fibers is 0.06 to 0.09 without confocal slit, while rising up to 1.44 to 2.95 with a 50-μm slit width, which is 16-to-49-fold higher than those without the slit. Furthermore, Fig. 4 shows 3-D rendering of a brain tissue block in size of , with long nerve fibers. Fig. 3Stitched fluorescence image of two adjacent slices of 100 μm (50 sections, 2 μm section thickness) maximum projection. (a) Without slit, nerve fibers cannot be connected. (b) With slit, nerve fibers are effectively connected. (c) Intensity profiles along the dashed lines in (a) and (b). Scale bar, 10 μm, insert: 5 μm.  In this comparison, nerve fiber structures of similar intensity from different slices rather than the same slice are imaged, as once a slice is sectioned and imaged, it is destroyed and cannot be reimaged reversibly. This comparison is acceptable, as we focus on the connectivity of nerve fiber; fibers of the same intensity but at different locations share similar result. The slit width may change depending on specific samples and applications.12 Though we tried the size given by the theoretical prediction, we actually determined it by tuning the slit size when imaging the actual specimen. For the specimen in this paper, a slit width was 50 μm to make most of the nerve fibers of the whole mouse brain specimen efficiently connected. The 2-μm section thickness is a balance between the speed and the concern to provide good image contrast to resolve the nerve fibers, as thin sections linearly increase the image time. We imaged adjacent tissue sections, and without image resizing and shifting, the images of adjacent tissue sections could be aligned. There existed a small amount of misalignment, which can be seen from the neural fibers at the edge. The misalignment is about 1 to 2 pixels in size, which is about 0.5 to 1 μm. However, compared to the 3 to 15 microns tear burrs caused by the cut, the one pixel size distortion did not cause notable effect on the projection tracking. This technique relies on confocal detecting to generate image contrast of interested structures from background. With unlabeled samples of confocal imaging, it is still suitable. In summary, fluorescence background from bulk specimen can be significantly rejected by introducing confocal detection into the fluorescence micro-optical section tomography system. With a proper slit width decided by experiments, the nerve fiber in the deckle edge area is recovered to form a solid connection, which is important for tracking neuronal connectivity with submicron resolution. With the proposed confocal detection scheme, combining the development of a plastic embedding method for large-volume and fluorescent-protein-expressing tissues,14 fast and stable scanning and imaging strategy, a digital reconstruction method for tracing the axonal pathways in the mouse brain, we have done neuronal projection tracking across a whole mouse brain.15 We acquired several whole mouse brain datasets and found the technique to be able to recover most of the information buried in the tear burrs at the edge of the tissue stripes, which facilitate long-range neuronal projection tracking. These results were discussed elsewhere.15 AcknowledgmentsThis work was supported by the National Basic Research Program of China (No. 2011CB910401) and the Natural Science Foundation of China (Nos. 30925013, 61121004, and 2010DFR30820). The authors thank Professor Duan Jun for manufacturing the slit and colleagues in Britton Chance Center for Biomedical Photonics (BC CBMP) for helpful discussions. ReferencesJ. W. LichtmanW. Denk,
“The big and the small: challenges of imaging the brain’s circuits,”
Science, 334
(6056), 618
–623
(2011). http://dx.doi.org/10.1126/science.1209168 SCIEAS 0036-8075 Google Scholar
J. DeFelipe,
“From the connectome to the synaptome: an epic love story,”
Science, 330
(6008), 1198
–1201
(2010). http://dx.doi.org/10.1126/science.1193378 SCIEAS 0036-8075 Google Scholar
J. A. ConchelloJ. W. Lichtman,
“Optical sectioning microscopy,”
Nat. Methods, 2
(12), 920
–931
(2005). http://dx.doi.org/10.1038/nmeth815 1548-7091 Google Scholar
M. Oheimet al.,
“Two-photon microscopy in brain tissue: parameters influencing the imaging depth,”
J. Neurosci. Methods, 111
(1), 29
–37
(2001). http://dx.doi.org/10.1016/S0165-0270(01)00438-1 JNMEDT 0165-0270 Google Scholar
L. Silvestriet al.,
“Confocal light sheet microscopy: micron-scale neuroanatomy of the entire mouse brain,”
Opt. Express, 20
(18), 20582
–20598
(2012). http://dx.doi.org/10.1364/OE.20.020582 OPEXFF 1094-4087 Google Scholar
T. Raganet al.,
“Serial two-photon tomography for automated ex vivo mouse brain imaging,”
Nat. Methods, 9
(3), 255
–258
(2012). http://dx.doi.org/10.1038/nmeth.1854 1548-7091 Google Scholar
K. D. MichevaS. J. Smith,
“Array tomography: a new tool for imaging the molecular architecture and ultrastructure of neural circuits,”
Neuron, 55
(1), 25
–36
(2007). http://dx.doi.org/10.1016/j.neuron.2007.06.014 NERNET 0896-6273 Google Scholar
D. MayerichL. AbbottB. McCormick,
“Knife-edge scanning microscopy for imaging and reconstruction of three-dimensional anatomical structures of the mouse brain,”
J. Microsc., 231
(1), 134
–143
(2008). http://dx.doi.org/10.1111/jmi.2008.231.issue-1 JMICAR 0022-2720 Google Scholar
A. Liet al.,
“Micro-optical sectioning tomography to obtain a high-resolution atlas of the mouse brain,”
Science, 330
(6009), 1404
–1408
(2010). http://dx.doi.org/10.1126/science.1191776 SCIEAS 0036-8075 Google Scholar
L. K. GillespieP. T. Blotter,
“Formation and properties of machining burrs,”
J. Manuf. Sci. Eng., 98
(1), 66
–74
(1976). http://dx.doi.org/10.1115/1.3438875 0022-0817 Google Scholar
J. Kwonet al.,
“Automated lateral sectioning for knife-edge scanning microscopy,”
in Proc. of the IEEE Int. Symp. on Biomedical Imaging: From Nano to Macro,
1371
–1374
(2008). Google Scholar
M. Minsky,
“Memoir on inventing the confocal scanning microscope,”
Scanning, 10
(4), 128
–139
(1988). http://dx.doi.org/10.1002/sca.v10:4 SCNNDF 0161-0457 Google Scholar
G. Fenget al.,
“Imaging neuronal subsets in transgenic mice expressing multiple spectral variants of GFP,”
Neuron, 28
(1), 41
–51
(2000). http://dx.doi.org/10.1016/S0896-6273(00)00084-2 NERNET 0896-6273 Google Scholar
Z. Yanget al.,
“Development of a plastic embedding method for large-volume and fluorescent-protein-expressing tissues,”
PLoS One, 8
(4), e60877
(2013). http://dx.doi.org/10.1371/journal.pone.0060877 1932-6203 Google Scholar
H. Gonget al.,
“Continuously tracing brain-wide long-distance axonal projections in mice at a one-micron voxel resolution,”
Neuroimage, 74 87
–98
(2013). http://dx.doi.org/10.1016/j.neuroimage.2013.02.005 NEIMEF 1053-8119 Google Scholar
|