|
|
1.IntroductionRetinal hemoglobin oxygen saturation () is a key parameter characterizing the pathophysiological status of the posterior eye. An abnormal level in retinal blood may indicate pathologic changes caused by diseases, such as diabetes, retinopathy of prematurity, and photoreceptor degeneration.1 Without treatment, or with late treatment, these diseases can further impair vision and even cause blindness.2 Accurately measuring retinal provides an opportunity to detect these blinding diseases in their early stages for immediate medical attention and to help prevent severe vision loss. In the past decades, several groups have tried to determine the best method to measure retinal noninvasively, which is now referred to as retinal oximetry.1,3–7 A common feature among all the reported designs is the examination of intensity variations in the fundus images at several optical wavelengths. These variations are usually caused by wavelength-dependent optical properties of retinal tissue and pigments including, for example, the oxygenated and deoxygenated hemoglobin ( and HbR) and melanin. Hickam et al.8 applied two wavelengths (510 and 640 nm) for measurement. After acquiring the reflection intensities from the vessels and retinal background (adjacent areas without vessels), they estimated optical density and further estimated in retinal arteries and veins, but the accuracy of the dual-wavelength method suffered from optical scattering. Additional optical wavelengths were later employed to compensate for optical scattering. For example, Delori9 used three narrowly separated wavelengths and obtained improved results by compensating for the wavelength-independent scattering. Lompado et al.10 built a scanning laser ophthalmoscope and used four wavelengths for retinal imaging. Later, even more wavelengths were used3,4,11 in retinal oximetry in other groups. Recently, optical coherence tomography (OCT) was also used for detection12,13 by extracting optical absorption information of and HbR from wideband back-reflected light. Although promising results were obtained in phantom experiments,12,14 OCT has not yet been demonstrated for retinal . Despite the efforts to develop and improve retinal oximetry, many limitations still exist.7 The accuracy of retinal oximetry is affected by factors such as variations in vessel size15 and pigmentation,6 multiple light paths16,17 and vessel wall thickness,7 and others. Variations in vessel size and pigmentation are considered to have a major impact on the accuracy of measurement.7 In larger vessels, a much greater amount of backscattered light can be detected than in smaller vessels;17 hence, the calculation of optical density and values can be seriously affected. Moreover, variations in induce changes in vessel diameter,7 which further alters the amount of backscattered light from the vessel and, consequently, the measurement of . Because fundus melanin has wavelength-dependent optical scattering and absorption properties,7 backscattered photons from retinal background can be affected differently at different optical illumination wavelengths, thereby leading to biased estimation of optical density and errors in . To improve the accuracy of measurement, researchers are focusing on developing algorithms to compensate for the effects of these factors in retinal oximetry.4,6 Before developing effective compensation algorithms, it is imperative to understand how vessel diameter and melanin concentration in the retinal pigment epithelium (RPE) affect the accuracy of measurement in order to determine whether it is feasible to compensate for these factors and how to accomplish it. In this work, we used a Monte Carlo simulation of photon transport18 to acquire reflectance images of a retinal region at several optical wavelengths. Then we followed the reported methodology4 to calculate the optical density and of a simulated vessel segment. We varied the vessel diameter and the RPE melanin concentration independently to examine how they affect the relative error in measurements. In our simulation, we fixed the value at 0.7 because retinal oximetry was shown to be accurate in arterial blood, especially highly oxygenated arterial blood.5 While attempting to identify how vessel diameter and RPE melanin concentration affect the reflection-based retinal oximetry, we also recorded the optical energy deposition inside the retinal vessel and calculated retinal using an optical absorption-based method, i.e., photoacoustic ophthalmoscopy (PAOM).19–22 PAOM measures the optical absorption properties of the two forms of hemoglobin by illuminating the eye with short laser pulses and detecting the induced ultrasonic waves. The amplitude of the detected ultrasonic wave is proportional to optical energy deposition, which is a product of molar extinction coefficient, local concentration of the optical absorbing pigment, and local optical fluence.19,23 To achieve a fair comparison between the two methods, we made the following assumptions: (1) both reflection-based retinal oximetry and PAOM have identical lateral resolution, which is determined by the optical quality of the eye and the illumination optical wavelength only. (2) Noises were not included in the respective methods when calculating retinal . This is because, on one hand, signal-to-noise ratios (SNRs) are high in both fundus photography6 and PAOM;23 on the other hand, we want to investigate how vessel size and retinal pigmentation affect measurement only. Adding noises may introduce unnecessary difficulty in separating different sources. (3) The axial resolution of PAOM is 23 μm (Refs. 24 and 25) and fundus photography has no axial resolution. 2.Methods and Materials2.1.Eye ModelWe modeled the eye as a sphere with four main anatomic layers [Fig. 1(a)], including retina, RPE, choroid, and sclera.17 Although there are several other retinal anatomic layers such as inner limiting membrane and Bush’s members, they are often optically thin in a normal eye and do not affect photon propagation as much as the RPE or choroid; therefore, we simplified our model by omitting those thin layers in our simulation. Figure 1(b) is the magnified view of the geometry in the simulation. Important physical parameters are pupil diameter: 7 mm;26 ocular diameter: 24.0 mm;27 retina thickness: 200 μm; RPE thickness: 10 μm; choroid thickness: 250 μm; and sclera thickness: 700 μm.17 A cylindrical vessel segment with wall thickness set as 10% of the corresponding vessel lumen diameter28 is placed 10 μm beneath the retina surface. Although this eye model is simplified, we believe it provides a good first-order approximation of retinal oximetry using fundus photography since it mainly measures major retinal vessels7 whose density vessels is low.29,30 Fig. 1Geometry of the eye model. (a) Size of the eyeball and optical illumination. (b) Thickness of each major layer in the simplified eye model with an embedded vessel segment.  The wavelength-dependent optical absorption coefficients of retina, vessel wall, choroid, and sclera are obtained from previous published data31,32 and are summarized in Table 1. The absorption coefficient of RPE is associated with melanin concentration and could be calculated as where is the melanin concentration in the RPE and is the molar extinction coefficient of melanin at wavelength .33 The optical absorption coefficient of blood () depends on level and can be estimated by where is the total hemoglobin concentration; (dimensionless) is the hemoglobin oxygen saturation level (set at 0.7 in the simulation); and are the molar extinction coefficients of and HbR, respectively; and 64,500 is the gram molecular weight of hemoglobin (). In our simulation, we used a typical value of for (Ref. 34). The wavelength-dependent molar extinction coefficients of and HbR, optical scattering coefficients, and anisotropy values of the four anatomic layers and blood were obtained from previous studies.31,32,35,36 All refractive index differences were neglected.17,37Table 1Optical parameters used in Monte Carlo simulation.
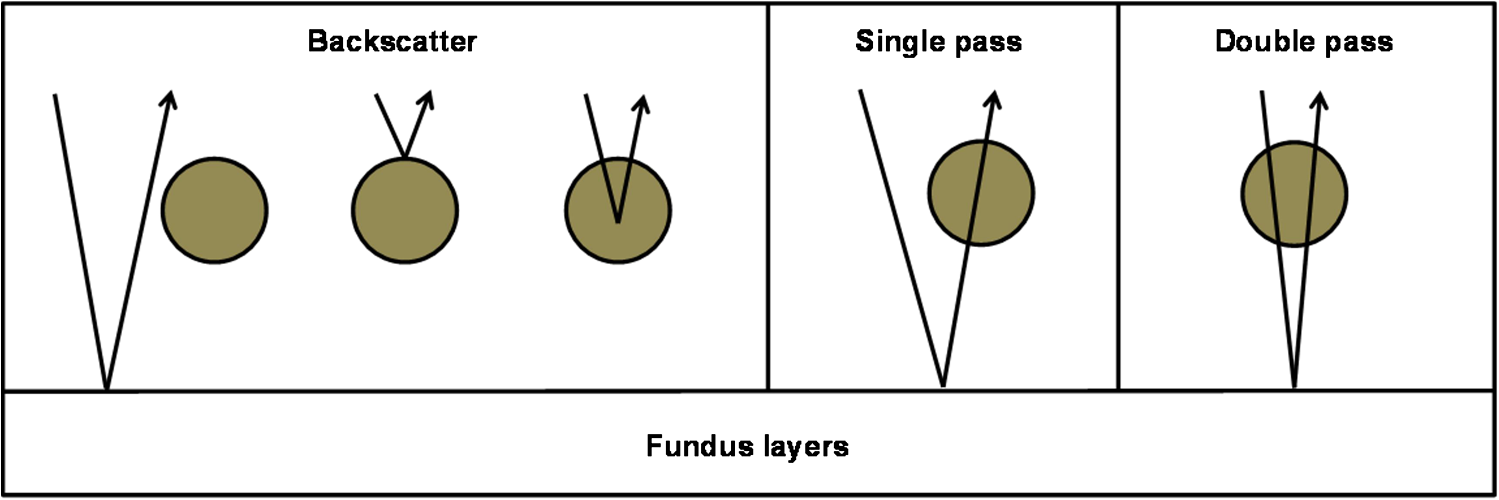
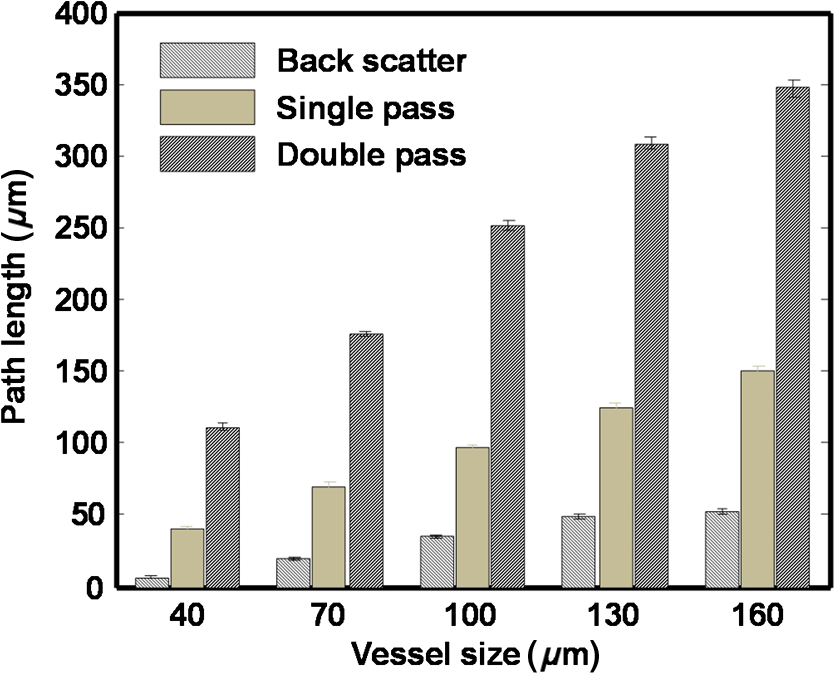
2.2.Monte Carlo SimulationMonte Carlo simulation of photon transport is a well-established method to investigate photon–tissue interactions.17,18 In this method, photon packets are launched and traced independently. After departing from the initial launching position, photon packets will propagate within tissue, encounter several scattering and absorbing events, and finally transmit/reflect out of the tissue or be completely absorbed. Repeating this process for large numbers of photon packets provides both optical energy deposition and optical reflection. In our work, prior to simulating for oximetry, we tested and confirmed the accuracy of our Monte Carlo code (MATLAB™, 2011b version) by comparing with literature data published by Wang et al.18 In the oximetry simulation, photon packets were launched at the center of the pupil within a 1.9-deg angle, where we evenly sampled the photon launching angle. To simulate PAOM, we recorded the absorbed photon packets within vessel at positions where absorption events occur. To simulate fundus camera, we analyzed every photon packet’s exit angle from the retina and only recorded photon packets that can propagate out of the pupil; we recorded these backscattered photon packets at locations where they re-emitted from the retina. When extracting reflection intensity from the center of the vessel in the fundus image to calculate optical density of the vessel, we divided the reflected photons into three groups (backscattered, single-pass, and double-pass groups) based on how they interact with the vessel (Fig. 2),17 which enables investigation of the different roles of these groups in measurement. We recorded the three groups independently and calculated the weights of backscatter (), single-pass (), and the double-pass () with respect to the total number of reflected photons (sum of all the photons in these three groups) used to calculate optical density. To investigate the influence of vessel diameter, we varied the vessel diameter from 40 to 160 μm at a step size of 30 μm. To investigate the influence of pigmentation, we varied the RPE melanin concentration from 4 to at a step size of , which covered the range of typical RPE melanin concentration in a healthy adult.38 We simulated six optical wavelengths (530, 540, 550, 560, 570, and 580 nm) within the spectral range from 500 to 600 nm, which are reported to be the most suitable for retinal oximetry.5,11 2.3.Calculation of in Reflection-Based OximetrySchweitzer et al.39 demonstrated a good compensation for light scattering and obtained reasonable results. In our study, we followed Schweitzer’s method to calculate in reflection-based oximetry. The optical density (OD) is defined as where is the reflection intensity from the background area and is the reflection intensity directly from the vessel. As shown in Fig. 3(a), was acquired by averaging the reflection intensities within the central region of the vessel highlighted by the dashed box in the middle. The width of the dashed box is 25% of the corresponding vessel diameter and the length is 200 μm. was acquired by averaging reflection intensities within the two neighboring areas (highlighted by the two dashed boxes on the sides), which have an identical size as the central region but is 50 μm away from the boundaries of the vessel. is associated with vessel and can be modeled by39 where and are parameters to compensate for the wavelength-independent and wavelength-dependent optical scattering; is the optical wavelength; is the experimental geometry factor; and is the vessel diameter. Equation (4) includes the effect from retinal vessel diameter but not retinal pigmentation, because fundus photography is able to directly measure vessel diameter with a high spatial resolution but unable to obtain retinal pigment concentration without some oversimplified assumptions.40 There are four unknown parameters in Eq. (4): , , , and ; hence, at least four optical wavelengths are needed to solve these parameters. Since we simulated six optical wavelengths, we applied a least-squares fit.Fig. 3Methods of data extraction for measurement. (a) An illustrative fundus image with the embedded vessel segment showing where reflection intensities are extracted in the reflection-based oximetry. (b) An illustrative cross-section of the embedded vessel showing where optical energy deposition is extracted in the absorption-based oximetry.  2.4.Calculation of in Absorption-Based Oximetry (PAOM)In absorption-based oximetry, we extracted optical energy deposition from the apex of the vessel [Fig. 3(b)] to estimate .21,23,41 As described by Zhang et al.,23 the optical absorption coefficient of blood could be expressed by where [HbR] and [] are concentrations of the deoxygenated and oxygenated hemoglobin, respectively. Considering that energy deposition is proportional to the local optical absorption coefficient, given no detection saturation (Ref. 42), could be replaced by when estimating the [HbR] and [] in relative values.23 As a result, we have where and is an unknown proportionality coefficient. Although is unknown, the calculated is absolute and is given by23To evaluate the accuracy of both the reflection- and absorption-based oximetry methods, we calculated and compared their relative errors (reflection) and (absorption) in measurements. The relative error is defined as where is the preset value of 0.7 in our eye model and is the measured value from the two oximetry methods.3.Results3.1.Stability of Numerical SimulationWe first determined the appropriate number of photon packets to be simulated in order to achieve stabilized calculations in both the reflection- and absorption-based methods because only a small portion of simulated photon packets can be recorded outside the pupil. We examined the stabilities of the OD in the reflection-based method and the normalized energy deposition in the absorption-based method. The normalized energy deposition is the ratio between the photons actually absorbed and the total photons launched. We varied the number of simulated photon packets from 0.5 to 200 million and collected 13 sets of data for each photon packet number to obtain statistical values (mean and standard deviation) of optical density and normalized energy deposition measurements. When the relative differences of both mean value and standard deviation between consecutive photon packet numbers were less than 5%, we concluded that we had a sufficient number of photon packets to stabilize the simulation results. According to the comparisons shown in Fig. 4(a) and 4(b), we found that 200 million photon packets were sufficient for our work. Using a 400-core supercomputer available at Northwestern University, simulating 200 million photon packets took less than an hour. Figure 4(c) and 4(d) shows a typical simulated reflection fundus image and a typical cross-section of optical energy deposition in the embedded vessel, respectively, where the RPE melanin concentration is , the illuminating optical wavelength is 560 nm, and the vessel diameter is 100 μm. Fig. 4Stability of Monte Carlo simulation. (a) Stability of calculated optical density with the number of simulated photons in the reflection-based oximetry. (b) Stability of energy deposition with the number of simulated photons in the absorption-based oximetry. (c) A representative simulated reflection intensity image using 200 million photons. (d) A representative simulated energy deposition image using 200 million photons.  3.2.Influence of Vessel DiameterTo investigate the influence of vessel diameter on calculation, we simulated both oximetry methods at five vessel diameters: 40, 70, 100, 130, and 160 μm. The RPE melanin concentration was kept constant at . Figure 5(a) shows the reflection intensity profiles for different vessel diameters at the position highlighted in Fig. 4(c) at 560 nm. We can observe that background regions have much higher reflection intensity due to the lack of blood absorption. Reflection intensity is lowest at the vessel center, and larger vessels usually have lower center reflection intensities than smaller vessels. Moreover, background reflection intensities have shown to be unaffected by vessel diameter. Figure 5(b) shows the optical energy deposition profiles for different diameters at the position highlighted in Fig. 4(d). We can observe the exponential decays of energy deposition inside the blood vessel when light propagated deeper, and the peak values of optical energy depositions are identical for all vessel diameters. Fig. 5Simulation results of (a) reflection-intensity profiles and (b) depth-resolved energy deposition decays within the vessel for different vessel diameters. 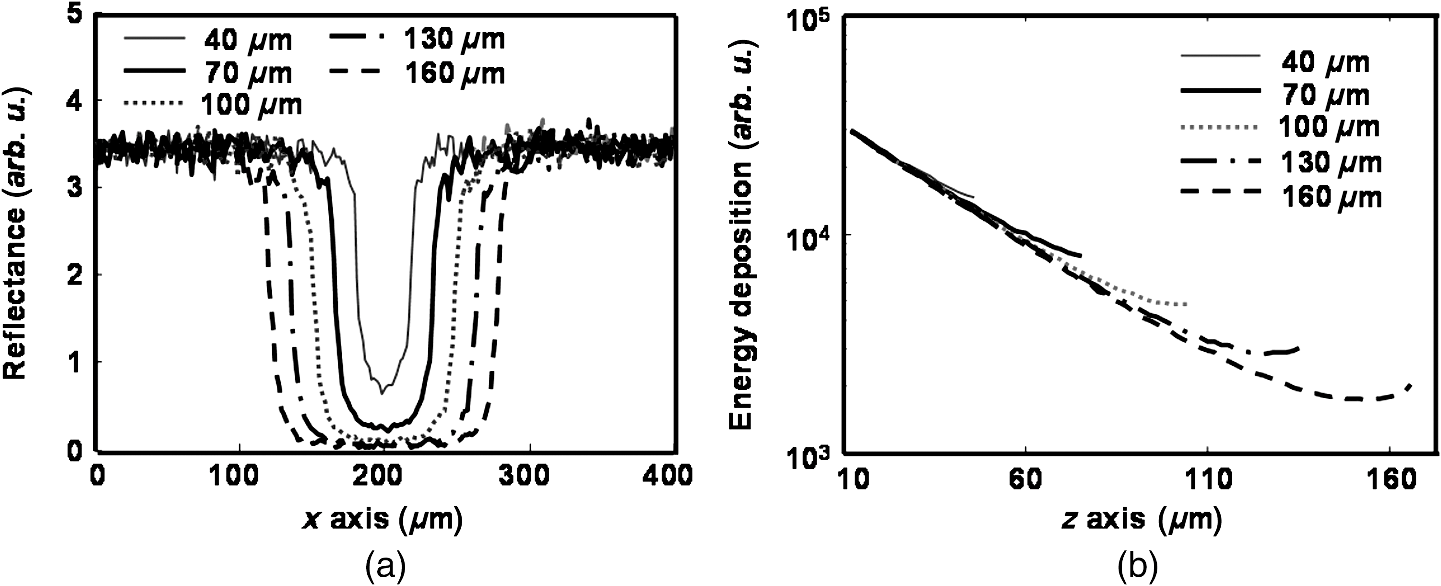 Figure 6 shows how vessel diameter affects the and and the weights of different photon groups (backscatter, single-pass, and double-pass). In Fig. 6(a), is almost constant and is close to zero for all vessel diameters. In comparison, becomes worse with increasing vessel diameter and can be up to when the vessel diameter is 160 μm. To investigate which photon group contributes the most to the enlarging , we examined the variations of relative weights of the three groups of photons versus vessel diameter. , , and represent the relative weights of backscattered, single-pass, and double-pass photons, respectively. As shown in Fig. 6(b), when the vessel diameter increases from 40 to 160 μm, increases from 49% to 74%, decreases from 40% to 24%, and decreases from 11% to 2%. Figure 6(b) suggests that more backscattered photons are detected in fundus photography when the vessel diameter becomes larger. These results agreed with the results reported by Hammer et al.6 Figure 6(c) compares how reflection intensities from the background and vessel change with increasing vessel diameter, where decreases in larger vessels and is insensitive to vessel diameter. Fig. 6The effect of vessel diameter on measurement in both absorption- and reflection-based oximetry methods. (a) Change of relative errors in measurement with vessel diameter. (b) Change of relative weights of the three photon groups with vessel diameter. (c) Change of reflection intensities from vessel and background region with vessel diameter.  3.3.Influence of RPE MelaninThe RPE melanin concentration is believed to affect reflection-based oximetry in a manner that is not well understood.38 We varied the RPE melanin concentration from 4 to (typical range for a normal adult) at a step size of in our model and simulated both oximetry methods. We kept the vessel diameter constant at 100 μm for all concentrations. Figure 7(a) shows the reflection intensity profiles for different melanin concentrations at the position highlighted in Fig. 4(c) at 560 nm. Only profiles for five different concentrations are plotted for cleaner visualization. Similar to Fig. 5(a), the reflection intensities are higher in the background regions than in the vessel. When melanin concentration increases, the reflection intensities in background regions become lower; but the reflection intensities in the vessel are unaffected. Figure 7(b) shows the optical energy deposition profiles inside the vessel, where we can observe identical exponential decay profiles independent from the RPE melanin concentration variation. Fig. 7Simulation results of (a) reflection-intensity profiles and (b) depth-resolved energy deposition decays within the vessel for different RPE melanin concentrations. 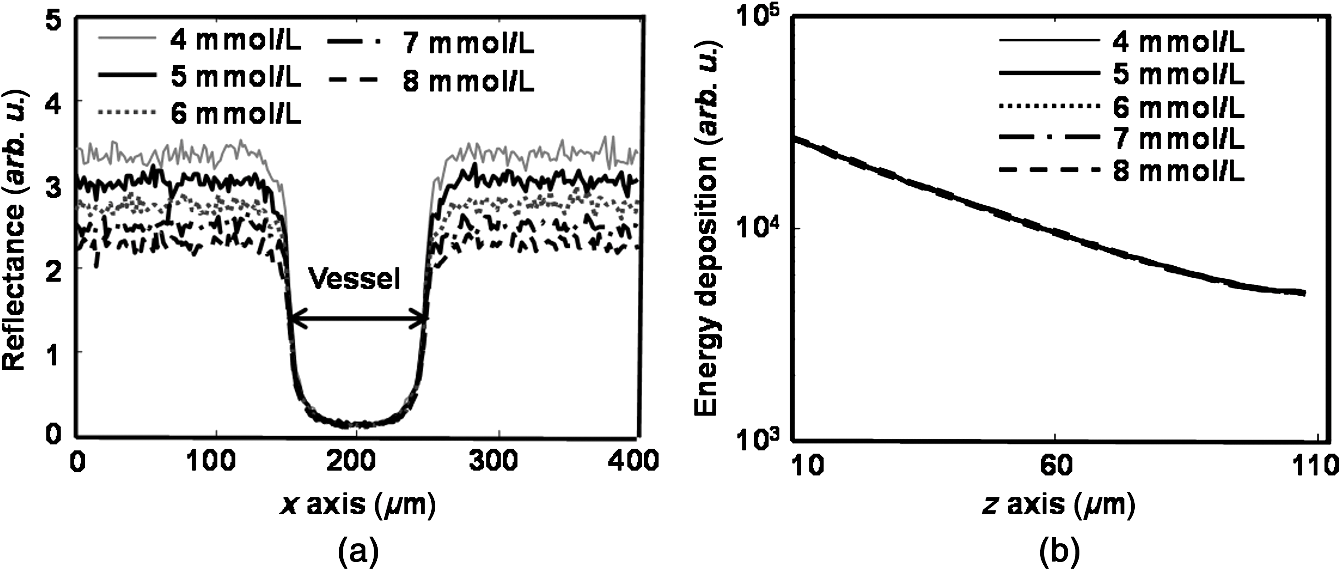 Figure 8 shows how the RPE melanin concentration affects and and the weights of different photon groups. As shown in Fig. 8(a), when the RPE melanin concentration increases from 4 to , is constantly below 1% while increases from 5% to more than 20%. Figure 8(b) shows how the three photon groups are affected by the RPE melanin concentration, where increases from 57% to 61%, decreases from 38% to 34%, and is almost the same (). Figure 8(c) shows that the reflection intensities from background decrease with higher RPE melanin concentration, while the reflection intensity from the vessel is insensitive to RPE melanin concentration. Fig. 8The effect of the RPE melanin concentration on measurement in both absorption- and reflection-based oximetry methods. (a) Change of relative errors in measurement with melanin concentration. (b) Change of relative weights of the three photon groups with melanin concentration. (c) Change of reflection intensities from vessel and background region with melanin concentration.  4.Discussion4.1.Weights of Different Photon GroupsAfter separating the detected photons at vessel center into three groups (backscatter, single-pass, and double-pass groups), as shown in Fig. 2, we can observe that they have different weights in the total intensity. Due to the properties of the three groups, the backscattered photons always dominate and the double-pass photons have the lowest weight [Figs. 6(b) and 8(b)] in the total detected reflection intensities. When we estimate the OD of a retinal vessel through reflection intensity, we need to retrieve optical attenuation due to hemoglobin absorption when the optical path length is the vessel diameter. We recorded the path lengths of the three groups of photons used for OD estimation at the vessel center (Fig. 9). Statistic results suggest that the mean path length of single-pass photons is close to the vessel diameter; the mean path length of double-pass photons is more than twice of the vessel diameter; and the mean path length of backscattered photons is much smaller than the vessel diameter. Thus, single-pass photons carry the most desirable information to accurately estimate OD. Compared with single-pass photons, double-pass photons have much longer path lengths than the vessel diameter; as a result, its intensity is attenuated more than expected and leads to an overestimation of OD. Backscattered photons, which is the dominate group, either do not or only partially interact with hemoglobin; thus, they carry random information about the vessel OD and lead to uncontrolled errors (usually underestimated OD). 4.2.Effects of Variations in Vessel DiameterVariations in vessel diameter affect measurement in the reflection-based oximetry through the reflection intensity in the vessel (). Change of vessel size can be observed in various diseases, including diabetic retinopathy43 and open-angle glaucoma.44 When vessel diameter increases, decreases to almost zero; however, the background reflection intensity () remains constant [Fig. 6(c)]. Among the three photon groups, and decrease by 16% and 8%, respectively [Fig. 6(b)], because larger vessel diameter leads to stronger attenuation for single-pass and double-pass photons due to a longer path length. In comparison, increases by 25% [Fig. 6(b)] because backscattered photons either do not interact or only partially interact with hemoglobin, which is not as much affected by the change of vessel diameter as the other two photon groups. Here we analyze how the variations in vessel diameter affect OD and, in consequence, . In theory, OD should be proportional to vessel size . To better analyze how different groups of photons affect measurement, we defined a normalized OD (NOD) as Two factors affect measurement: (1) the percentages of photons causing over- and underestimated NOD (i.e., and ) associated with vessel diameter variation and (2) the optical wavelengths applied during data acquisition. When the vessel diameter increases, some of the effects caused by under- and overestimated NOD may cancel each other; however, because the increasing is much higher than the decreasing [Fig. 6(b)], the overall effect of enlarging the vessel diameter is an underestimated NOD, as shown in Fig. 10(a). Fig. 10(a) Change of normalized optical density with vessel diameter. (b) Change of relative error in measurement with normalized optical density when the RPE melanin concentration is fixed. (c) Change of optical density with melanin concentration. (d) Change of relative error in measurement with optical density when the vessel diameter is fixed. 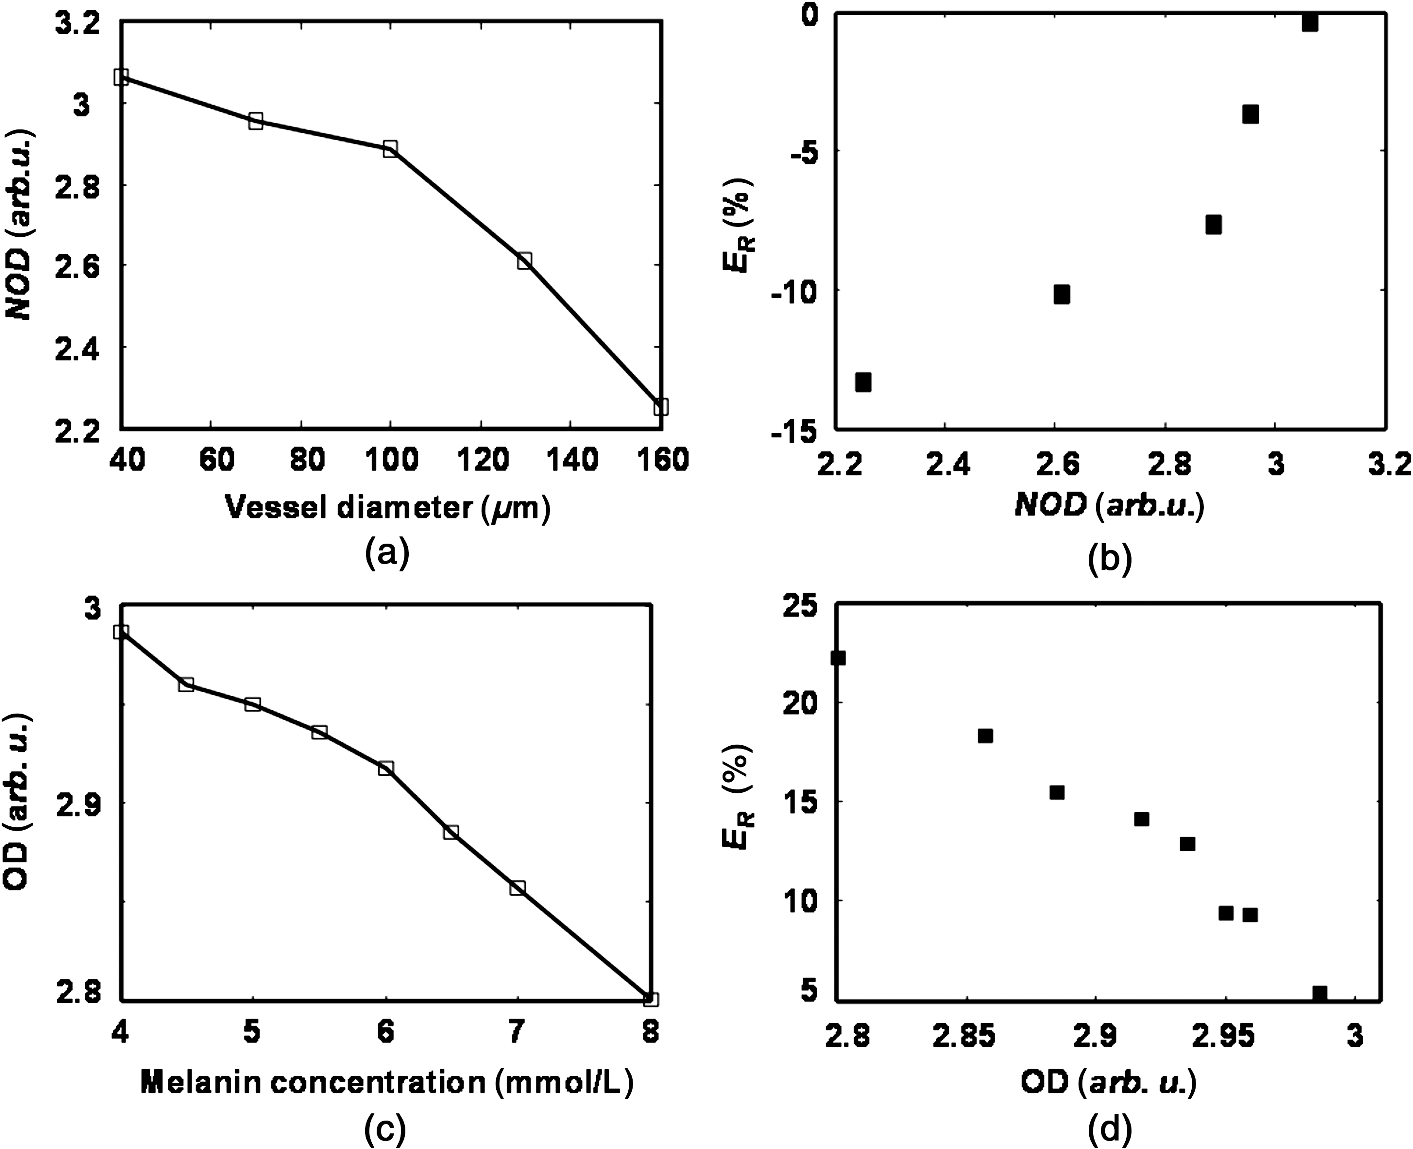 How the NOD affects measurement depends on the optical wavelengths, which can be derived from Eq. (9). [] is the total concentration of hemoglobin, which is a constant. For underestimated NOD (smaller than the true value), the value of is also underestimated. If is higher than at all the optical wavelengths used for imaging, to achieve a smaller , the estimated should be higher than the true value, resulting in an overestimated value. On the other hand, if is higher than at all the optical wavelengths used for imaging, will be underestimated. Since almost all the retinal oximetry methods use optical wavelengths on both sides of the isosbestic points of and , i.e., can be higher than at some optical wavelengths but lower at others, it is hard to reach a simple conclusion on the relationship between NOD and . In our study using six different optical wavelengths (530, 540, 550, 560, 570, and 580 nm), we found that an underestimated NOD leads to an overestimated , as shown in Fig. 10(b). 4.3.Effects of Variations in RPE Melanin ConcentrationVariations in the RPE melanin concentration affect measurement in the reflection-based oximetry through . RPE melanin concentration was reported to decrease with age, and the reduction could be up to 62.2%.45 When RPE melanin concentration increases, more photons from the background regions are absorbed, which reduces . Meanwhile, remains almost constant (from 0.1423 to 0.1167, because a very limited number of single- and double-pass photons are absorbed by the melanin), as shown in Fig. 8(c). Unlike what is shown in Fig. 6(b), when the RPE melanin concentration increases, increases by only 4%, decreases by only 4%, and is unaffected [Fig. 8(b)], indicating that errors in measurements are mainly caused by errors in OD as a result of varying . A higher RPE melanin concentration leads to an underestimated OD. According to Fig. 8(c), we can neglect the influence of RPE melanin on . In an ideal situation when photon path length within vessel equal to , Eq. (3) can be rewritten as where is the optical path length in the RPE and is the melanin concentration in the RPE. After neglecting the effect of vessel size on , the first term in Eq. (11) should provide an accurate OD, which contributes to an accurate estimation and is unaffected by the RPE melanin. The second term in Eq. (11) is the contribution from the RPE melanin, which decreases OD when increases. According to Eq. (11), OD reduces linearly with respect to melanin concentration, which is verified by the simulation [Fig. 10(c)]. As a result, the combining effect of the two terms in Eq. (11) leads to an underestimated with increasing RPE melanin concentration [Fig. 10(d)]. Equation (11) also suggests that retinal pigmentation can potentially be linearly compensated for.5.Future WorkA more comprehensive investigation should be conducted to better understand how the changing OD affects the measurement. Currently, when we investigated the effects of local parameters on , we varied only one parameter and fixed the other. As can be observed in Figs. 6(a) and 8(a), vessel diameter and RPE melanin concentration have opposite effects on OD and the accuracy of measurement; therefore, a combined effect of the two parameters should be investigated. Once we better understand the source of error in the reflection-based oximetry, we will investigate the possibility of designing a compensational algorithm to improve the accuracy.6 It is reasonable to predict that compensating for vessel diameter is relatively easier than compensating for the RPE melanin, because vessel diameter can be measured with high accuracy but the melanin concentration cannot. To compensate for vessel diameter, we may need to consider the relationship of and with the vessel diameter. Before calculating OD, can potentially be modified to emphasize single-pass photons. To compensate for the RPE melanin, we first need to identify a means to estimate the local melanin concentration, either from multiwavelength fundus photography itself or from a secondary method such as near-infrared autofluorescence. Then, can be corrected accordingly, by combining with the corrected , to improve the accuracy of measurement. Experimentally, we will compare in vivo measurements using both fundus photography and PAOM in rodents in the future. Fundus photography is currently the most widely used eye exam technology and has been integrated with almost all the modern retinal imaging technologies, such as OCT and scanning laser ophthalmoscopy. PAOM is still in its infancy and we hope that it can provide additional information to be used together with fundus photography for improved diagnosis. Previously, we have successfully obtained high-quality in vivo retinal images in both rats and mice using PAOM24,25,46,47 and its laser dosage was shown to be safe by different groups.25,48 We plan to integrate a fundus camera with PAOM so that images from the two modalities can be acquired from the same subject during the same acquisition to avoid image registration. By taking advantage of our simulation results and additional information provided by PAOM, we plan to develop and optimize compensational algorithms for fundus-photography-based retinal oximetry to improve its measurement accuracy. 6.ConclusionWe applied a Monte Carlo simulation of photon transport in a simplified retinal model and applied multiwavelength illumination to simulate reflection- and absorption-based retinal oximetry methods. We varied the retinal vessel diameter and the RPE melanin concentration to examine their effects on the accuracy of measurement in both methods. In the reflection-based method, measurement became less accurate with enlarging vessel diameter and increasing melanin concentration. In comparison, using PAOM19,22,23,49 to measure was shown to be insensitive to these variations, which potentially can be a more accurate tool to measure retinal . AcknowledgmentsThe authors thank Dr. Amani Fawzi, Dr. Wei Qing, Dr. Ji Yi, and Dr. Tan Liu for insightful discussions. This work is supported in part by National Institute of Health grants 1R01EY019951, 1RC4E021357, and 1R24EY022883, and National Science Foundation grants CBET-1055379 (CAREER) and CBET-1066776. ReferencesN. D. Wangsa-WirawanR. A. Linsenmeier,
“Retinal oxygen: fundamental and clinical aspects,”
Arch. Ophthalmol., 121
(4), 547
–557
(2003). http://dx.doi.org/10.1001/archopht.121.4.547 AROPAW 0003-9950 Google Scholar
E. M. KohnerV. PatelS. Rassam,
“Role of blood flow and impaired autoregulation in the pathogenesis of diabetic retinopathy,”
Diabetes, 44
(6), 603
–607
(1995). http://dx.doi.org/10.2337/diabetes.44.6.603 DIAEAZ 0012-1797 Google Scholar
J. C. Ramella-Romanet al.,
“Measurement of oxygen saturation in the retina with a spectroscopic sensitive multi aperture camera,”
Opt. Express, 16
(9), 6170
–6182
(2008). http://dx.doi.org/10.1364/OE.16.006170 OPEXFF 1094-4087 Google Scholar
J. C. Ramella-RomanS. A. Mathews,
“Spectroscopic measurements of oxygen saturation in the retina,”
IEEE J. Sel. Topics Quantum Electron., 13
(6), 1697
–1703
(2007). http://dx.doi.org/10.1109/JSTQE.2007.911312 IJSQEN 1077-260X Google Scholar
D. Schweitzeret al.,
“In vivo measurement of the oxygen saturation of retinal vessels in healthy volunteers,”
IEEE Trans. Biomed. Eng., 46
(12), 1454
–1465
(1999). http://dx.doi.org/10.1109/10.804573 IEBEAX 0018-9294 Google Scholar
M. Hammeret al.,
“Retinal vessel oximetry-calibration, compensation for vessel diameter and fundus pigmentation, and reproducibility,”
J. Biomed. Opt., 13
(5), 054015
(2008). http://dx.doi.org/10.1117/1.2976032 JBOPFO 1083-3668 Google Scholar
A. Harriset al.,
“A review of methods for human retinal oximetry,”
Ophthalmic Surg. Laser. Imag., 34
(2), 152
–164
(2003). Google Scholar
J. B. HickamR. FrayserJ. C. Ross,
“A study of retinal venous blood oxygen saturation in human subjects by photographic means,”
Circulation, 27 375
–386
(1963). http://dx.doi.org/10.1161/01.CIR.27.3.375 CIRCAZ 0009-7322 Google Scholar
F. C. Delori,
“Noninvasive technique for oximetry of blood in retinal vessels,”
Appl. Opt., 27
(6), 1113
–1125
(1988). http://dx.doi.org/10.1364/AO.27.001113 APOPAI 0003-6935 Google Scholar
A. Lompadoet al.,
“Multispectral confocal scanning laser ophthalmoscope for retinal vessel oximetry,”
Proc. SPIE, 3920 67
–73
(2000). http://dx.doi.org/10.1117/12.379584 PSISDG 0277-786X Google Scholar
V. Vuceaet al.,
“Blood oxygenation measurements by multichannel reflectometry on the venous and arterial structures of the retina,”
Appl. Opt., 50
(26), 5185
–5191
(2011). http://dx.doi.org/10.1364/AO.50.005185 APOPAI 0003-6935 Google Scholar
J. YiX. Li,
“Estimation of oxygen saturation from erythrocytes by high-resolution spectroscopic optical coherence tomography,”
Opt. Lett., 35
(12), 2094
–2096
(2010). http://dx.doi.org/10.1364/OL.35.002094 OPLEDP 0146-9592 Google Scholar
R. V. Kuranovet al.,
“Depth-resolved blood oxygen saturation measurement by dual-wavelength photothermal (DWP) optical coherence tomography,”
Biomed. Opt. Express, 2
(3), 491
–504
(2011). http://dx.doi.org/10.1364/BOE.2.000491 BOEICL 2156-7085 Google Scholar
F. E. RoblesS. ChowdhuryA. Wax,
“Assessing hemoglobin concentration using spectroscopic optical coherence tomography for feasibility of tissue diagnostics,”
Biomed. Opt. Express, 1
(1), 310
–317
(2010). http://dx.doi.org/10.1364/BOE.1.000310 BOEICL 2156-7085 Google Scholar
D. Buerket al.,
“ gradients and countercurrent exchange in the cat vitreous humor near retinal arterioles and venules,”
Microvasc. Res., 45
(2), 134
–148
(1993). http://dx.doi.org/10.1006/mvre.1993.1013 MIVRA6 0026-2862 Google Scholar
K. R. Denninghoffet al.,
“Retinal oximeter for the blue-green oximetry technique,”
J. Biomed. Opt., 16
(10), 107004
(2011). http://dx.doi.org/10.1117/1.3638134 JBOPFO 1083-3668 Google Scholar
M. Hammeret al.,
“Light paths in retinal vessel oximetry,”
IEEE Trans. Biomed. Eng., 48
(5), 592
–598
(2001). http://dx.doi.org/10.1109/10.918598 IEBEAX 0018-9294 Google Scholar
L. WangS. L. JacquesL. Zheng,
“MCML—Monte Carlo modeling of light transport in multi-layered tissues,”
Comput. Methods Programs Biomed., 47
(2), 131
–146
(1995). http://dx.doi.org/10.1016/0169-2607(95)01640-F CMPBEK 0169-2607 Google Scholar
L. V. Wang,
“Prospects of photoacoustic tomography,”
Med. Phys., 35
(12), 5758
–5767
(2008). http://dx.doi.org/10.1118/1.3013698 MPHYA6 0094-2405 Google Scholar
S. HuL. V. Wang,
“Photoacoustic imaging and characterization of the microvasculature,”
J. Biomed. Opt., 15
(1), 011101
(2010). http://dx.doi.org/10.1117/1.3281673 JBOPFO 1083-3668 Google Scholar
J. Yaoet al.,
“Label-free oxygen-metabolic photoacoustic microscopy in vivo,”
J. Biomed. Opt., 16
(7), 076003
(2011). http://dx.doi.org/10.1117/1.3594786 JBOPFO 1083-3668 Google Scholar
H. F. Zhanget al.,
“Functional photoacoustic microscopy for high-resolution and noninvasive in vivo imaging,”
Nat. Biotechnol., 24
(7), 848
–851
(2006). http://dx.doi.org/10.1038/nbt1220 NABIF9 1087-0156 Google Scholar
H. F. Zhanget al.,
“Imaging of hemoglobin oxygen saturation variations in single vessels in vivo using photoacoustic microscopy,”
App. Phys. Lett., 90 053901
(2007). http://dx.doi.org/10.1063/1.2435697 APPLAB 0003-6951 Google Scholar
W. Songet al.,
“Integrating photoacoustic ophthalmoscopy with scanning laser ophthalmoscopy, optical coherence tomography, and fluorescein angiography for a multimodal retinal imaging platform,”
J. Biomed. Opt., 17
(6), 061206
(2012). http://dx.doi.org/10.1117/1.JBO.17.6.061206 JBOPFO 1083-3668 Google Scholar
S. Jiaoet al.,
“Photoacoustic ophthalmoscopy for in vivo retinal imaging,”
Opt. Express, 18
(4), 3967
–3972
(2010). http://dx.doi.org/10.1364/OE.18.003967 OPEXFF 1094-4087 Google Scholar
C. SchmuckerF. Schaeffel,
“A paraxial schematic eye model for the growing C57BL/6 mouse,”
Vision Res., 44
(16), 1857
–1867
(2004). http://dx.doi.org/10.1016/j.visres.2004.03.011 VISRAM 0042-6989 Google Scholar
B. L. EvansS. B. Smith,
“Analysis of esterification of retinoids in the retinal pigmented epithelium of the Mitf-vit (vitiligo) mutant mouse,”
Mol. Vis., 3 11
(1997). MVEPFB 1090-0535 Google Scholar
M. RittR. E. Schmieder,
“Wall-to-lumen ratio of retinal arterioles as a tool to assess vascular changes,”
Hypertension, 54
(2), 384
–387
(2009). http://dx.doi.org/10.1161/HYPERTENSIONAHA.109.133025 HPRTDN 0194-911X Google Scholar
C. CapraraC. Grimm,
“From oxygen to erythropoietin: relevance of hypoxia for retinal development, health and disease,”
Prog. Retin. Eye Res., 31
(1), 89
–119
(2012). http://dx.doi.org/10.1016/j.preteyeres.2011.11.003 PRTRES 1350-9462 Google Scholar
D. G. Puro,
“Retinovascular physiology and pathophysiology: new experimental approach/new insights,”
Prog. Retin. Eye Res., 31
(3), 258
–270
(2012). http://dx.doi.org/10.1016/j.preteyeres.2012.01.001 PRTRES 1350-9462 Google Scholar
M. Keijzeret al.,
“Fluorescence spectroscopy of turbid media: autofluorescence of the human aorta,”
Appl. Opt., 28
(20), 4286
–4292
(1989). http://dx.doi.org/10.1364/AO.28.004286 APOPAI 0003-6935 Google Scholar
M. Hammeret al.,
“Optical properties of ocular fundus tissues—An in vitro study using the double-integrating-sphere technique and inverse Monte Carlo simulation,”
Phys. Med. Biol., 40
(6), 963
–978
(1995). http://dx.doi.org/10.1088/0031-9155/40/6/001 PHMBA7 0031-9155 Google Scholar
R. R. AndersonJ. A. Parrish,
“The optics of human skin,”
J. Invest. Dermatol., 77
(1), 13
–19
(1981). http://dx.doi.org/10.1111/jid.1981.77.issue-1 JIDEAE 0022-202X Google Scholar
J. D. Cooket al.,
“Estimates of iron sufficiency in the US population,”
Blood, 68
(3), 726
–731
(1986). BLOOAW 0006-4971 Google Scholar
S. Prahl,
“Optical Absorption of Hemoglobin,”
http://omlc.ogi.edu/spectra/hemoglobin/ Google Scholar
M. Friebelet al.,
“Determination of optical properties of human blood in the spectral range 250 to 1100 nm using Monte Carlo simulations with hematocrit-dependent effective scattering phase functions,”
J. Biomed. Opt., 11 034021
(2006). http://dx.doi.org/10.1117/1.2203659 JBOPFO 1083-3668 Google Scholar
Y. Guoet al.,
“Monte Carlo model for studying the effects of melanin concentrations on retina light absorption,”
JOSA A, 25
(2), 304
–311
(2008). http://dx.doi.org/10.1364/JOSAA.25.000304 JOAOD6 1084-7529 Google Scholar
S. J. PreeceE. Claridge,
“Monte Carlo modelling of the spectral reflectance of the human eye,”
Phys. Med. Biol., 47
(16), 2863
–2877
(2002). http://dx.doi.org/10.1088/0031-9155/47/16/303 PHMBA7 0031-9155 Google Scholar
D. Schweitzeret al.,
“Calibration-free measurement of the oxygen saturation in retinal vessels of men,”
Proc. SPIE, 2393
(12), 210
–218
(1995). http://dx.doi.org/10.1117/12.209850 PSISDG 0277-786X Google Scholar
F. C. Deloriet al.,
“Macular pigment density measured by autofluorescence spectrometry: comparison with reflectometry and heterochromatic flicker photometry,”
JOSA A, 18
(6), 1212
–1230
(2001). http://dx.doi.org/10.1364/JOSAA.18.001212 JOAOD6 1084-7529 Google Scholar
S. Huet al.,
“Functional transcranial brain imaging by optical-resolution photoacoustic microscopy,”
J. Biomed. Opt., 14
(4), 040503
(2009). http://dx.doi.org/10.1117/1.3194136 JBOPFO 1083-3668 Google Scholar
J. Wanget al.,
“Saturation effect in functional photoacoustic imaging,”
J. Biomed. Opt., 15
(2), 021317
(2010). http://dx.doi.org/10.1117/1.3333549 JBOPFO 1083-3668 Google Scholar
G. Tikelliset al.,
“The relationship of retinal vascular calibre to diabetes and retinopathy: the Australian Diabetes, Obesity and Lifestyle (AusDiab) study,”
Diabetologia, 50
(11), 2263
–2271
(2007). http://dx.doi.org/10.1007/s00125-007-0822-x DBTGAJ 0012-186X Google Scholar
P. Mitchellet al.,
“Retinal vessel diameter and open-angle glaucoma: the Blue Mountains Eye Study,”
Ophthalmology, 112
(2), 245
–250
(2005). http://dx.doi.org/10.1016/j.ophtha.2004.08.015 OPANEW 0743-751X Google Scholar
S. Y. SchmidtR. D. Peisch,
“Melanin concentration in normal human retinal pigment epithelium. Regional variation and age-related reduction,”
Invest. Ophthalmol. Vis. Sci., 27
(7), 1063
–1067
(1986). IOVSDA 0146-0404 Google Scholar
Q. Weiet al.,
“Image chorioretinal vasculature in albino rats using photoacoustic ophthalmoscopy,”
J. Mod. Opt., 58
(21), 1997
–2001
(2011). http://dx.doi.org/10.1080/09500340.2011.601331 JMOPEW 0950-0340 Google Scholar
W. Songet al.,
“Multimodal photoacoustic ophthalmoscopy in mouse,”
J. Biophoton.,
(2012). http://dx.doi.org/10.1002/jbio.201200061 JBOIBX 1864-063X Google Scholar
S. Huet al.,
“Label-free photoacoustic ophthalmic angiography,”
Opt. Lett., 35
(1), 1
–3
(2010). http://dx.doi.org/10.1364/OL.35.000001 OPLEDP 0146-9592 Google Scholar
T. Liuet al.,
“Combined photoacoustic microscopy and optical coherence tomography can measure metabolic rate of oxygen,”
Biomed. Opt. Express, 2
(5), 1359
–1365
(2011). http://dx.doi.org/10.1364/BOE.2.001359 BOEICL 2156-7085 Google Scholar
|
||||||||||||||||||||||||||||||||||||||||||||||||||||||||||||||||||||||||||||||||||||||||||||||||||||||||||||||||||||||