
|
|
1.IntroductionPhase microscopy is widely used for obtaining high-resolution, label-free images of biological tissue. By far, the most popular techniques are Zernike phase contrast1 and differential-interference contrast (DIC),2 which provide images where phase and amplitude information is mixed. A variety of strategies have been developed to unmix this information. Examples include holographic techniques with3–5 and without6–9 phase shifting and the introduction of aperture phase masks,10,11 which require collimated illumination. Strategies based on noncollimated illumination have the advantage that they can be used with extended sources. Examples are quantitative DIC,12,13 lateral shearing,14 and oblique illumination,15,16 or oblique detection.17–19 Alternatively, numerical techniques based on the solution of the transport of intensity equation have been used.20,21 The above methods rely on well-controlled coherence and/or polarization properties, and are thus not suitable for imaging thick, scattering samples. In addition, none have, to our knowledge, been used in a reflection geometry to image subsurface structure. Optical coherence tomography (OCT) in scanning22 or full-field configurations (FF-OCT)23 has been used to image scattering biological tissue with high axial and lateral resolution, but because OCT is based on reflection contrast, it is sensitive only to strong phase gradients mostly in the axial direction (as opposed to transillumination techniques which are sensitive to weaker lateral phase gradients). Alternatively, a scanning technique has been demonstrated based on oblique illumination produced by subsurface fluorescence.24 We recently introduced oblique back-illumination microscopy (OBM)25 as a fast phase-gradient contrast technique for imaging lateral index of refraction variations in thick, scattering tissues using incoherent illumination and standard widefield detection with a camera. OBM provides phase-gradient contrast based on transillumination through the focal plane of interest, even though it is configured in a reflection geometry. This is achieved by replacing the standard widefield epi-illumination path with one or more off-axis optical fibers that produce oblique diffuse reflectance, in effect using the tissue scattering itself as the last optical element in the illumination path. Sample index of refraction gradients at the focal plane cause asymmetric vignetting at the microscope detection aperture plane, leading to phase-gradient contrast.15,16,26 OBM, thus, produces images of subsurface structure in unstained tissue similar in appearance to DIC microscopy, but with the distinction that the tissue can be arbitrarily thick. For this reason, OBM is uniquely compatible with endomicroscopy. Our first demonstration of OBM made use of image collection with a flexible optical fiber bundle with resolution limited by fiber core sampling density. Here, we make use of a rigid Hopkins lens designed for high-resolution clinical endoscopy. To decouple phase gradient from absorption contrast in OBM, sequential illumination of the sample is performed with two symmetrically positioned optical fibers (generating back-illumination with a common obliquity axis but opposing direction) and performing image processing on the resulting two raw images.25 A drawback of this method is the need to acquire images serially, which reduces temporal resolution and permits motion artifacts from dynamics on the timescale of the interframe period. These dynamics may arise from global translation of the probe due to heart beat and breathing motion as well as unstable endoscope environments. Throughout this report, we will be interested in another source of dynamics within the tissue itself, namely blood flow. Microcirculatory blood flow and capillary density are important measures of tissue oxygenation and organ health. Fluorescence angiography is typically used to reveal microvascular blood flow in vivo. Fluorescence confocal endomicroscopy has been used to image microvasculature in mice27 and humans,28 but slow frame rates [1–12 frames per second (fps)] limit its ability to quantify blood velocity. Several methods based on OCT including phase sensitive optical Doppler tomography (ODT)29 and phase variance OCT30 have been developed to quantify microvascular blood flow for retinal applications and can generate both three-dimensional reflectance volumes and blood flow maps. These techniques rely on raster scanning a focused laser beam, an intrinsic disadvantage when measuring fast dynamics. Sensitivity to global motion also limits their applications in dynamic samples. Laser speckle contrast imaging (LSCI) is a fast widefield technique that has been used to quantify microcirculatory blood flow in small animals31 and humans,32 especially cortical blood flow, but is sensitive to dynamics over relatively large depths and therefore lacks axial resolution. LSCI is also susceptible to motion artifacts, though filtering techniques exist for the case of periodic motion.32 Orthogonal polarization spectral imaging (OPS)33,34 uses incoherent illumination and polarization discrimination to effectively back-illuminate microvasculature, generating images with absorption contrast similar to what would be achieved with widefield transillumination microscopy. Red blood cell (RBC) velocity could, in principle, be derived from such videos using standard image correlation techniques,35 but the images are nevertheless insensitive to phase gradients and must rely on sufficient absorption to produce adequate contrast. The developing chick embryo is commonly studied in developmental biology. The chorioallantoic membrane (CAM) is a specialized, highly vascularized membrane that enables gas exchange between the embryo and the external environment. The readily accessible ectoderm layer of the CAM is the most superficial and supports a dense capillary plexus that forms rapidly between embryonic days 5 and 10 (E5 and E10). The underlying mesoderm layer supports dense concentrations of stromal cells, collagen fibers, and larger blood vessels. The ectoderm capillary plexus has been used to study angiogenesis, lymphangiogenesis, and tumor metastasis,36,37 and at 20 to 100 μm thick is of roughly comparable thickness and vascularity as the human retina.38 Vasculature in the CAM is typically imaged in ovo with fluorescence angiography or ex situ under DIC microscopy36 or oblique transillumination.37 Here, we introduce single-exposure OBM using a rigid Hopkins lens with wavelength multiplexing and a Wollaston prism image splitter.18,39,40 Slight asymmetric anamorphic distortion induced by the Wollaston prism is characterized and corrected in real time. Video-rate movies of the CAM in the developing chick are shown to exhibit strong phase-gradient contrast free from distortion and artifacts in the presence of probe translation and moderate blood flow. Individual RBCs are well resolved and tracked a posteriori to determine local blood velocity in the ectoderm capillary plexus. Temporal variance and averaging filters are used to highlight dynamics in vessel lumens and display static structures with improved signal-to-noise ratio (SNR). Functional capillary density (FCD), a direct measure of nutritional tissue perfusion and indirect measure of oxygen delivery to tissue,41 is defined as the length of RBC-perfused capillaries per observation area (given in ) and calculated for two capillary regions. 2.OBM Image ProcessingOBM phase-gradient contrast arises from the obliquity of the illumination through the focal plane. The direction of this obliquity can be reversed with the use of two off-axis illumination fibers mounted in diametric opposition (left and right). The detected intensities of two raw images are then given as where is the spatial coordinate vector, is the absorption contrast image, and is the phase-gradient contrast image. Note that is a negative-contrast image, and the sign of is arbitrarily chosen. To recover and from the raw data [Eqs. (1) and (2)], the raw images are first “flattened” by normalizing each by its Gaussian low-pass filtered version. This corrects for weak, slowly varying nonuniform illumination (an undesired consequence of asymmetric illumination). The width of the filter kernel is chosen to be significantly larger than the spatial scale of interest in the image to avoid losing relevant sample spatial frequencies. The composite images are then computed as where denotes the Gaussian low-pass filter operation. Adding the normalized images cancels the phase-gradient contrast and emphasizes absorption contrast, whereas subtracting the normalized images cancels the absorption contrast and emphasizes the phase-gradient contrast. The prefactor has been included to give and units of percent deviation from the background.3.Optical SetupThe optical setup is shown in Fig. 1. Light from two LEDs (Luxeon Star LXM2-PH01-0070: 617 nm, 490 mW and LXM3-PD01-0260: 655 nm, 580 mW) is coupled into multimode optical fibers ( BFL48-1000, 1 m length, Thorlabs, Newton, New Jersey) via aspheric condenser lenses in a -configuration (Thorlabs ACL5040-A). Excitation filters ( FF01-615/20-25-1 and FF01-661/20-25-1, Semrock, Rochester, New York) are applied to avoid spectral overlap. After transmission through the filters and optical fibers, the center wavelengths are 619 and 660 nm, respectively [see Fig. 1(b)], and power is per fiber. The irradiance in the tissue is maximal at the fiber–tissue interface ( time averaged). The scattering and absorption coefficients of tissue are weak functions of wavelength over this range with scattering playing the dominant role in determining light transport.42 Diffuse reflectance from each of the offset sources simultaneously back-illuminates the sample with approximately equal obliquity but opposing direction. A rigid Hopkins lens [on loan from Karl Störz, Tuttlingen, Germany, water-immersion, 0.6 numerical aperture (NA), working distance 40 μm] and tube lens (Thorlabs AC254-075-A, ) in a -configuration generates a primary image (). Fig. 1Optical setup. (a) Light from two spectrally distinct LEDs is simultaneously delivered to the sample by two offset 1 mm optical fibers. (b) Spectra of bare LEDs (dashed lines) and LEDs after transmission through optical fibers and filters (solid lines). A contact-mode rigid Hopkins lens prevents direct specular illumination of the sample; instead, the sample plane is simultaneously and obliquely back-illuminated.25 The Hopkins lens provides the limiting aperture, and a tube lens produces a primary image. The source–detector separation is 3 mm. (c) The primary image is masked by a field stop and relayed to the camera plane through a Wollaston prism which produces two laterally displaced subimages. Emission filters are used to spectrally distinguish the subimages, such that each is sensitive to phase gradients in opposing shear directions. 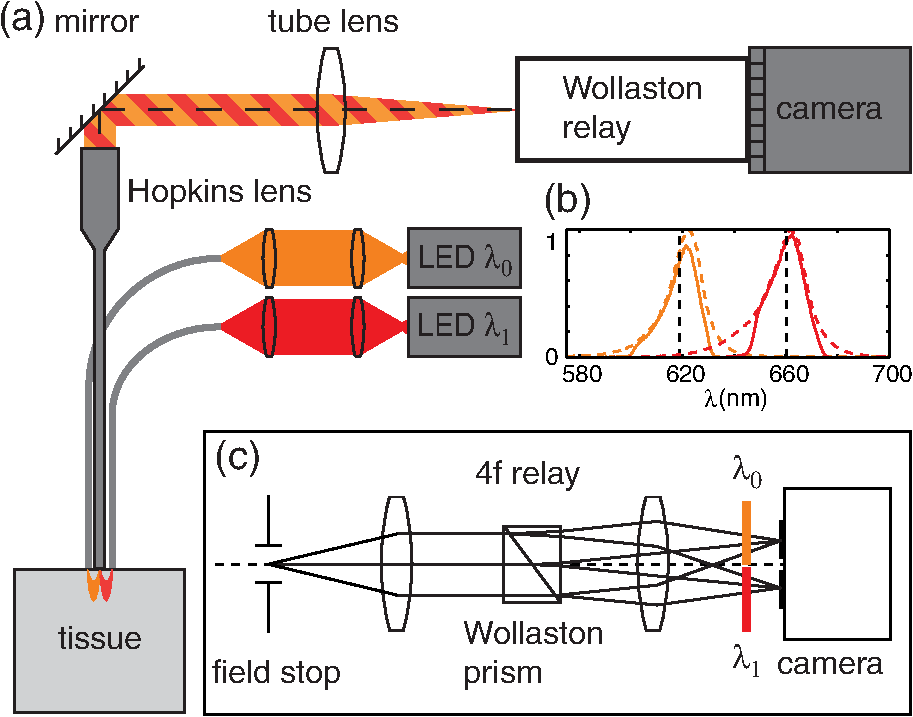 At the primary image plane are superposed two wavelength-multiplexed intensity distributions of the sample comprised of approximately equal absorption contrast and phase-gradient contrast of approximately equal magnitude but opposing sign. Both intensity distributions (henceforth called subimages) are collected in parallel by tiling across the camera sensor. The tiling is achieved by placing a quartz Wollaston prism (Edmund Optics NT68-820, beam separation 2.1 deg for ) in the Fourier plane of a demagnifying -relay. The Wollaston prism generates subimages with orthogonal polarization states, but this effect is irrelevant as the field emanating from the sample is randomly polarized. Total magnification is . Emission filters with passbands matching the excitation filters are positioned after the Wollaston prism to spectrally identify the subimages. The Wollaston relay maintains the optical resolution limited by the Hopkins lens NA () and introduces negligible aberrations. To prevent overlap of the subimages, a square field stop is placed at the entrance of the Wollaston relay with side length (260 μm demagnified). Our interline transfer camera (QImaging Retiga 2000R) supports simultaneous exposure and readout and captures frames at 25.5 fps ( binning, Nyquist resolution 1.3 μm) or 44.2 fps ( binning, Nyquist resolution 2.6 μm). 4.System CalibrationThe desired effect of the Wollaston prism in the relay is a splitting of the randomly polarized input field into two subimages displaced along a shear axis. An undesired side effect is antisymmetric anamorphic distortion, dominantly a linear expansion of one subimage and a linear compression of the other of about 2.6% relative to the undistorted field. This distortion is caused by the deviation angle having a slight dependence on incidence angle40,43 and must be corrected for proper image registration before further processing can proceed. The precision of the registration should be well within a diffraction-limited spot, which in this setup corresponds to . Therefore, subpixel registration is desirable. Although distortion is expected to be limited to expansion/compression along the shear axis, we use a general affine transform model encompassing image shear, rotation, expansion, and translation for system characterization and image registration. The affine transform maps one coordinate system to another. A homogeneous representation is used to enable a single matrix to represent combinations of linear transformations and translation. The combined matrix, , is defined as where and are translations, are expansion coefficients, is clockwise rotation, and are shear coefficients in the - and -directions, respectively. Images of a 1951 USAF resolution target (NT68-820, Edmund Optics, Barrington, New Jersey) positioned in the intermediate imaging plane were used to calibrate the system. A table of corresponding corners in each subimage was generated, and an affine transformation matrix mapping one subimage coordinate system into another was calculated based on least squares optimization. Once the affine matrix was found, the coefficients in Eq. (6) were determined using a nonlinear numerical solver to further characterize the system. In practice, the dominant terms are expansion/compression in the -direction of 2.6% and translation, with all other distortions (-direction expansion of 0.015%, rotation of , and -direction shear of 0.004), playing negligible roles. Assuming that the distortions of each subimage are of approximately equal degree but opposing sign, the desired correction is not for one subimage to map to another, but rather for each subimage to map back to a common undistorted coordinate system. To achieve this, we found such that (Ref. 44) and , its inverse, which maps each subimage to the center coordinate system (see Fig. 2).Fig. 2Distortion caused by the Wollaston prism is characterized by an affine transformation matrix. The original image is optically split into compressed and expanded subimages. Transformation matrices and describe the mapping between the subimage coordinate systems. The square root matrices and map the subimages back to the original coordinate system.  Image registration was implemented with the following algorithm. For each pixel in the registered image, a query coordinate was generated: The registered-image pixel then took on the value of the unregistered image at this coordinate. The query coordinates are not restricted to integers, and bilinear interpolation was implemented in the 4-pixel neighborhood bounding the query location. To avoid querying the subimage outside the detected domain, an additional 3% expansion from the middle of the image was applied to each subimage. It should be emphasized that cascaded transforms may be represented with a single equivalent transform. The calibration needs to occur only once, and the resulting transformation matrices and are used in real time during data acquisition and display. Figure 3 shows the efficacy of distortion correction and registration for both a USAF resolution target and a 45 μm diameter polystyrene bead in a tissue phantom comprised of 2 μm diameter polystyrene beads in 2% agarose gel (transport mean free path at ).Fig. 3Image registration with an affine transformation. (a)–(c) USAF 1951 resolution target imaged with a Wollaston relay; (a) raw subimage; (b) subtraction of subimages after translation-only registration; (c) subtraction of subimages after affine registration. Residual intensity in (b) indicates distortion. The suppression of residual intensity in (c) validates the distortion correction. (d)–(f) Forty-five micrometer polystyrene bead in tissue phantom imaged with a rigid Hopkins lens and Wollaston relay; (d) sequential exposure oblique back-illumination microscopy (OBM) using a single subimage; (e) single-exposure OBM after translation-only registration; (f) single-exposure OBM after affine registration. The poor contrast and ghost images of the 2 μm beads in (e) are not observed (f). Images (b)–(f) are displayed with a linear grayscale mapping such that zero is represented by the middle gray level and the image is scaled to fill the dynamic range of the display. Images (b) and (c) share the same colormap in order to compare residuals. Scale bars 20 μm. 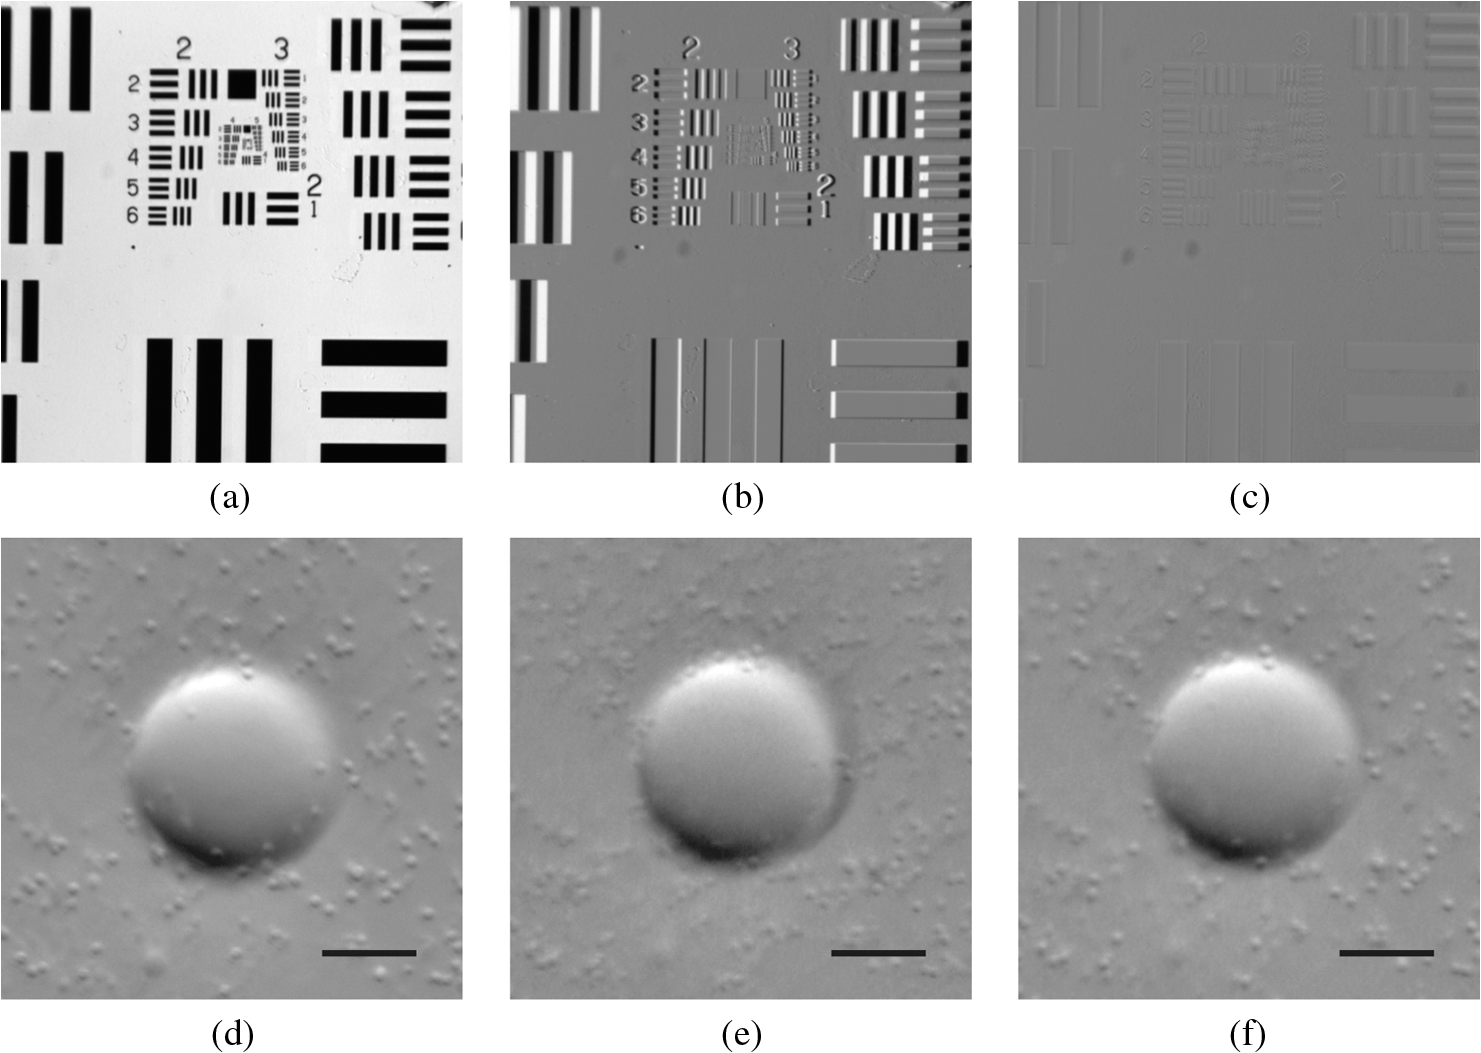 Image processing and display are performed in real time with a graphics-processing unit (NVIDIA GTX 280) using NVIDIA’s CUDA general purpose parallel computing platform (Table 1).45 We note that the NVIDIA hardware used in this work does not support simultaneous processing and memory streaming between the CPU and GPU DRAM, and performance is expected to improve if a newer generation graphics card is used (compute capability 2.0 or higher45). Table 1Real-time image processing execution times. 5.Chick Chorioallantoic MembraneFertilized Gallus gallus eggs (Edmund Optics, Burlington, North Carolina) were incubated at 38°C and 50% humidity and turned every 7 h to prevent fusion of the CAM with the shell membrane. Imaging was performed on E7 and E8. A 2 cm diameter region of shell and shell membrane was removed exposing the CAM. Imaging was performed in ovo through 37°C saline. Following imaging, the embryos were euthanized by hypothermia by storing in . The animals used in this study were treated in accordance with the guidelines of the Institutional Animal Care and Use Committee of Boston University. 6.ResultsTwo subimages are acquired in order to distinguish phase-gradient contrast from absorption contrast. Figure 4 is a single frame from Video 1, which shows RBCs flowing through the ectoderm plexus of the E8 chick CAM. Static vessel walls and flowing RBCs are both well resolved in the phase-gradient image [Fig. 4(a)]. Contrast is much weaker in the absorption image [Fig. 4(b)] and comes dominantly from RBCs. FCD was calculated to be . Fig. 4Single-exposure OBM captures capillary blood flow in ectoderm plexus of the embryonic day (E8) chick chorioallantoic membrane (CAM). (a) Single frame of Video 1 taken with Eq. (3) applied to reveal phase gradients. (b) The same data from (a) with Eq. (4) applied to reveal absorption. (b) Significantly contrast enhanced for easier visualization. Functional capillary density (FCD) is , 5 ms exposure time, 25 fps, scale bar 30 μm (Video 1, MPEG, 11.4 MB) [URL: http://dx.doi.org/10.1117/1.JBO.18.6.066007.1].  Figure 5 (Video 2) shows blood flow through the ectoderm capillary plexus in the E7 chick CAM. Stationary structures such as capillary vessel walls and moving RBCs exhibit phase-gradient contrast that is strong when in focus and decays with approximately 10 μm defocus. The apparent axial resolution is due to the defocused structures exhibiting weak phase gradients after point spread function blurring. The temporal mean [Fig. 5(b), grayscale component] and variance [Fig. 5(b), red component] within a 5-frame (0.2 s) window were used to highlight capillary lumens. Images within the window were first coregistered to render the filters insensitive to global translation and jarring caused by the embryo’s heart beat [190 beats per minute (bpm) measured]. The exposure time (5 ms) and frame rate () were sufficient to resolve and track individual RBCs as they traversed the plexus. The interframe translation vectors associated with 10 RBCs [Fig. 5(b), white arrows] were used to compute characteristic flow velocities. The average speed of is in the physiological range for peripheral capillary flow in humans.46 FCD was calculated to be . Fig. 5Single-exposure phase-gradient OBM allows red blood cell (RBC) tracking of capillary flow in ectoderm plexus. (a) Single frame of Video 2. Static vessel walls and flowing RBCs are both well resolved. (b) The temporal average (grayscale) and variance (red) were computed from a 5-frame (0.2 s) sliding window coregistered to remove the effects from global translation. The average image shows static structures including capillary walls with improved signal-to-noise ratio (SNR) compared with (a), while the variance highlights the dynamics within the capillary lumen. Interframe translation vectors of 10 RBCs in a 20 frame (0.8 s) video segment are shown with white arrows. The speed of each RBC along its path is given in mean standard deviation. 5 ms exposure time, 25 fps, scale bar 30 μm (Video 2, MPEG, 8.95 MB) [URL: http://dx.doi.org/10.1117/1.JBO.18.6.066007.2]. 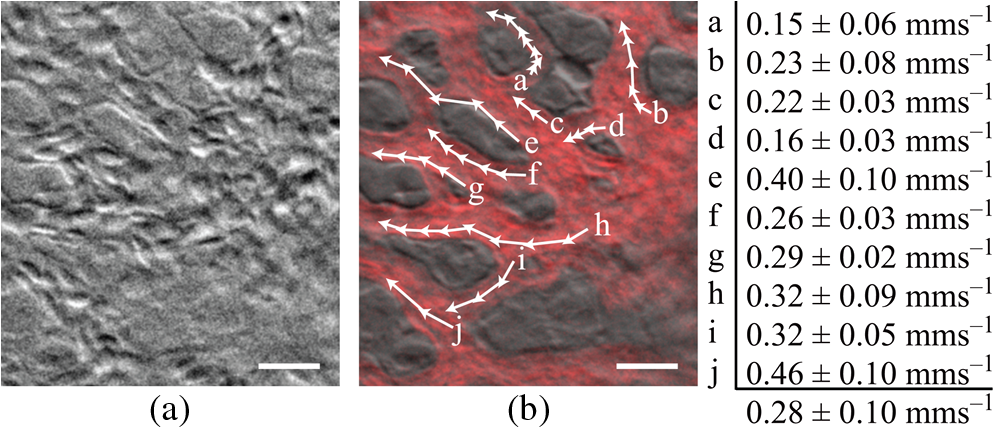 Figure 6 (Video 3) shows a large volume of densely packed RBCs flowing through a diameter postcapillary venule at . Static structures away from the vessel are well resolved, even during steady translation of the probe. A roughly parabolic velocity profile is observed as is laminar mixing of vessel contents at converging vessel branches. Back-illumination obliquity is maintained even after traversing the scattering underlying layers of the vessel, and the superficial RBCs are identified as tumbling discs with strong phase-gradient contrast. Translating the probe to follow the vessel downstream allows the observation of individual RBC dynamics that would be impossible in an absorption contrast technique. Finally, a plasma layer almost void of cells was observed along the vessel walls. Fig. 6Single-exposure phase gradient OBM video tracking blood flow through a diameter postcapillary venule at . Cross-sectional structure of the vessel wall is well resolved and does not prevent visualization of individual RBCs, which appear as tumbling discs with strong gradient contrast despite the spatiotemporally chaotic environment. Roughly parabolic velocity profile is observed. A plasma layer almost void of cells is apparent along the vessel walls. 5 ms exposure, 25 fps, scale bar 30 μm (Video 3, MPEG, 11.3 MB) [URL: http://dx.doi.org/10.1117/1.JBO.18.6.066007.3].  Figure 7 (Video 4) shows fast converging blood flow through a postcapillary venule network. The higher frame rate of 44 fps was achieved by camera pixel binning at the cost of sampling density. Fast moving RBCs are visible in some frames, but interframe tracking cannot be performed reliably. However, the temporal variance filter is robust and segments the vessels despite the poor sampling. Static regions of the membrane including blood vessel walls appear in high contrast due to phase-gradient sensitivity of OBM. An advantage of this over absorption-only imaging is the possibility of image registration that is sensitive to probe translation and insensitive to blood flow dynamics. That is, the registration tracks probe motion and not the blood-flow motion. Knowledge of the probe translation path allows large field-of-view (FOV) mosaics for better visualization of capillary architecture (Fig. 8). Fig. 7Fast converging blood flow through postcapillary venule network imaged with single-exposure OBM. (a) Single frame of Video 4. (b) The temporal average (grayscale) and variance (red) show static vessel walls with improved SNR and highlight flow dynamics, respectively. 1 ms exposure, 44 fps, scale bar 30 μm (Video 4, MPEG, 9.0 MB) [URL: http://dx.doi.org/10.1117/1.JBO.18.6.066007.4]. 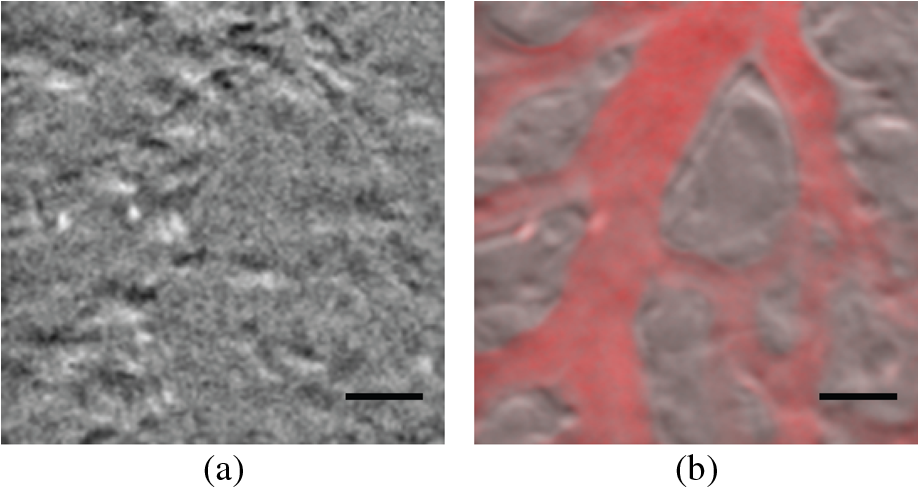 Fig. 8Extended field-of-view (FOV) mosaic of capillary network produced from Video 4. The temporal average (grayscale) and time-averaged variance (red) show static vessel walls with improved SNR and highlight regions of dynamic blood flow, respectively. FOV: . Scale bar 30 μm. Dashed box identifies the FOV of a single frame. 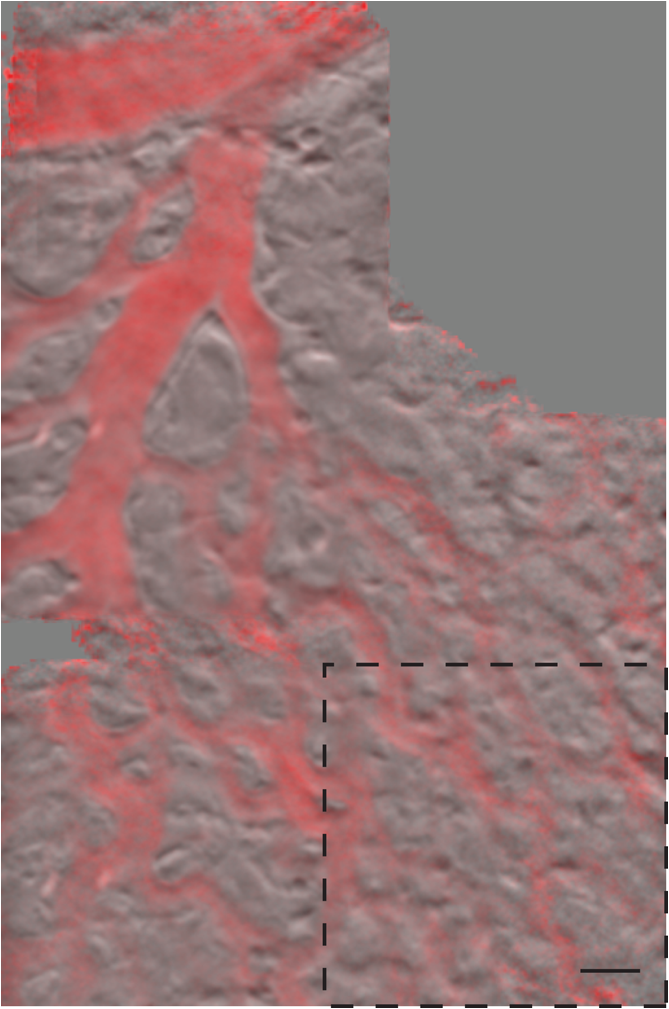 7.DiscussionSingle-exposure OBM simultaneously and independently measures absorption and phase-gradient contrast images of thick, scattering, and dynamic tissues. The sensitivity to lateral-phase gradients and in-plane motion are a direct complement to ODT, which is sensitive to axial phase gradients and the projection of blood velocity along the optical axis. The apparent axial resolution afforded by OBM may be useful, for instance, in decoupling the hemodynamics of a capillary plexus from that of an underlying arteriole. In our previous work,25 a double-shutter camera was used to minimize the time delay between paired exposures, and thus minimize motion artifacts. Even if the interframe delay is zero, however, image misregistration still occurs due to the finite exposure time of each frame. When such errors are unacceptable, as in the case of fast moving or unstable endoscopic environments, then single-exposure operation is required. A widefield system features a distinct advantage over a scanning system in that motion blur is readily detected and no temporal ambiguity exists in an individual frame. Ultimately, the number of collected backscattered photons limits the exposure time, and thus frame rate for a desired SNR. Increased light throughput is achieved by using red or near-infrared wavelengths where absorption is low in biological tissue and by minimizing the source–detector distance. This work used a commercial Hopkins lens without an integrated illumination channel. With purposeful probe design, the source–detector distance could be reduced, which could have the added benefit of increased obliquity, and thus greater phase-gradient sensitivity.25 The Wollaston prism exhibits chromatic dispersion which may cause smearing of the subimages along the shear axis if optical bandwidths of more than several tens of nanometers are used. The effect was manifestly negligible over the approximately 50 nm bandwidth used in this work. Recently, Wong et al.47 demonstrated experimentally the achromatization of a Wollaston prism with the use of a compensating prism. An achromatic Wollaston prism assembly of this type may enable single-exposure OBM with a white light source. It should be cautioned, however, that scattering and absorption in biological tissue can be strong functions of wavelength over a few hundred nanometers. If this is the case, incomplete separation of absorption and phase-gradient contrast may arise. The asymmetry may be partially mitigated by adjusting the physical source–detector separation to maintain equal distance in terms of transport mean free path. Another compensating prism scheme was proposed by Soref and McMahon 43 to compensate for asymmetric anamorphic distortion. A prism assembly of this type may enable single-exposure OBM without the need for affine transformation. Image splitting can be achieved by other approaches, such as using a dichroic beamsplitter and two cameras. An advantage of this approach is improved light collection efficiency, and thus greater SNR compared with our Wollaston prism approach. Care must be taken to use an image-quality beamsplitter, however, as standard dichroic beamsplitters only minimize aberrations in the transmitted field and not in the reflected field. These aberrations could be avoided using a beamsplitter and color filters. Both beamsplitters could be configured to work with a single camera, but attaining subimages both in focus requires a nontrivial configuration using multiple mirrors. An advantage of our Wollaston beamsplitting setup is compactness and simple tiling across a single camera chip. Of course, tiling subimages requires a reduction in either FOV or sampling density. Alternatively, a color camera or Lyot filter48 would also make possible spectral separation with excellent compactness. However, spectral overlap between color channels would reduce contrast between the subimages, and the requirement for greater spectral separation than described here would lead to illumination paths with differing amounts of absorption and scattering. The Wollaston prism approach described here represents a balance exhibiting good collection efficiency (), compactness, straightforward alignment, and easily correctable distortion. 8.ConclusionAn OBM based on a rigid endoscope was modified for single-exposure operation by the addition of a Wollaston prism image splitting relay. Subimages were coregistered and processed in real time with an inexpensive graphics-processing unit. Wavelength multiplexing was used to simultaneously and obliquely back-illuminate the ectoderm layer of the developing chick CAM in ovo. Video-rate movies free from distortion and motion artifacts show simultaneous phase-gradient and absorption contrast from individual RBCs flowing through well-resolved vessels and surrounding stromal structure. A moving temporal variance and averaging filter effectively separated static from dynamic structures a posteriori for highlighted identification of the capillary plexus. The hemodynamic parameters RBC velocity and function capillary density were measured in two capillary regions. Fast en face imaging sensitive to absorption and in-plane phase gradients is well suited for studying in vivo hemodynamics of individual RBCs flowing at moderate rates in unstained whole tissues. Single-exposure OBM is shown to enable such imaging. AcknowledgmentsThis work was partially supported by a National Institutes of Health (Grant No. R01-EB010059). ReferencesF. Zernike,
“Das Phasenkontrastverfahren bei der mikroskopischen Beobachtung,”
Z. Tech. Phys., 16 454
–457
(1935). ZTPHAU 0373-0093 Google Scholar
G. Nomarski,
“Microinterféromètre différentiel à ondes polarisées,”
J. Phys. Radium, 16 S9
–S13
(1955). JPRAAJ 0368-3842 Google Scholar
D.O. Hogenboomet al.,
“Three-dimensional images generated by quadrature interferometry,”
Opt. Lett., 23
(10), 783
–785
(1998). http://dx.doi.org/10.1364/OL.23.000783 OPLEDP 0146-9592 Google Scholar
M. Novaket al.,
“Analysis of a micropolarizer array-based simultaneous phase-shifting interferometer,”
Appl. Opt., 44
(32), 6861
–6868
(2005). http://dx.doi.org/10.1364/AO.44.006861 APOPAI 0003-6935 Google Scholar
Z. Wanget al.,
“Spatial light interference microscopy (SLIM),”
Opt. Express, 19
(2), 1016
–1026
(2011). http://dx.doi.org/10.1364/OE.19.001016 OPEXFF 1094-4087 Google Scholar
E. CucheP. MarquetC. Depeursinge,
“Simultaneous amplitude-contrast and quantitative phase-contrast microscopy by numerical reconstruction of Fresnel off-axis holograms,”
Appl. Opt., 38
(34), 6994
–7001
(1999). http://dx.doi.org/10.1364/AO.38.006994 APOPAI 0003-6935 Google Scholar
F. Le ClercL. CollotM. Gross,
“Numerical heterodyne holography with two-dimensional photodetector arrays,”
Opt. Lett., 25
(10), 716
–718
(2000). http://dx.doi.org/10.1364/OL.25.000716 OPLEDP 0146-9592 Google Scholar
T. Ikedaet al.,
“Hilbert phase microscopy for investigating fast dynamics in transparent systems,”
Opt. Lett., 30
(10), 1665
–1667
(2005). http://dx.doi.org/10.1364/OL.30.001165 OPLEDP 0146-9592 Google Scholar
B. Bhaduriet al.,
“Diffraction phase microscopy with white light,”
Opt. Lett., 37
(6), 1094
–1096
(2012). http://dx.doi.org/10.1364/OL.37.001094 OPLEDP 0146-9592 Google Scholar
S. Bernetet al.,
“Quantitative imaging of complex samples by spiral phase contrast microscopy,”
Opt. Express, 14
(9), 3792
–3805
(2006). http://dx.doi.org/10.1364/OE.14.003792 OPEXFF 1094-4087 Google Scholar
T. KimG. Popescu,
“Laplace field microscopy for label-free imaging of dynamic biological structures,”
Opt. Lett., 36
(23), 4704
–4706
(2011). http://dx.doi.org/10.1364/OL.36.004704 OPLEDP 0146-9592 Google Scholar
M. R. Arnisonet al.,
“Linear phase imaging using differential interference contrast microscopy,”
J. Microsc., 214
(1), 7
–12
(2004). http://dx.doi.org/10.1111/j.0022-2720.2004.01293.x JMICAR 0022-2720 Google Scholar
M. Shribaket al.,
“Orientation-independent differential interference contrast microscopy and its combination with an orientation-independent polarization system,”
J. Biomed. Opt., 13
(1), 014011
(2008). http://dx.doi.org/10.1117/1.2837406 JBOPFO 1083-3668 Google Scholar
P. Bonet al.,
“Quadriwave lateral shearing interferometry for quantitative phase microscopy of living cells,”
Opt. Express, 17
(15), 13080
–13094
(2009). http://dx.doi.org/10.1364/OE.17.013080 OPEXFF 1094-4087 Google Scholar
W. C. Stewart,
“On differential phase contrast with an extended illumination source,”
J. Opt. Soc. Am., 66
(8), 813
–818
(1976). http://dx.doi.org/10.1364/JOSA.66.000813 JOSAAH 0030-3941 Google Scholar
S. B. MehtaC. J. R. Sheppard,
“Quantitative phase-gradient imaging at high resolution with asymmetric illumination-based differential phase contrast,”
Opt. Lett., 34
(13), 1924
–1926
(2009). http://dx.doi.org/10.1364/OL.34.001924 OPLEDP 0146-9592 Google Scholar
I. Iglesias,
“Pyramid phase microscopy,”
Opt. Lett., 36
(18), 3636
–3638
(2011). http://dx.doi.org/10.1364/OL.36.003636 OPLEDP 0146-9592 Google Scholar
K. K. ChuJ. Mertz,
“Single exposure complementary aperture phase microscopy with polarization encoding,”
Opt. Lett., 37
(18), 3798
–3800
(2012). http://dx.doi.org/10.1364/OL.37.003798 OPLEDP 0146-9592 Google Scholar
A. B. Parthasarathyet al.,
“Quantitative phase imaging using a partitioned detection aperture,”
Opt. Lett., 37
(19), 4062
–4064
(2012). http://dx.doi.org/10.1364/OL.37.004062 OPLEDP 0146-9592 Google Scholar
D. PaganinK. A. Nugent,
“Noninterferometric phase imaging with partially coherent light,”
Phys. Rev. Lett., 80
(12), 2586
–2589
(1998). http://dx.doi.org/10.1103/PhysRevLett.80.2586 PRLTAO 0031-9007 Google Scholar
S. S. Kouet al.,
“Transport-of-intensity approach to differential interference contrast (TI-DIC) microscopy for quantitative phase imaging,”
Opt. Lett., 35
(3), 447
–449
(2010). http://dx.doi.org/10.1364/OL.35.000447 OPLEDP 0146-9592 Google Scholar
D. Huanget al.,
“Optical coherence tomography,”
Science, 254
(5035), 1178
–1181
(1991). http://dx.doi.org/10.1126/science.1957169 SCIEAS 0036-8075 Google Scholar
A. Duboiset al.,
“High-resolution full-field optical coherence tomography with a Linnik microscope,”
Appl. Opt., 41
(4), 806
–812
(2002). http://dx.doi.org/10.1364/AO.41.000805 APOPAI 0003-6935 Google Scholar
Y. Dinget al.,
“Laser oblique scanning optical microscopy (LOSOM) for phase relief imaging,”
Opt. Express, 20
(13), 14100
–14108
(2012). http://dx.doi.org/10.1364/OE.20.014100 OPEXFF 1094-4087 Google Scholar
T. N. FordK. K. ChuJ. Mertz,
“Phase-gradient microscopy in thick tissue with oblique back-illumination,”
Nat. Methods, 9
(12), 1195
–1197
(2012). http://dx.doi.org/10.1038/nmeth.2219 1548-7091 Google Scholar
R. YiK. K. ChuJ. Mertz,
“Graded-field microscopy with white light,”
Opt. Express, 14
(12), 5191
–5200
(2006). http://dx.doi.org/10.1364/OE.14.005191 OPEXFF 1094-4087 Google Scholar
E. Laemmelet al.,
“Fibered confocal fluorescence microscopy (Cell-viZio) facilitates extended imaging in the field of microcirculation: a comparison with intravital microscopy,”
J. Vasc. Res., 41
(5), 400
–411
(2004). http://dx.doi.org/10.1159/000081209 JVREE9 1018-1172 Google Scholar
K. B. DunbarM. I. Canto,
“Confocal endomicroscopy,”
Tech. Gastrointest. Endosc., 12
(12), 90
–99
(2010). http://dx.doi.org/10.1016/j.tgie.2010.02.010 1096-2883 Google Scholar
B. R. Whiteet al.,
“In vivo dynamic human retinal blood flow imaging using ultra-high-speed spectral domain optical Doppler tomography,”
Opt. Express, 11
(25), 3490
–3497
(2003). http://dx.doi.org/10.1364/OE.11.003490 OPEXFF 1094-4087 Google Scholar
J. Fingleret al.,
“Volumetric microvascular imaging of human retina using optical coherence tomography with a novel motion contrast technique,”
Opt. Express, 17
(24), 22190
–22200
(2009). http://dx.doi.org/10.1364/OE.17.022190 OPEXFF 1094-4087 Google Scholar
D. A. BoasA. K. Dunn,
“Laser speckle contrast imaging in biomedical optics,”
J. Biomed. Opt., 15
(1), 011109
(2010). http://dx.doi.org/10.1117/1.3285504 JBOPFO 1083-3668 Google Scholar
A. B. Parthasarathyet al.,
“Laser speckle contrast imaging of cerebral blood flow in humans during neurosurgery: a pilot clinical study,”
J. Biomed. Opt., 15
(6), 066030
(2010). http://dx.doi.org/10.1117/1.3526368 JBOPFO 1083-3668 Google Scholar
W. Groneret al.,
“Orthogonal polarization spectral imaging: a new method for study of the microcirculation,”
Nat. Med., 5
(10), 1209
–1213
(1999). http://dx.doi.org/10.1038/13529 1078-8956 Google Scholar
F. A. PenningsG. J. BoumaC. Ince,
“Direct observation of the human cerebral microcirculation during aneurysm surgery reveals increased arteriolar contractility,”
Stroke, 35 1284
–1288
(2004). http://dx.doi.org/10.1161/01.STR.0000126039.91400.cb SJCCA7 0039-2499 Google Scholar
M. IntagliettaN. R. SilvermanW. R. Tompkins,
“Capillary flow velocity measurements in vivo and in situ by television methods,”
Microvasc. Res., 10
(2), 165
–179
(1975). http://dx.doi.org/10.1016/0026-2862(75)90004-7 MIVRA6 0026-2862 Google Scholar
E. I. DeryuginaJ. P. Quigley,
“Chick embryo chorioallantoic membrane model systems to study and visualize human tumor cell metastasis,”
Histochem. Cell Biol., 130
(6), 1119
–1130
(2008). http://dx.doi.org/10.1007/s00418-008-0536-2 HCBIFP 0948-6143 Google Scholar
I. C. MacDonaldet al.,
“Intravital videomicroscopy of the chorioallantoic microcirculation: a model system for studying metastasis,”
Microvasc. Res., 44
(2), 185
–199
(1992). http://dx.doi.org/10.1016/0026-2862(92)90079-5 MIVRA6 0026-2862 Google Scholar
T. Lenget al.,
“The chick chorioallantoic membrane as a model tissue for surgical retinal research and simulation,”
Retina, 24
(3), 427
–434
(2004). http://dx.doi.org/10.1097/00006982-200406000-00014 RETIDX 0275-004X Google Scholar
W.-H. YehJ. CarriereM. Mansuripur,
“Polarization microscopy of magnetic domains for magneto-optical disks,”
Appl. Opt., 38
(17), 3749
–3758
(1999). http://dx.doi.org/10.1364/AO.38.003749 APOPAI 0003-6935 Google Scholar
A. Bénièreet al.,
“Design and experimental validation of a snapshot polarization contrast imager,”
Appl. Opt., 48
(30), 5764
–5773
(2009). http://dx.doi.org/10.1364/AO.48.005764 APOPAI 0003-6935 Google Scholar
A. G. Harriset al.,
“Skeletal muscle microvascular and tissue injury after varying durations of ischemia,”
Am. J. Physiol. Heart Circ. Physiol., 271
(6), H2388
–H2398
(1996). AJPHAP 0002-9513 Google Scholar
J. MobleyT. Vo-Dinh,
“Optical properties of tissue,”
Biomedical Photonics Handbook, CRC Press, Boca Raton, FL
(2003). Google Scholar
R. A. SorefD. H. McMahon,
“Optical design of Wollaston-prism digital light deflectors,”
Appl. Opt., 5
(3), 420
–434
(1966). http://dx.doi.org/10.1364/AO.5.000425 APOPAI 0003-6935 Google Scholar
C. M. Gordon,
“The square root function of a matrix,”
Georgia State University,
(2007). Google Scholar
NVIDIA, “CUDA C Programming Guide,”
(2012) http://docs.nvidia.com/cuda/pdf/CUDA_C_Programming_Guide.pdf Google Scholar
K. R. Mathuraet al.,
“Comparison of OPS imaging and conventional capillary microscopy to study the human microcirculation,”
J. Appl. Physiol., 91
(1), 74
–78
(2001). JAPYAA 0021-8987 Google Scholar
G. WongR. PilkingtonA. R. Harvey,
“Achromatization of Wollaston polarization beam splitters,”
Opt. Lett., 36
(8), 1332
–1334
(2011). http://dx.doi.org/10.1364/OL.36.001332 OPLEDP 0146-9592 Google Scholar
A. GormanD. W. Fletcher-HolmesA. R. Harvey,
“Generalization of the Lyot filter and its application to snapshot spectral imaging,”
Opt. Express, 18
(6), 5602
–5608
(2010). http://dx.doi.org/10.1364/OE.18.005602 OPEXFF 1094-4087 Google Scholar
|


