|
|
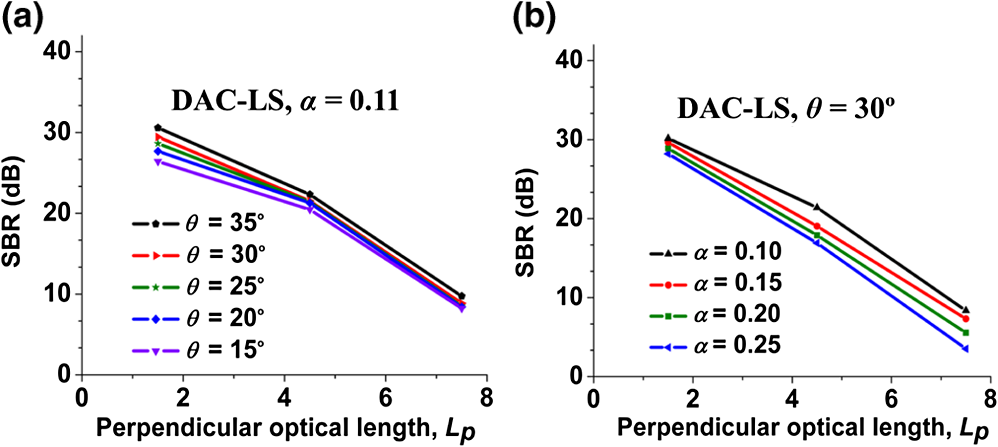
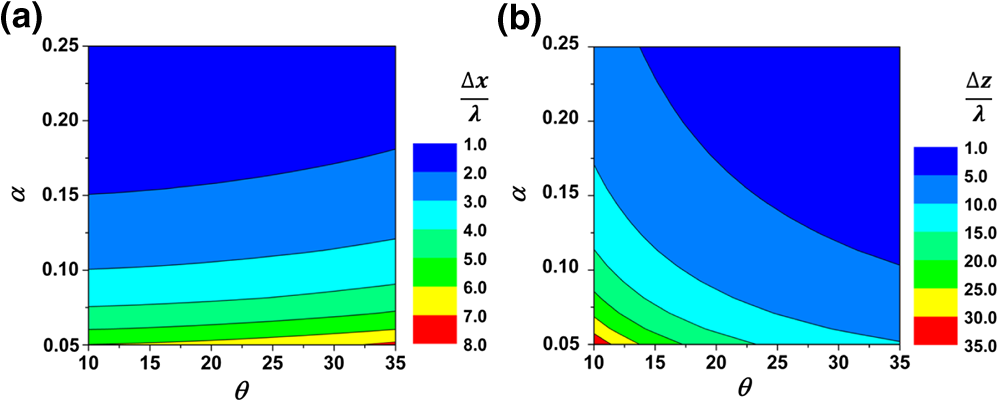
1.IntroductionConfocal microscopy, using point illumination and pinhole detection to reject out-of-focus and multiply scattered light from the object, provides improved imaging resolution and contrast over traditional microscopy and has become one of the most widely used biomedical optical imaging techniques.1 In the past decade, various confocal microscope architectures have been developed for diverse biomedical applications.2–15 A large objective lens with a high numerical aperture (NA) is generally utilized in a conventional confocal microscope to obtain high-resolution images. However, high-NA focusing leads to a short working distance due to geometric constraints. Therefore, the scan mirror must be placed prior to the objective which leads to off-axis aberrations that must be alleviated by the use of multiple corrective lenses, which further increases the objective size. Also, in a conventional single-axis confocal microscope, both the illumination and collection beams travel a common path in tissue, causing a significant amount of out-of-focus and multiply scattered light to be collected by the high-NA objective as background, thus decreasing imaging contrast and depth.16–19 In the dual-axis confocal (DAC) microscope, two off-axis low-NA beams are aligned such that the illumination and collection beams intersect and focus at a single location within tissue. A long working distance results from utilizing low-NA lenses, which allows for a scanning mirror to be placed at the distal end of the objective to provide a large field of view without introducing scanning-induced aberrations.20 Furthermore, since the illumination and collection beams travel different paths in tissue, the detector collects less out-of-focus and multiply scattered background light, thus leading to improved imaging depth and contrast.12,16–19,21 In this paper, we are interested in optimizing the imaging performance of two distinct DAC architectures. In point-scanned DAC microscopy (DAC-PS), a focused point is scanned through tissue in two dimensions to reconstruct an image pixel-by-pixel. In line-scanned DAC microscopy (DAC-LS), a focused line is scanned through tissue in only one dimension such that the image is reconstructed line-by-line. Instead of a single point detector, the line-scanned confocal microscope uses a one-dimensional linear-array detector to image an entire line at once, potentially improving the imaging speed and simplifying the scanning mechanism. However, there is a tradeoff in performance since confocality is lost in one dimension for a line-scanned DAC, which results in greater pixel crosstalk and diminished rejection of out-of focus and multiply scattered background light.10,17–19,22,23 Contrast and spatial resolution are two major performance parameters to consider when assessing optical-sectioning microscopes. Previous diffraction theory studies have shown that spatial resolution depends on both the crossing half angle of the dual-axis beams, , and the focusing NA of the individual beams, .21,24,25 It is also generally assumed that tissue-imaging contrast is a function of and . However, this dependency has not been studied in great detail. Since diffraction theory does not account for any scattering events, Monte-Carlo simulations are therefore used in this study to characterize the tissue-imaging performance (contrast) of DAC-PS and DAC-LS configurations in reflectance mode as a function of and . Here, contrast is defined as the ratio between the in-focus signal in an image and the background signal due to out-of-focus and multiply scattered light: the signal-to-background ratio (SBR). Furthermore, in order to provide a comprehensive guide for the design of these devices, we also include diffraction theory calculations of spatial resolution as a function of and . 2.Experimental Methods2.1.Monte-Carlo Simulation2.1.1.SoftwareWe used FRED software (Photon Engineering, Tucson, AZ) for all Monte-Carlo simulations. This Monte-Carlo model utilizes a Henyey–Greenstein approximation of Mie scattering theory.26 The tissue model in this simulation has a scattering coefficient of and an anisotropy factor , of 0.81.27,28 These values are intended to mimic the scattering parameters measured in human skin at around 633 to 810 nm. In order to eliminate aberrations and reflections produced at the air–tissue interfaces and to simplify the simulation model, the index of refraction of the scattering media, , is set as unity. Our Monte-Carlo simulations are designed to estimate tissue-imaging performance for various confocal configurations but do not take into consideration polarization, diffraction, and absorption. Furthermore, these simulations do not reflect other scattering events in real tissue, such as refractive beam steering and lensing introduced by heterogeneous structures that have dimensions larger than the operating wavelength of light (785 nm in this case). Nevertheless, Monte-Carlo simulations provide an excellent first-order approximation of optical-sectioning performance in tissues, which we have successfully validated through experiments with homogeneous scattering phantoms such as Intralipid.12,29 2.1.2.Geometric modelFigure 1 displays the geometric design used for DAC Monte-Carlo simulations. To model a DAC system with single-mode fibers serving as illumination and collection pinholes, two off-axis Gaussian beams with a focusing NA, , are aligned such that they intersect at their foci with a crossing angle of . In particular, the illumination beam is created by a Gaussian point source at 785 nm with a numerical aperture , which is imaged without magnification into tissue through a pair of matched aspheric lenses, (Edmund Optics #47728) with a 22.5-mm focal length. The collection path is identical to the illumination path and symmetrical with respect to the axis. For the DAC-LS configuration, a cylindrical lens () with a 300-mm focal length is introduced into the illumination arm so that a focal line ( long) is generated in the direction at the imaging plane.10 2.1.3.ProcedureSince we aim to provide a guide to optimize the design of DAC microscopes, we vary and in our Monte-Carlo simulations to analyze their effects on contrast and resolution. Based on our experience in building DAC microscope systems, we limit our analysis to a range of practical values: and .12,21,24 In order to investigate the effect of each variable independently, is fixed at 0.11 rad (consistent with our previous simulation setup) when is changed.12,17 Likewise, is kept at 30 deg when is varied. Note that varying causes the diffraction-limited spot size to change. Therefore, the pinhole size at the detector must be adjusted as is altered.21 For instance, when , we choose a pinhole size of microns, which is slightly larger than the spot size calculated by diffraction theory. Since the diffraction-limited spot size scales with , if is increased to 0.2 rad, the pinhole is reduced to microns. In all simulations, our detector plane is oriented perpendicular to the collection beam and consists of pixels separated by 0.1 microns. Thus, a micron pinhole corresponds to a bin of detector pixels, whereas a micron pinhole corresponds to a bin of detector pixels. 2.1.4.Signal-to-background ratioIn order to measure the SBR of various DAC-PS and DAC-LS configurations, a mirror is placed at the focal plane and embedded within a homogenous scattering medium (Sec. 2.1.1). When the 100% reflective mirror is located exactly at the focus of the microscope, a peak signal is obtained. The peak signal is dominated by ballistic (nonscattered) photons but also contains a certain amount of background photons. We measure the background signal by removing the mirror from the simulation. As imaging depth increases, the SBR will decrease. Here, imaging depth is defined as the “perpendicular optical length,” , which is a nondimensional quantity that refers to the total number of mean free paths that ballistic (nonscattered) photons travel in a perpendicular round-trip path between the tissue surface and the mirror. 2.2.Diffraction TheoryIn our previous study, the full-width at half-maximum spatial resolution was calculated from diffraction theory,24 For the DAC-PS configuration, depends only on the focusing NA of the individual beams, , and is not a function of crossing angle, . For the DAC-LS configuration, since the focal line extends in the direction, is also determined by how fully the linear array samples the line according to the Nyquist sampling criteria. Here, we focus our analysis on the spatial resolution in the and directions, which are functions of both and , as seen in Eq. (1). In order to apply these calculations for all wavelengths, a nondimensional resolution is reported by normalizing against wavelength, and . Note that these resolution calculations apply for both the DAC-PS and DAC-LS designs. 3.ResultsOur results indicate that the effects of and on contrast and resolution are quite different for the DAC-PS versus DAC-LS architectures. 3.1.DAC-PSPlots of SBR versus imaging depth () for the DAC-PS configuration are shown in Fig. 2. In Fig. 2(a), when is fixed, increasing results in improved SBR at all depths. However, Fig. 2(b) shows that SBR is not sensitive to variations in . These results indicate that maximizing is important for achieving high contrast (i.e., rejecting as much out-of-focus and multiply scattered light as possible) for the DAC-PS design, while varying is not as important (see Sec. 4 for discussion). 3.2.DAC-LSPlots of SBR versus imaging depth () for the DAC-LS configuration are shown in Fig. 3. Figure 3(a) indicates that increasing is not as important, compared to the DAC-PS configuration, for improving SBR, but increasing does make a slight difference in improving the contrast at shallow depths. Figure 3(b) suggests that varying also plays a minor role in improving contrast. Note that for the DAC-LS configuration, overall SBR performance is worse than for the DAC-PS, as expected (see Introduction). Therefore, the DAC-LS would likely be utilized for imaging at shallow depths. 3.3.ResolutionThe contour plots in Fig. 4 demonstrate the effect of and on spatial resolution ( and directions). Figure 4(a) implies that contributes more than in determining . In other words, high NA beams (large ) help to ensure high resolution in the direction. However, for any given , increasing only slightly improves resolution. Figure 4(b) indicates that in order to achieve good resolution in the direction, maximizing both and is necessary. 4.Discussion and ConclusionOur Monte-Carlo simulations and diffraction theory calculations suggest that the optimization of DAC configurations may require very different design parameters, depending upon the biomedical application of interest. First, the dependencies of contrast on and were evaluated by Monte-Carlo simulations. According to Fig. 2, SBR is more sensitive to than . In particular, increased results in better SBR. An explanation for this result is that the illumination and collection paths move closer to each other when their half crossing angle, , decreases. As the two beams move closer to each other, the out-of-focus and multiply scattered photons generated by the illumination beam are more likely to scatter into the collection beam. Thus, increasing improves the SBR (contrast). When the focusing NA of each individual beam, , increases, the illumination and collection beams also move closer to each other, which would worsen the SBR. However, since the diffraction-limited spot size is reduced when is increased, the correspondingly smaller pinhole improves the rejection of out-of-focus and multiply scattered background light.30–32 These two effects balance each other, which ultimately causes the DAC-PS to be relatively insensitive to changes in . Figure 3 displays the effect of varying and on the contrast of the DAC-LS configuration. At shallow depths, maximizing results in a slight improvement in SBR, but this contrast improvement in the DAC-LS architecture is much less than that in the DAC-PS architecture. We hypothesize that this may be due to pixel crosstalk serving as the dominant source of background in the DAC-LS configuration. The lack of confocality in one dimension for the line-scanned approach creates crosstalk between pixels along the focal line at the detector. This crosstalk diminishes the DAC-LS architecture’s ability to reject out-of-focus and multiply scattered background light and thereby limits the achievable contrast (SBR) of the line-scanned DAC.17 Although diffraction theory does not account for scattering events, it allows us to express spatial resolution as a function of and . Monte-Carlo simulations along with diffraction theory calculations provide a comprehensive guide to optimize the DAC-PS and DAC-LS microscopes for various imaging applications. For a DAC-PS microscope, optimization should seek to balance both contrast and spatial resolution. Since increasing is more important than for obtaining highest contrast for a DAC-PS microscope, optimizing the DAC-PS design should prioritize the beam crossing half angle, . Moreover, according to diffraction theory, given a maximized , increasing would also be preferred for maintaining good and resolution. Increasing only slightly reduces contrast for the DAC-PS design. For the DAC-LS design, since contrast is not overly sensitive to variations in either or , its optimization should focus on obtaining high spatial resolution ( and directions). In the direction, good resolution requires maximizing . In the direction, increasing both and improves resolution. In practice, one’s choice of or is often limited by pragmatic concerns such as working distance and device size, as well as the position and size of the scanning mechanism. Generally, large crossing angles, , imply larger device sizes and/or shorter working distances. Large crossing angles, , and beam numerical apertures, , may also create additional challenges for aberration-corrected optics and the index-matching of beams into tissues.9,33,34 AcknowledgmentsWe would like to acknowledge funding support from the National Institute for Biomedical Imaging and Bioengineering—R00 EB008557 (Liu), the National Institute of Dental and Craniofacial Research—R01 DE023497 (Liu), and the office of the Vice President for Research at Stony Brook University. The authors also thank Danni Wang and Steven Leigh for paper revisions. ReferencesJ. B. Pawley, Handbook of Biological Confocal Microscopy, 3rd ed.Springer, New York
(2006). Google Scholar
D. L. DickensheetsG. S. Kino,
“Micromachined scanning confocal optical microscope,”
Opt. Lett., 21
(10), 764
–766
(1996). http://dx.doi.org/10.1364/OL.21.000764 OPLEDP 0146-9592 Google Scholar
G. J. TearneyR. H. WebbB. E. Bouma,
“Spectrally encoded confocal microscopy,”
Opt. Lett., 23
(15), 1152
–1154
(1998). http://dx.doi.org/10.1364/OL.23.001152 OPLEDP 0146-9592 Google Scholar
Y. S. Sabharwalet al.,
“Slit-scanning confocal microendoscope for high-resolution in vivo imaging,”
Appl. Opt., 38
(34), 7133
–7144
(1999). http://dx.doi.org/10.1364/AO.38.007133 APOPAI 0003-6935 Google Scholar
J. Knittelet al.,
“Endoscope-compatible confocal microscope using a gradient index-lens system,”
Optics Comm., 188
(5–6), 267
–273
(2001). http://dx.doi.org/10.1016/S0030-4018(00)01164-0 OPCOB8 0030-4018 Google Scholar
C. Pitriset al.,
“A GRISM-based probe for spectrally encoded confocal microscopy,”
Opt. Express, 11
(2), 120
–124
(2003). http://dx.doi.org/10.1364/OE.11.000120 OPEXFF 1094-4087 Google Scholar
C. MacAulayP. LaneR. Richards-Kortum,
“In vivo pathology: microendoscopy as a new endoscopic imaging modality,”
Gastrointest. Endosc. Clin. N Am., 14
(3), 595
–620
(2004). http://dx.doi.org/10.1016/j.giec.2004.03.014 GECNED 1052-5157 Google Scholar
R. Kiesslichet al.,
“Confocal laser endoscopy for diagnosing intraepithelial neoplasias and colorectal cancer in vivo,”
Gastroenterology, 127
(3), 706
–713
(2004). http://dx.doi.org/10.1053/j.gastro.2004.06.050 GASTAB 0016-5085 Google Scholar
K. Carlsonet al.,
“In vivo fiber-optic confocal reflectance microscope with an injection-molded plastic miniature objective lens,”
Appl. Opt., 44
(10), 1792
–1797
(2005). http://dx.doi.org/10.1364/AO.44.001792 APOPAI 0003-6935 Google Scholar
P. J. DwyerC. A. DiMarzioM. Rajadhyaksha,
“Confocal theta line-scanning microscope for imaging human tissues,”
Appl. Opt., 46
(10), 1843
–1851
(2007). http://dx.doi.org/10.1364/AO.46.001843 APOPAI 0003-6935 Google Scholar
F. JeanG. Bourg-HecklyB. Viellerobe,
“Fibered confocal spectroscopy and multicolor imaging system for in vivo fluorescence analysis,”
Opt. Express, 15
(7), 4008
–4017
(2007). http://dx.doi.org/10.1364/OE.15.004008 OPEXFF 1094-4087 Google Scholar
J. T. C. Liuet al.,
“Efficient rejection of scattered light enables deep optical sectioning in turbid media with low-numerical-aperture optics in a dual-axis confocal architecture,”
J. Biomed. Opt, 13
(3), 034020
(2008). http://dx.doi.org/10.1117/1.2939428 JBOPFO 1083-3668 Google Scholar
H. Makhloufet al.,
“Multispectral confocal microendoscope for in vivo and in situ imaging,”
J. Biomed. Opt, 13
(4), 044016
(2008). http://dx.doi.org/10.1117/1.2950313 JBOPFO 1083-3668 Google Scholar
J. T. C. Liuet al.,
“Point-of-care pathology with miniature microscopes,”
Anal. Cell Pathol. (Amst), 34
(3), 81
–98
(2011). http://dx.doi.org/10.3233/ACP-2011-011 Google Scholar
J. M. Jabbouret al.,
“Confocal endomicroscopy: instrumentation and medical applications,”
Annals Biomed. Eng., 40
(2), 378
–397
(2012). http://dx.doi.org/10.1007/s10439-011-0426-y ABMECF 0090-6964 Google Scholar
L. K. Wonget al.,
“Improved rejection of multiply scattered photons in confocal microscopy using dual-axes architecture,”
Opt. Lett., 32
(12), 1674
–1676
(2007). http://dx.doi.org/10.1364/OL.32.001674 OPLEDP 0146-9592 Google Scholar
Y. ChenD. WangJ. T. C. Liu,
“Assessing the tissue-imaging performance of confocal microscope architectures via Monte Carlo simulations,”
Opt. Lett., 37
(21), 4495
–4497
(2012). http://dx.doi.org/10.1364/OL.37.004495 OPLEDP 0146-9592 Google Scholar
D. S. GareauS. AbeytungeM. Rajadhyaksha,
“Line-scanning reflectance confocal microscopy of human skin: comparison of full-pupil and divided-pupil configurations,”
Opt. Lett., 34
(20), 3235
–3237
(2009). http://dx.doi.org/10.1364/OL.34.003235 OPLEDP 0146-9592 Google Scholar
Y. G. PatelM. RajadhyakshaC. A. Dimarzio,
“Optimization of pupil design for point-scanning and line-scanning confocal microscopy,”
Biomed. Opt. Express, 2
(8), 2231
–2242
(2011). http://dx.doi.org/10.1364/BOE.2.002231 BOEICL 2156-7085 Google Scholar
T. D. Wanget al.,
“Dual-axes confocal microscopy with post-objective scanning and low-coherence heterodyne detection,”
Opt. Lett., 28
(20), 1915
–1917
(2003). http://dx.doi.org/10.1364/OL.28.001915 OPLEDP 0146-9592 Google Scholar
J. T. C. Liuet al.,
“Dual-axes confocal reflectance microscope for distinguishing colonic neoplasia,”
J. Biomed. Opt., 11
(5), 054019
(2006). http://dx.doi.org/10.1117/1.2363363 JBOPFO 1083-3668 Google Scholar
B. SimonC. A. Dimarzio,
“Simulation of a theta line-scanning confocal microscope,”
J. Biomed. Opt., 12
(6), 064020
(2007). http://dx.doi.org/10.1117/1.2821425 JBOPFO 1083-3668 Google Scholar
A. A. TanbakuchiA. R. RouseA. F. Gmitro,
“Monte Carlo characterization of parallelized fluorescence confocal systems imaging in turbid media,”
J. Biomed. Opt., 14
(4), 044024
(2009). http://dx.doi.org/10.1117/1.3194131 JBOPFO 1083-3668 Google Scholar
J. T. C. Liuet al.,
“Micromirror-scanned dual-axis confocal microscope utilizing a gradient-index relay lens for image guidance during brain surgery,”
J. Biomed. Opt., 15
(2), 026029
(2010). http://dx.doi.org/10.1117/1.3386055 JBOPFO 1083-3668 Google Scholar
W. GongK. SiC. J. Sheppard,
“Optimization of axial resolution in a confocal microscope with D-shaped apertures,”
Appl. Opt., 48
(20), 3998
–4002
(2009). http://dx.doi.org/10.1364/AO.48.003998 APOPAI 0003-6935 Google Scholar
L. G. HenyeyJ. L. Greenstein,
“Diffuse radiation in the galaxy,”
Astrophys. J., 93 70
–83
(1941). http://dx.doi.org/10.1086/144246 ASJOAB 0004-637X Google Scholar
T. Collieret al.,
“Determination of epithelial tissue scattering coefficient using confocal microscopy,”
IEEE J. Sel. Top. Quant., 9
(2), 307
–313
(2003). http://dx.doi.org/10.1109/JSTQE.2003.814413 IJSQEN 1077-260X Google Scholar
W. F. CheongS. A. PrahlA. J. Welch,
“A review of the optical-properties of biological tissues,”
IEEE J. Quantum Elect., 26
(12), 2166
–2185
(1990). http://dx.doi.org/10.1109/3.64354 IEJQA7 0018-9197 Google Scholar
D. WangY. ChenJ. T. C. Liu,
“A liquid optical phantom with tissue-like heterogeneities for confocal microscopy,”
Biomed. Opt. Express, 3
(12), 3153
–3160
(2012). http://dx.doi.org/10.1364/BOE.3.003153 BOEICL 2156-7085 Google Scholar
J. M. SchmittA. KnuttelM. Yadlowsky,
“Confocal microscopy in turbid media,”
J. Opt. Soc. Am. A, Optics, Image Sci. Vis., 11
(8), 2226
–2235
(1994). http://dx.doi.org/10.1364/JOSAA.11.002226 JOAOD6 0740-3232 Google Scholar
R. GauderonC. J. Sheppard,
“Effect of a finite-size pinhole on noise performance in single-, two-, and three-photon confocal fluorescence microscopy,”
Appl. Opt., 38
(16), 3562
–3565
(1999). http://dx.doi.org/10.1364/AO.38.003562 APOPAI 0003-6935 Google Scholar
J. A. ConchelloJ. W. Lichtman,
“Optical sectioning microscopy,”
Nat. Methods, 2
(12), 920
–931
(2005). http://dx.doi.org/10.1038/nmeth815 1548-7091 Google Scholar
R. T. Kesteret al.,
“High numerical aperture microendoscope objective for a fiber confocal reflectance microscope,”
Opt. Express, 15
(5), 2409
–2420
(2007). http://dx.doi.org/10.1364/OE.15.002409 OPEXFF 1094-4087 Google Scholar
M. KyrishT. S. Tkaczyk,
“Achromatized endomicroscope objective for optical biopsy,”
Biomed. Opt. Express, 4
(2), 287
–297
(2013). http://dx.doi.org/10.1364/BOE.4.000287 BOEICL 2156-7085 Google Scholar
|