
|
|
|
Multiphoton microscopy has been used to investigate NADH, its dinucleotide phosphate [NAD(P)H], serotonin, and tryptophan (TRP) in cells and tissues for various biological and clinical research.1–5 It can be hypothesized that most of the TRP-related fluorescence signals arise from cellular protein production. Förster resonance energy transfer (FRET) imaging remains one of the only high-resolution methodologies available in cell biology and clinical applications to investigate protein–protein interactions.6,7 Fluorescence lifetime imaging (FLIM)-FRET for protein–protein interactions in particular offers specificity and sensitivity with high spatial and temporal information in living specimens.8 FRET events are identified by measuring the reduction in the donor (TRP) lifetime resulting from quenching by the acceptor (NADH) in close proximity. Energy transfer efficiency () is estimated from the donor lifetimes determined in the absence (, unquenched lifetime) and in the presence of the acceptor (, quenched lifetime): . We exploit three-photon (3P)-FLIM-FRET to demonstrate the coenzyme-NADH quenching of TRP in live human tumorigenic and nontumorigenic cells. NADH has two autofluorescent lifetimes: shorter in a free state and longer in a protein-bound state.9 Inhibition studies on glycolysis with 3-bromopyruvate and oxidative phosphorylation with cobalt chloride () produce a decrease in the abundance of protein-bound NADH relative to free NADH levels within cells.9,10 These characterization studies suggest that protein-bound NADH is particularly sensitive to changes in the glycolysis pathway. The quenching of TRP by protein-bound NADH in solutions has been demonstrated in pig lactate dehydrogenase and malate dehydrogenase using a spectrofluorometer, measuring the fluorescence intensities and lifetimes.11 In this article, we demonstrate the changes observed in TRP lifetime due to the changes in metabolic flux within live human cells. TRP signals were collected with a 3P-FLIM-FRET imaging system using tumorigenic HeLa and nontumorigenic MCF10A cells along with cell perturbation studies by glucose, in space and time. The FLIM-FRET imaging system was described earlier.6,7 Briefly, a Plan Fluor 60×/1.2 NA water immersion, infrared objective lens was used and specimens were excited by a Coherent Mira 900 Ti:Sapphire laser ( www.coherent.com) tuned to 740 nm. A nondescanning method was used to collect the “donor” TRP and “acceptor” NADH photons, using HQ360/40-2p (Lot 230753) and ET480/40-2p (Lot 232292) band-pass filters ( www.chroma.com), respectively, with the Becker & Hickl (BH) SPC-150 module ( www.beckerhickl.com) and PMC-100-0 Photo-multiplier-tube (spectral sensitivity: 300 to 650 nm). To maintain cell viability, we selected the average excitation power at the specimen plane to be 8 mW, requiring at least 2 min to collect acceptable photon counts. Photobleaching at this imaging condition was less than 10%, negligible for FLIM analysis. The decay data were analyzed by the BH SPCImage software (V3.8.9), which allows single/multiexponential curve fitting on a pixel-by-pixel basis using a weighted least-squares numerical approach. Cellular NADH lifetime images were analyzed for two components to produce for each pixel a shorter lifetime for free NADH and a longer lifetime for bound NADH, and their respective percentages (i.e., pre-exponential factors), which are used to calculate the bound/free NADH ratio. Cellular TRP lifetime images were obtained by the single-exponential fitting and a more complicated decay model (i.e., double-exponential) did not yield any significant improvement of fitting. This may be due to the insufficient photon counts of TRP. Nevertheless, the TRP single-exponential fitting results were sufficient in our studies. At the completion of the cellular imaging experiments, the standard solutions were reimaged to ensure no changes to the instrument had occurred during the experiment (i.e., lifetime or intensity). The measured lifetime of TRP (3.3 ns) and NADH (0.67 ns) in solution was consistent with that reported in literature.4 We measured the TRP fluorescence emission intensities (, photon counts) at different average laser power levels (, mW) and plotted versus as shown in Fig. 1(c). This plot clearly shows a cubic dependence of the TRP intensity on the average laser power for the 3P excitation at 740 nm, also reported in the literature.5 The TRP lifetime decreased from 3.02 to 1.54 ns in the presence of NADH (from solutions buffered at pH 6.5) at low to higher (0.25 to 2.5 mM) concentrations as a result of quenching by energy transfer to NADH molecules (unpublished data). From spectrofluorometer measurements (data not shown) we also found that NADH quenched TRP in solution. Further, the Förster distance (Ro) for the RET between TRP and NADH was estimated to be 22.66 Å, close to the TRP-NADPH Ro value (23.4 Å) given in the literature.4 Fig. 1Three-photon (3P) FLIM-FRET imaging of TRP–NADH interactions: (a) The representative lifetime images of TRP, free and protein-bound NADH. (b) The corresponding protein-bound:free NADH ratio image. (c) Effect of the average laser power (Log ) dependence on the emission intensity (Log ) of tryptophan (TRP). (d) Averages and standard deviations of the TRP fluorescence lifetimes [•] and the protein-bound:free NADH ratios [○] as a function of perturbation with 5 mM glucose in live HeLa cells. (e) Scatter plot of 300 selected ROIs from both the absence (NG) and the presence (G) of glucose, which clearly shows the decreased TRP lifetime with the increased protein-bound:free NADH ratio in the presence of glucose in HeLa cells.  A total of 40 to 50 cells were selected between 7 and 10 different images. Figures 2 and 3 represent data from 40 to 50 cells with approximately 300 regions of interest (ROI). Fig. 2Mean and standard deviations of the FRET efficiency () as a function of TRP quenching with (gray) and without (black) glucose in MCF10A and HeLa cells in cytosol-mitochondria and nucleus. 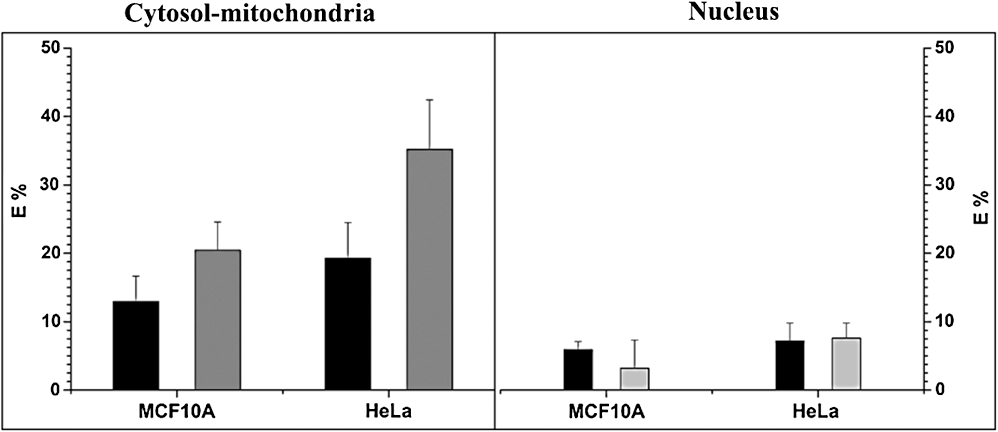 Fig. 3Mean and standard deviations of protein-bound:free NADH ratio in relation with TRP quenching in cytosol-mitochondria and nucleus with (gray) and without (white) glucose between MCF10A [○] and HeLa [□] cells.  Preliminary studies indicated that the most dramatic change in TRP lifetime quenching in MCF10A and HeLa cells occurred 30 min after perturbation with glucose. Consequently, we concentrated our analysis on samples after 30 min of the perturbation studies. We defined the criteria for the selection of ROIs based on the NADH fluorescence lifetime image (intensity ) in cells with the presence and absence of glucose. Figure 1(d) and 1(e) shows the quenching of TRP as a decrease in its lifetime observed after the addition of 5 mM glucose to the HeLa cells. This result suggests that there is an increase in protein-bound NADH levels due to changed cellular metabolic states. Our further investigation shows increased quenching of TRP fluorescence in tumorigenic HeLa cells compared to nontumorigenic MCF10A cells (Fig. 2). To determine energy transfer efficiencies (), , which is the quenched lifetime of TRP by NADH in live cells, and is measured from the pure TRP solution as a reference base. Figure 2 shows the average and standard deviations (SD) for ROIs selected from cytosol-mitochondria and nucleus of cells with as a function of TRP quenching. The mean cytosol-mitochondria of MCF10A is (absence of glucose) and (presence of glucose). For HeLa cells, the cytosol-mitochondria is without glucose and with glucose at increased NADH content; analysis of variance (ANOVA) statistics showed statistically significant differences () of the between MCF10A and HeLa cells. The observed with and without glucose in the nucleus of MCF10A ( and ) and HeLa ( and ) cells was found to be statistically nonsignificant when compared to observed in cytosol-mitochondria. Figure 3 shows the mean and SDs (for all ROIs combined) of the TRP fluorescence lifetimes and ratios of protein-bound and free NADH in cytosol-mitochondria and nucleus, respectively. One-way ANOVA tests between HeLa and MCF10A cells show statistically significant differences () in the TRP fluorescence lifetimes and ratios of protein-bound and free NADH in the presence and absence of glucose. The average ratios of protein-bound:free NADH in HeLa cells treated with glucose are statistically higher than HeLa cells without glucose and MCF10A cells with/without glucose, i.e., an increase in protein-bound form versus free NADH within cells. The result suggests that protein-bound NADH is increased due to glycolysis and oxidative phosphorylation, which markedly quenches TRP lifetime. Our investigations suggest that the TRP fluorescence lifetimes in the cytosol-mitochondria are quenched by NADH at higher bound/free ratios. Thus, 3P-FLIM-FRET provides the ideal methodology to follow the TRP quenching pattern in different pathologies such as cancer, diabetes, and other clinical disease conditions. AcknowledgmentsWe would like to thank Ms. Kathryn Christopher for the cell preparation and Mr. Horst Wallrabe for his suggestions. We acknowledge funding from National Heart, Lung, and Blood Institute (PO1HL101871) and University of Virginia. ReferencesD. K. Birdet al.,
“Metabolic mapping of MCF10A human breast cells via multiphoton fluorescence lifetime imaging of the coenzyme NADH,”
Can. Res., 65
(19), 8766
–8773
(2005). http://dx.doi.org/10.1158/0008-5472.CAN-04-3922 CNREA8 0008-5472 Google Scholar
Q. YuA. A. Heikal,
“Two-photon autofluorescence dynamics imaging reveals sensitivity of intracellular NADH concentration and conformation to cell physiology at the single-cell level,”
J. Photochem. Photobiol. B, 95
(1), 46
–57
(2009). http://dx.doi.org/10.1016/j.jphotobiol.2008.12.010 JPPBEG 1011-1344 Google Scholar
D. L. HeintzelmanR. LotanR. R. Richards-Kortum,
“Characterization of the autofluorescence of polymorphonuclear leukocytes, mononuclear leukocytes and cervical epithelial cancer cells for improved spectroscopic discrimination of inflammation from dysplasia,”
Photochem. Photobiol., 71
(3), 327
–332
(2000). http://dx.doi.org/10.1562/0031-8655(2000)0710327COTAOP2.0.CO2 PHCBAP 0031-8655 Google Scholar
J. R. Lakowicz, Principles of Fluorescence Spectroscopy, 3rd ed.Springer, New York
(2006). Google Scholar
S. Maitiet al.,
“Measuring serotonin distribution in live cells with three-photon excitation,”
Science, 275
(5299), 530
–532
(1997). http://dx.doi.org/10.1126/science.275.5299.530 SCIEAS 0036-8075 Google Scholar
Y. SunR. N. DayA. Periasamy,
“Investigating protein-protein interactions in living cells using fluorescence lifetime imaging microscopy,”
Nat. Protoc., 6
(9), 1324
–1340
(2011). http://dx.doi.org/10.1038/nprot.2011.364 NPARDW 1750-2799 Google Scholar
Y. ChenA. Periasamy,
“Characterization of two-photon excitation fluorescence lifetime imaging microscopy for protein localization,”
Microsc. Res. Tech., 63
(1), 72
–80
(2004). http://dx.doi.org/10.1002/(ISSN)1097-0029 MRTEEO 1059-910X Google Scholar
FLIM Microscopy in Biology and Medicine, Taylor and Francis, CRC Press, New York
(2010). Google Scholar
M. C. Skalaet al.,
“In vivo multiphoton fluorescence lifetime imaging of protein-bound and free nicotinamide adenine dinucleotide in normal and precancerous epithelia,”
J. Biomed. Opt., 12
(2), 024014
(2007). http://dx.doi.org/10.1117/1.2717503 JBOPFO 1083-3668 Google Scholar
R. Moreno-Sánchezet al.,
“Energy metabolism in tumor cells,”
FEBS J., 274
(6), 1393
–1418
(2007). http://dx.doi.org/10.1111/j.1742-4658.2007.05686.x 1742-464X Google Scholar
T. Torikataet al.,
“Lifetimes and NADH quenching of tryptophan fluorescence in pig heart lactate dehydrogenase,”
Biochemistry, 18
(2), 385
–390
(1979). http://dx.doi.org/10.1021/bi00569a024 MIRBD9 0144-0578 Google Scholar
|


