|
|
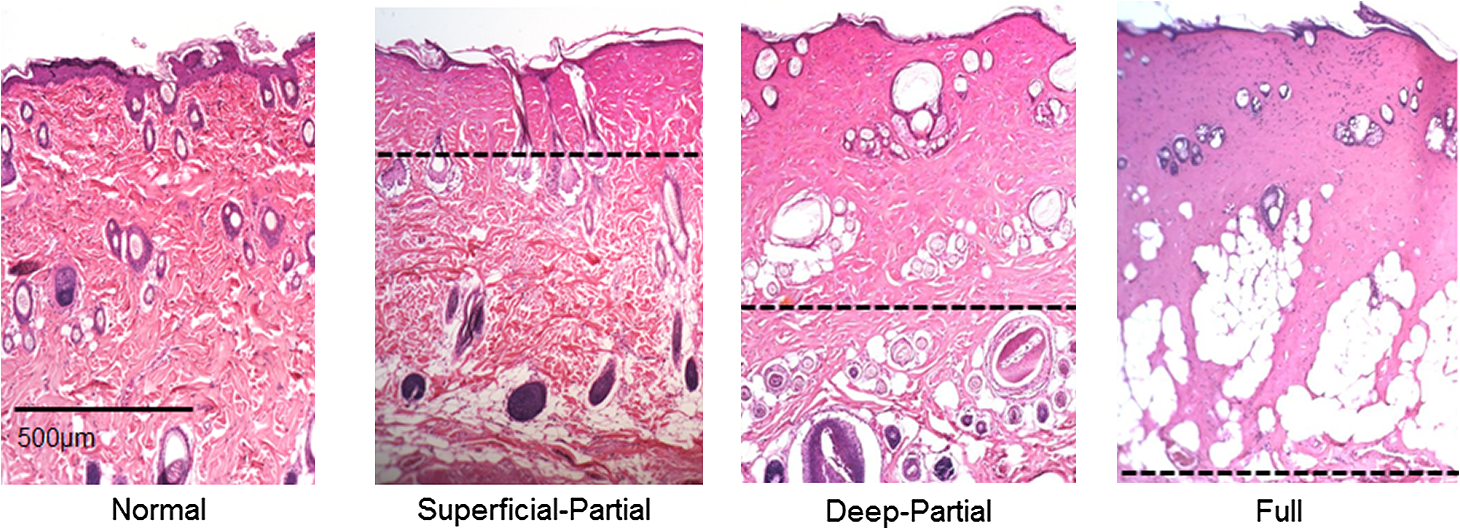
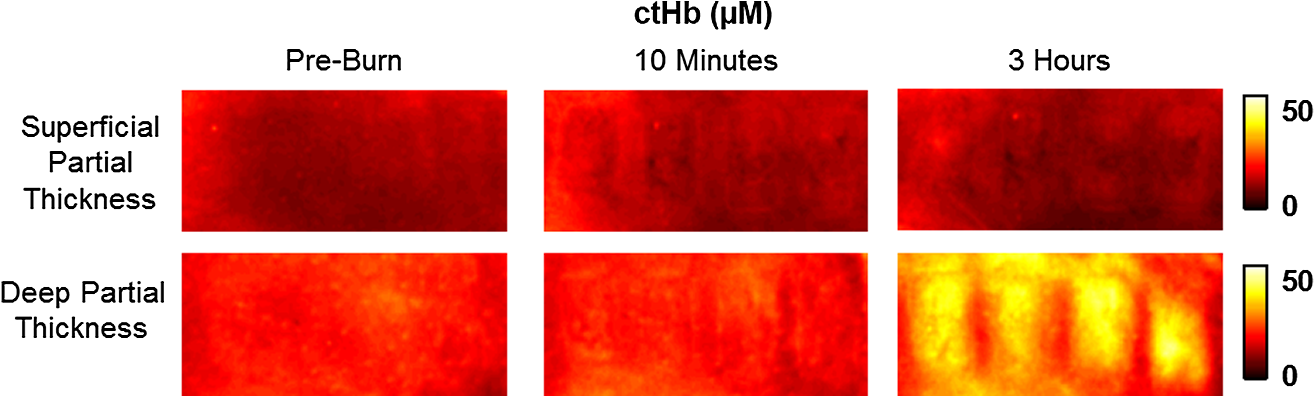
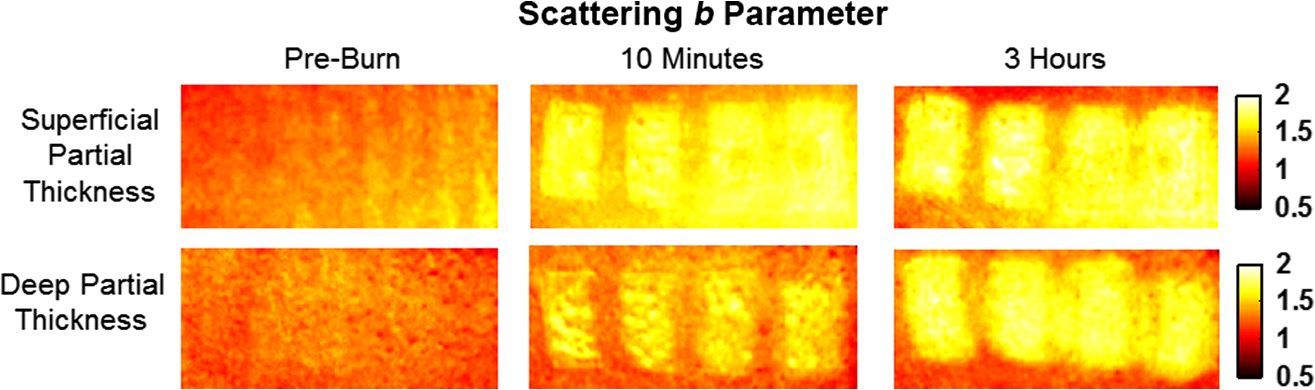
1.Introduction1.1.Burn Wound EvaluationThermal injuries can be caused by exposure to a wide variety of sources including heat, electricity, radiation, chemicals, and friction. According to the American Burn Association, approximately 500,000 people seek treatment for burn injuries every year.1 Of that population, about 45,000 have burn injuries requiring medical treatment with about 3500 cases resulting in death. Skin burns are normally characterized by depth of injury.2 Starting with the least serious, superficial burns involve injury to the top epidermis layer. These often have a reddish nonblistering appearance (e.g., sunburns) due to increased blood flow to the dermis. They are often hypersensitive to touch and heal in less than 2 weeks via re-epithelialization. On the other end of the spectrum are full thickness burns, which extend beyond the epidermal and dermal layers of the skin into the subcutaneous layer. These burns often appear leathery, firm, and depressed and are insensitive to pinpricks due to complete destruction of the dermis including nerves and vasculature. Full thickness burns require full excision and grafting as a treatment. Both superficial and full thickness burns are relatively easy to diagnose based on clinical observation. In between these two extremes are superficial-partial thickness and deep-partial thickness burns in which damage extends to a fraction of the dermal layer.2 Superficial-partial thickness burns extend to only the upper layers of the papillary dermis, and depending on the extent of damage and remaining vasculature, these injuries may naturally heal in 2 to 3 weeks with minimal to no scarring. Deep-partial thickness burns extend in depth to the reticular dermis and can often be found mixed with portions of noncharred full-thickness burns. These burns often require excision and grafting for optimal treatment. Both categories of partial thickness burns often have a mottled pink and white appearance that can bleach with pressure, and are less sensitive to pinpricks than normal. Partial thickness burns are therefore challenging to identify based on clinical impression. Depending on the clinician’s experience, visual assessment has been shown to have a field accuracy of about 50% to 76%.3 Overestimation of burn severity results in unnecessarily invasive surgical treatment and prolonged hospitalization, whereas underestimation results in treatment delays, extended hospital stays, and increased chances of contracture and hypertrophic scar formation. Further complicating the situation, burns also undergo dynamic burn wound conversions during the early 48-h period in which superficial-partial thickness burns have been observed to progress into deep-partial thickness or full thickness burns.4 The conversion process is not fully understood, but it is generally agreed that continuous monitoring of early-stage burns is necessary for deciding optimal treatment and management.2 Tissue punch biopsy and histological analysis, despite being the long-standing gold standard for determining burn depth, are far from ideal. Apart from being an invasive and time-consuming process that requires the presence of an experienced pathologist, it is also vulnerable to sampling errors due to burn area heterogeneity.5 Currently, there are a number of optical imaging technologies in development that may be used to estimate burn depth noninvasively. Technologies such as near-infrared spectroscopy (NIRS)5 and hyperspectral imaging provide information about burned tissue health by measuring clinically relevant chromophores such as blood oxygen saturation and water concentration. Laser Doppler imaging (LDI) correlates tissue blood flow with burn severities,6 whereas optical coherence tomography (OCT) correlates structural collagen denaturation with burn depth.7 However, these technologies are not without their limitations. LDI, NIRS, and OCT are generally point-based instruments that require patients to remain completely still during potentially long acquisition times in order to acquire full area scans, whereas hyperspectral imaging techniques often require assumptions about tissue optical scattering properties that may not be valid in damaged tissue.8 As of now, perfusion monitoring LDI is the only Food and Drug Administration-approved commercial technology for monitoring burns. Despite an often reported accuracy of up to 97% when utilized at least 48 h post-burn, LDI is markedly less accurate (54% to 80%) when utilized within the first 24 h of injury due to the effects of reactive vasoconstriction.9,10 Additionally, LDI is sensitive to errors caused by fluctuations in the ambient temperature, the patient’s emotional state, and the shifts in blood pooling resulting from the patient’s position during imaging.11 1.2.Spatial Frequency Domain ImagingSpatial frequency domain imaging (SFDI) is a noncontact wide-field optical imaging technology currently being developed at the Beckman Laser Institute and Medical Clinic in Irvine, California. By combining periodic spatially modulated illumination with a camera-based imaging system, SFDI is capable of quantifying wide-field subsurface optical properties which can then be utilized to quantify chromophore concentrations for in vivo tissue.12 During imaging, spatially modulated illuminations are projected onto the region of interest over a range of wavelengths. Diffusely reflected light is recorded using a charge-coupled diode (CCD) camera and then demodulated in order to extract the diffuse reflectance at each wavelength and spatial frequency, which can then be further reduced into absorption () and reduced scattering () coefficients by fitting to a known forward model. Previous validation studies originating from our group using tissue-simulating phantoms have reported an accuracy of approximately 6% and 3% in absorption and reduced scattering parameters respectively.12 In terms of sensitivity, the same study has also shown that a 1% change in absorption or scattering produces at most an approximate 0.3% change in diffuse reflectance. Biological chromophores are fit to Beer’s law using a least squares fit. With the ability to interrogate skin depths of about 1 to 5 mm, SFDI is able to measure spatially resolved concentrations of clinically relevant chromophores including oxyhemoglobin, deoxyhemoglobin, lipid, water, and tissue oxygen saturation. In addition, SFDI is able to measure quantitative wide-field reduced scattering coefficients at each wavelength. Within the context of burns, the ability to measure the changes in scattering has the potential to confer information related to the changes in structure resulting from denaturation. Further details of the SFDI approach can be found in our previously published work.12 In this study, we investigate the use of SFDI in order to quantitatively evaluate burn wound severities in a rat model. The objective of this study is to map quantitative changes in spatially resolved tissue oxygenation, water concentration, and reduced scattering that may be indicative of burn wound severity and relate these changes to burn severity as reported by hematoxylin and eosin (H&E) histology. 2.Materials and Methods2.1.Animal SubjectsSeventeen male Sprague-Dawley rats, weighing 350 to 600 g, were used in this study. Housing and care for animals were in accordance with UC Irvine’s University Laboratory Animal Resources. The burn model and study protocol were approved according to the UC Irvine Institutional Animal Care and Use Committee (IACUC #1999-2064). 2.2.Burn Model and Study ProtocolBurn injuries were created using a previously established13 heated “brass comb” shown in Fig. 1. The custom-made comb weighs 313 g and consists of four notches measuring separated by 0.5 cm gaps. On the day before experiments, each rat was shaved along the lateral dorsal region of the body using electric clippers and depilated with Nair (Church and Dwight, Princeton, NJ). During experiments, the rats were anesthetized using an intraperitoneal injected mixture of ketamine hydrochloride and xylazine with additional boosters administered as necessary. The brass comb was heated to 100°C via immersion in a boiling water bath and applied onto the shaved lateral dorsal region without additional pressure (gravity only) for 2 to 15 s in order to create burns of graded severity, ranging from superficial-partial thickness to full thickness. After imaging the rats every 10 to 20 min for 3 h post-burn, the rats were euthanized using pentobarbital, and the burn region was excised into 10% buffered formalin where they were fixed for 24 h before being prepared for histology. In each case, burn severity was verified using standard H&E staining and optical microscopy (Olympus BH2, Tokyo, Japan). 2.3.Instrumentation and Data AcquisitionThe SFDI instrument used in this study consists of a 250-W tungsten lamp light source (Newport Oriel, Stratford, CT) used to illuminate spatially modulated projections created by a digital micromirror device (DMD) (Texas Instruments, Dallas, TX) at an illumination angle of 0 deg. A diagram illustrating the instrumentation can be seen in Fig. 2; however, for the sake of visual clarity, the actual illumination angle is not apparent. Diffusely reflected light was captured using a multispectral CCD camera (Nuance, Cri, Inc., Woburn, Massachusetts) consisting of a liquid-crystal tunable filter for wavelength selection and a pair of linear cross polarizers to reject specular diffuse reflectance. Images were saved as binary files for post-acquisition processing via MATLAB (MathWorks, Inc., Natick, MA). For the purpose of this study, a field-of-view was imaged over the course of 3 h at two spatial frequencies: 0 and . Seventeen spectral wavelengths between 650 and 970 nm were acquired in 20 nm intervals, and the diffuse reflectance images were calibrated for system response using tissue-simulating phantoms with known optical properties ( and at 650 nm). Effects related to variations in height and curvature were ameliorated using a 3-D profile intensity correction as described by Gioux et al.14 Pixel-by-pixel optical property values were calculated using a two-frequency look-up-table approach based on Monte-Carlo forward predictions.12,15 Chromophore concentrations were calculated from the absorption spectrum according to Beer’s law. In addition, reduced scattering () was fit to a model based on infrared Mie theory approximation, , where is the imaging wavelength and and are free variables determined by a least squares fit.16 The scattering parameter, in particular, was analyzed in this study as it is a possible indicator of scattering moiety size changes related to tissue denaturation. 2.4.Statistical AnalysisIn order to determine if there was a statistically significant difference in each SFDI derived parameter at each time point, a Welch’s -test was used to compare the relative changes between superficial-partial thickness and deep-partial thickness burns. We have chosen to focus on these two burn types in particular as the differentiation between these two burn types is clinically difficult, as we discussed in Sec. 1. A -value of less than 0.05 was considered significant for this study. 3.Results3.1.HistologyBurn severities for each sample were verified, post-experiment, via H&E staining and optical microscopy. Depth of burn was determined, as suggested by the literature and in concurrence with a specialized clinician, by examining for viable adnexal structures (such as hair follicles and sweat glands) and by examining for the appearance of glass-like collagen hyalinization.17,18 Examples of H&E stained cross-sections for each burn type can be seen in Fig. 3. In developing our rat burn model, we were able to induce 20 superficial-partial thickness burns, 34 deep-partial thickness burns, and 8 full thickness burns. 3.2.SFDI Parameter Maps and Time PlotsAfter examining all of the chromophore and optical property data that resulted from the study, SFDI data analysis was concentrated on three parameters that may be useful for differentiating partial thickness burns: blood oxygenation, water concentration, and optical scattering changes. Time plots with standard deviations were generated from the averages of each burn severity population. To illustrate SFDI’s wide-field imaging capabilities, maps of oxygen saturation, deoxygenated hemoglobin concentration, water concentration, and scattering parameter for two partially burned rats are presented. 3.2.1.Blood oxygenationRelative changes in oxygenated hemoglobin concentration (), deoxygenated hemoglobin concentration (ctHb), total hemoglobin concentration (ctHbT), and blood oxygen saturation () are shown in Fig. 4. SFDI-generated maps for two partially burned rats can be seen in Fig. 5 and SFDI-generated ctHb maps for the same two rats can be seen in Fig. 6. While no significant differences were observed in the relative changes for and ctHbT, significant differences in the relative changes of ctHb were observed starting at 50 min post-burn (). Differences in were not statistically significant until 3 h post-burn (). Fig. 4Percent changes of (a) oxygenated hemoglobin concentration, (b) deoxygenated hemoglobin concentration, (c) total hemoglobin concentration, and (d) oxygen saturation over the 3-h imaging period for both partial thickness burn populations. Regions of interests were selected directly over burn wounds. Time points with significant differences are marked with an asterisk.  3.2.2.Water concentrationRelative changes in water concentration () are depicted in Fig. 7, and SFDI-generated maps for two partially burned rats can be seen in Fig. 8. Statistically significant differences in were observed starting at 10 min post-burn (). 3.2.3.Scattering parameterRelative changes in scattering parameter can be seen in Fig. 9, and SFDI-generated maps for two partially burned rats can be seen in Fig. 10. Significant differences in scattering parameter were observed starting at 10 min post-burn (). 4.DiscussionFor the first time, our laboratory has developed a model of graded burn severity for SFDI. As seen in Sec. 3, SFDI can be used to monitor chromophore concentrations and optical properties over a wide field-of-view. During the 3-h post-burn period, we were able to observe dynamic changes in blood oxygenation, water concentration, and optical scattering that have potential for aiding the process of assessing burn severity. 4.1.Tissue OxygenationTissue oxygenation maps may be an indicator of vascular damage and patency. As seen in Figs. 4Fig. 5–6, we were able to observe how tissue blood oxygenation varied depending on burn severity. Within the first 10 min after burning, an approximately 40% increase in was observed for both partial thickness burns, possibly due to inflammatory vasodilation and increased oxygenated blood flow into the injured regions.19 During the remainder of the 3-h post-burn imaging period, for deep-partial thickness burns gradually decreased to 10% below baseline, whereas for superficial-partial thickness burns remained about 25% above baseline. At the same time, ctHb for deep-partial thickness burns gradually increased to about 50% above baseline while ctHb for superficial-partial thickness burns remained close to baseline. This gradually significant increase in ctHb over time combined with the complimentary decrease in the deep partial-thickness burn may be indicative of capillary blood stasis due to deep dermis thrombosis and ischemia resulting from the burn. The same trend is not observed in the superficial-partial thickness burns, suggesting that much of the underlying vasculature in these burns may still be intact albeit with higher inflammatory blood perfusion. These are promising results as clinical LDI measurements from other groups have consistently shown that higher blood perfusion in superficial-partial thickness burns is well correlated with faster healing times, whereas lower perfusion in deep-partial and full thickness burns may warrant surgical treatment.9 4.2.Water ConcentrationSFDI water concentration maps may be an indicator of edema formation. As seen in Figs. 7 and 8, we were able to observe different increases in tissue water concentration for each type of burn presented. Superficial-partial thickness burns, though elevated, stayed about 10% above baseline during the entire post-burn period, whereas the deep-partial burns exhibited a large steady increase to about 45% above baseline over the course of the 3-h period. Burn injuries often cause extravasation of interstitial fluids into burn wounds and surrounding tissues.20 By nature of the collagen damage, these injuries often exhibit abnormal osmotic and hydrostatic pressure gradients that worsen with burn depth and normal inflammatory response.4 As suggested by Stamatas et al. in their hyperspectral imaging study of controlled skin inflammation, the interstitial fluid accumulation can eventually exert enough pressure upon both blood and lymphatic vessels leading to further proliferation of ischemia and edema buildup.19 It is possible that this mechanism may be responsible for the negative wound conversion found in many of our deep-partial thickness burn samples. 4.3.Scattering Changes Due to Thermal DamageSFDI scattering values may be an indicator of scattering moiety size due to tissue denaturation. As seen in Figs. 9 and 10, changes in scattering values varied depending on burn severity. Both superficial-partial and deep-partial thickness burns showed a gradual increase in over the 3-h post-burn period, with the deep partial-thickness burn having the largest change in . As described in Sec. 2.3, scattering values are related to average optical scatter size present in the tissue, whereas higher values are suggestive of smaller scattering radiuses and viceversa.21 Burn injuries often involve thermal denaturation of organelles, heterogeneous structures, and collagen22 (the “glassy” hyalinization observed in H&E histology). The results of this study suggest that these effects can manifest as smaller average scattering particle size compared to normal for superficial-partial thickness and deep-partial thickness burns. Apart from being statistically significant for the purpose of differentiating partial burn severities, parameter maps were often the clearest in terms of spatially delineating the extent of the burned regions when compared to the SFDI maps for tissue oxygenation and water concentration. 5.ConclusionThe results of this study suggest that SFDI-derived data may be useful for early quantitative noninvasive assessment of burn wound severity. Here, we have demonstrated that SFDI can be used to visualize heterogeneous changes in blood oxygenation, water concentration, and optical scattering properties over a large (as opposed to microscopic) field-of-view, thereby allowing researchers and clinicians to better identify burn areas that are at risk of further vascular damage or edema progression. In addition to a longer term study to examine the combined predictive capability of these SFDI-related parameters in determining burn severity, future studies will also include a multimodal study utilizing both SFDI and a perfusion-based technique for understanding the complete vascular changes that occur within a burn wound. AcknowledgmentsWe would like to gratefully thank Hongrui Li for her help and advice regarding the histology used in this study. We also gratefully acknowledge support from the Beckman Foundation and the NIH, including P41EB015890 (a Biomedical Technology Resource) from NIBIB and the Military Medical Photonics Program, AFOSR Grant # FA9550-08-1-0384. ReferencesQ. B. Palmer,
“National Burn Repository: Report of Data from 2001 to 2010,”
(2011). Google Scholar
D. Heimbachet al.,
“Burn depth: a review,”
World J. Surg., 16
(1), 10
–15
(1992). http://dx.doi.org/10.1007/BF02067108 WJSUDI 0364-2313 Google Scholar
A. D. Jaskilleet al.,
“Critical review of burn depth assessment techniques: part I. Historical review,”
J. Burn Care Res., 30
(6), 937
–947
(2009). http://dx.doi.org/10.1097/BCR.0b013e3181c07f21 1559-047X Google Scholar
V. Singhet al.,
“The pathogenesis of burn wound conversion,”
Ann. Plast. Surg., 59
(1), 109
–115
(2007). http://dx.doi.org/10.1097/01.sap.0000252065.90759.e6 APCSD4 0148-7043 Google Scholar
M. Kaiseret al.,
“Noninvasive assessment of burn wound severity using optical technology: a review of current and future modalities,”
Burns: J. Int. Soc. Burn Injuries, 37
(3), 377
–386
(2011). http://dx.doi.org/10.1117/1.1629680 JBOPFO 1083-3668 Google Scholar
A. D. Jaskilleet al.,
“Critical review of burn depth assessment techniques: part II. Review of laser doppler technology,”
J. Burn Care & Res. : Official Publication of the American Burn Assoc., 31
(1), 151
–157
(2010). JIDEAE 0022-202X Google Scholar
S. M. Srinivaset al.,
“Determination of burn depth by polarization-sensitive optical coherence tomography,”
J. Biomed. Optics, 9
(1), 207
–212
(2004). http://dx.doi.org/10.1078/0171-9335-00222 EJCBDN 0171-9335 Google Scholar
A. S. Nunez,
“A Physical Model of Human Skin and Its Application for Search and Rescue,”
Air Force Institute of Technology,
(2010). Google Scholar
S. A. PapeC. A. SkourasP. O. Byrne,
“An audit of the use of laser Doppler imaging (LDI) in the assessment of burns of intermediate depth,”
Burns, 27
(3), 233
–239
(2001). http://dx.doi.org/10.1016/S0305-4179(00)00118-2 BURND8 0305-4179 Google Scholar
H. Hoeksemaet al.,
“Accuracy of early burn depth assessment by laser Doppler imaging on different days post burn,”
Burns, 35
(1), 36
–45
(2009). http://dx.doi.org/10.1016/j.burns.2008.08.011 BURND8 0305-4179 Google Scholar
C. L. Riordanet al.,
“Noncontact laser Doppler imaging in burn depth analysis of the extremities,”
J. Burn Care & Rehabil., 24
(4), 177
–186
(2003). http://dx.doi.org/10.1016/j.burns.2010.11.012 BURND8 0305-4179 Google Scholar
D. J. Cucciaet al.,
“Quantitation and mapping of tissue optical properties using modulated imaging,”
J. Biomed. Opt., 14
(2), 024012
(2009). http://dx.doi.org/10.1117/1.3088140 JBOPFO 1083-3668 Google Scholar
A. J. Singeret al.,
“Curcumin reduces injury progression in a rat comb burn model,”
J. Burn Care Res., 32
(1), 135
–142
(2011). http://dx.doi.org/10.1097/BCR.0b013e318203337b 1559-047X Google Scholar
S. Giouxet al.,
“Three-dimensional surface profile intensity correction for spatially modulated imaging,”
J. Biomed. Opt., 14
(3), 034045
(2009). http://dx.doi.org/10.1117/1.3156840 JBOPFO 1083-3668 Google Scholar
T. A. Ericksonet al.,
“Lookup-table method for imaging optical properties with structured illumination beyond the diffusion theory regime,”
J. Biomed. Opt., 15
(3), 036013
(2010). http://dx.doi.org/10.1117/1.3431728 JBOPFO 1083-3668 Google Scholar
X. Wanget al.,
“Approximation of Mie scattering parameters in near-infrared tomography of normal breast tissue in vivo,”
J. Biomed. Opt., 10
(5), 051704
(2005). http://dx.doi.org/10.1117/1.2098607 JBOPFO 1083-3668 Google Scholar
T. W. PankeC. G. McLeod, Pathology of Thermal Injury: A Practical Approach, Grune & Stratton, Inc., Orlando, FL
(1985). Google Scholar
S. Thomsen,
“Pathologic analysis of photothermal and photomechanical effects of laser-tissue interactions,”
Photochem. Photobiol., 53
(6), 825
–835
(1991). PHCBAP 0031-8655 Google Scholar
G. N. StamatasM. SouthallN. Kollias,
“In vivo monitoring of cutaneous edema using spectral imaging in the visible and near infrared,”
J. Investig. Dermatol., 126
(8), 1753
–1760
(2006). http://dx.doi.org/10.1038/sj.jid.5700329 JIDEAE 0022-202X Google Scholar
M. Kecket al.,
“Pathophysiology of burns,”
Wien Med Wochenschr, 159
(13–14), 327
–336
(2009). http://dx.doi.org/10.1007/s10354-009-0651-2 WMWOA4 0043-5341 Google Scholar
J. R. Mourantet al.,
“Mechanisms of light scattering from biological cells relevant to noninvasive optical-tissue diagnostics,”
Appl. Optic., 37
(16), 3586
–3593
(1998). http://dx.doi.org/10.1364/AO.37.003586 APOPAI 0003-6935 Google Scholar
S. L. Thomsenet al.,
“Changes in optical properties of rat skin during thermal coagulation,”
Proc. SPIE, 1882 230
–236
(1993). http://dx.doi.org/10.1117/12.147663 Google Scholar
|