|
|
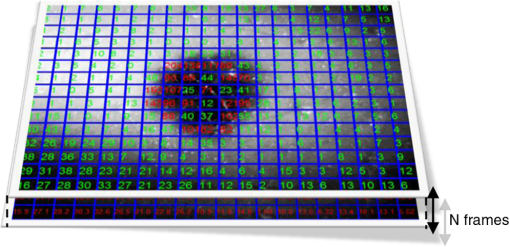
1.IntroductionOptical imaging of the skin to detect the signs of cancer is very common today.1–8 This is aided by increased computational power, and allows the physician to analyze the mole without the presence of the patient. Skin cancer usually arises in the epidermis and dermis layers.1,9 The physician’s eye may have difficulty reliably characterizing and classifing skin cancer from the observable superficial tissue layer when most of the backscattered light originates from the deeper tissue layers. Noninvasive optical diagnosis methods are becoming familiar lately, and much effort is dedicated to the development of cheap and compact tools for skin cancer detection.10–17 The advance of computers, as well as lasers and photonics, has made it possible to develop additional techniques that were impossible a few years ago. These approaches provide the dermatologist with sensitive tools to measure the skin’s condition in terms of physiologic parameters (e.g., color, shape, etc.). Epiluminescence microscopy (or dermatoscopy) was found to give more detailed inspection of the surface of pigmented skin lesions, and by using the oil immersion technique it permits the study of the dermoepidermal junction. This method enhanced the diagnostic accuracy of evaluating a number of morphological features normally invisible to the naked eye.18,19 Various imaging methods have been developed to produce images for skin cancer diagnosis from deep inside tissue such as confocal microscopy which has been achieved by detecting the single backscattering at a particular depth underneath the skin surface with a spatial filter.20,21 The ultraviolet (UV) light approach has an advantage in that UV rays are more selectively absorbed by melanin in the epidermis compared to visible light.22 Another approach uses THz radiation which is absorbed differently in cancerous tissue due to the increased water concentration.12 Several methods have been developed in the past to diagnose suspicious moles from visual images. The most common routine is simply looking at the mole23 with the naked eye or a magnifying glass. Most physicians use theoretical criteria and rely on visual-clinical experience to diagnose tumors on the skin, before sending the patient to get a biopsy.24 The best known guideline to identify signs of melanoma in color images is termed ABCDE.25,26 The ABCD criteria stands for: A—Asymmetry; a mole that, when divided in half, does not look the same on both sides (malignant moles are less symmetric); B—Border; a mole with blurry or jagged edges is more likely to be malignant; C—Color; changes in the color of a mole, including darkening, spread of color, loss of color, or the appearance of multiple colors such as blue, red, white, pink, purple, or gray; D—Diameter; a mole larger than diameter is also a possible characteristic of a malignant case. Newer studies also included the lesion evolution in the diagnosis of cutaneous melanoma, expressed as E (for “Evolving”).26 This measure quantifies changes of the mole (size, shape, color, etc.) during a period of time. In a more recent study, nonlinear methodologies in fractal analysis have been used to find new features of cancerous mole in these images.27 Since skin cancer often arises in the dermis where it disrupts the natural order of the collagen matrix, polarized-light imaging was proposed to detect cancer. New approaches for imaging skin cancer are being developed using polarized light.28–32 A light beam traveling through the superficial layers of the skin will have its polarization status changed by the local form birefringence matrix of collagen fibers. A new method for noninvasive imaging of the skin was developed recently using liquid-crystal devices for polarization and wavelength control.1,2 This method, is called optical rotational spectropolarimetric imaging (ORSI), gives unique information of the tissue by collecting scattered-rotated polarized light from it. This imaging system can operate at a wide spectral range from visible to near infrared (400 to 900 nm). Since the collagen and the fibrils textures orientations depend on their location in the skin and they are not well organized, ORSI scans the polarization states by continuously rotating a linearly polarized light incident on the lesion and collecting the reflected signal with a CCD camera. Because cheap cameras are usually used to keep the costs of the system moderate, the images produced by this system are slightly noisy. The cheap camera option will always remain valid, however, because of the wide distribution of such skin diagnostic tool it is important fotr it to have a low cost. Image noise can be always corrected in a cheaper way using digital processing. In this paper, we propose a method to classify the moles into malignant and benign by analyzing the images obtained by this system. Our algorithm automatically evaluates the polarized-rotated images by producing and assessing various characteristics, including asymmetry of compactness, border irregularity, local contrasts, and large-scale nonhomogeneity. 2.Formation of the ORSI ImagesThe ORSI system takes images of suspicious moles in different wavelengths that allow the examination of particular depths.2 It is based on novel liquid crystal devices for polarization and wavelength control developed in our group.33–36 The two main wavelengths that were used in the study are 520 and 700 nm. At 520 nm the penetration is about 100 μm (all of the epidermis area), and at 700 nm the penetration is about 200 μm (first layer of the dermis). Hence, for each of the moles examined, two sequences of ORSI images have been produced for the analysis. The recorded images were taken from 10 patients who came to remove various skin lesions in the Ambulatory Surgery Department of Plastic Surgery in Soroka University Hospital. The indications to remove the tumors were clinical suspicion of malignancy, functional or aesthetical disorder. In practice, before patients entered into surgery to remove the tumors, they were taken into a side room where the moles were photographed by the ORSI system. The ORSI produces a sequence of images, while the incident polarization angle is changed in small steps of 1 to 4 deg. At the end of this process, a video file is produced with the polarized images at different orientations. Examples of benign and malignant moles images obtained by a regular camera and the ORSI system are shown in Fig. 1. Fig. 1Mole images. (a) In the left, a standard visual image of a benign mole obtained with a digital camera; and in the right, the optical rotational spectropolarimetric imaging (ORSI) image of this mole. (b) The same as (a), but for a cancerous mole.  2.1.Averaging Frame DifferencesBoundaries and high-scattering zones are expected to be more sensitive to the changes of the incident light polarization angle.1,2 Thus, at these locations, larger differences in the images’ intensity between two or more angles (frames) are anticipated. On the other hand, areas that do not experience denaturization of the dermis or epidermis layers will likely exhibit weaker differences between images at different angles of the impinged polarization. Therefore, some further information about the mole structure can be obtained from the differences between frames obtained at near-polarization angles. By averaging the absolute value of the differences, regions with strong scattering, which represent the skin deformation, can be enhanced:2 where , are adjacent frames obtained at adjacent angles of the incident polarization, is the total number of rotated frames, and AFC is the normalized sum of rotated frame differences. It is likely that backscattering in areas that do not have significant deformation will hardly change when altering the polarization angle, while an area in the mole with high deformation will be more prominent.23.Preprocessing and Feature FormationThe proposed method can be divided into two main parts. The first part is preprocessing and feature formation, which includes image denoising, intensity-based segmentation of the mole, and contour formation of the segmented regions. The second part is the classification of the mole based on analyzing the produced features. This part includes assessing of the asymmetry and border-irregularity characteristics in their AFC and the cross-image local contrast and large-scale homogeneity (variations) of the ORSI images. 3.1.Image DenoisingORSI images have a relatively high level of noise, as explained above, due to the use of relatively low-cost camera. For a more reliable analysis of the images, denoising them with minimum information loss is desired. Various methods exist for image denoising, and several well-used methods were tested on the ORSI images, including median filtering,37 Gaussian smoothing,37 wavelet denoising,38 and bilateral filtering.39 We selected the median-filtering method because, while being relatively simple, it showed a better ability to preserve the borders of the mole. 3.2.Segmentation of the Mole StructureIn order to produce mole characteristics, we have to define the mole region within the ORSI image. Since the moles do not have clear shape boundaries and the images contain intensity irregularities and some remaining noise, the mole region could not be defined using the standard-edge detection (i.e., by detecting locations of strong intensity variations). However, since the mole area (both types) is generally characterized by darker intensity values, a brightness-based segmentation was carried out based on the image gray-level histogram. A threshold, adapted to each image, was obtained using the Otsu technique40 in which a gray-level threshold divides the image into two clusters: (below ) with mean and variance and above or equals ) with mean and variance . Defining , the optimal threshold will maximize where is the within-class variance, is the between-class variance, and and are the weights of each class.4.Classification MeasuresFor the analysis of the imaged moles, we quantify properties of the ORSI images, properties across the sequence of images, and properties of the AFC images where the disordered border is emphasized (the last two measures). 4.1.Local Contrast Across the ORSI ImagesThe hypothesis is that macroscopic changes due to dysplasia will generate larger differences in the backscattered light. This measure aims to find how the mole type influences the differences in the backscattered light across images at local areas. The measure is calculated according to the following steps:
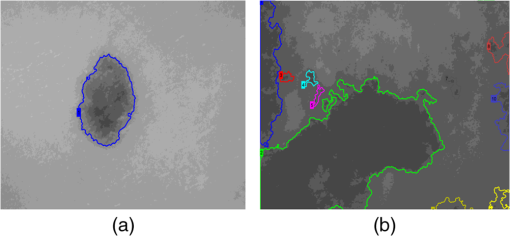
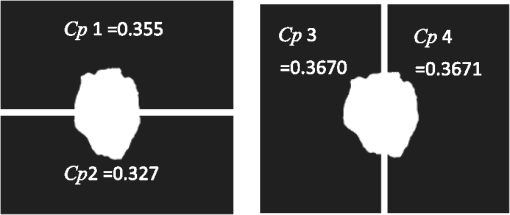
4.2.Large-Scale HomogeneityWe have visually observed in the ORSI images that malignant moles have more structural large-scale variations, i.e., hill-like shapes within the mole region, compared with benign moles. A good measure of this structural dissimilarity can be the number of such hills (or “segments”) that construct the mole. This can be a measure of a large-scale nonhomogeneity in the malignant moles with regard to a homogeneous behavior of the benign moles. This measure can be seen as complementary to the small-scale contrast measure shown in Sec. 3.1. A threshold-based segmentation of the mole was implemented to the ORSI images. The threshold level was chosen according to Sec. 3.2. An example of the resulting segmentation is shown in Fig. 3 for cases of benign and malignant moles [Fig. 3(a) and 3(b), respectively]. It can be seen that while only one segment was produced for the benign-mole case, many segments were produced in the malignant-mole case. 4.3.Symmetry of Compactness of the MoleA symmetry measure is carried out by first splitting the segmented mole twice, once in the vertical direction and once in the horizontal, and by crossing the center of mass of the mole segment. The center of mass is the point at which the same number of pixels exists at the two halves of the splits in both directions. After splitting the mole [Fig. 4(b)], the similarity between the halves is quantified. We use the normalized-compactness measure that quantifies the efficiency of the contour to contain a given area,41 where is the contour perimeter and is the area enclosed. The smaller the area contained by a contour of a given length, the larger the value of this measure will be. It has a lower bound of 0 for a circle, and increases with the complexity of the contour to a maximum value of 1. The compactness measure is calculated for each half in both directions. For example, Fig. 5 presents the splitting and compactness values of the benign mole of Fig. 4(a).Fig. 4(a) An AFC image of the benign mole as shown in Fig. 1(a). (b) The segmented and split mole. The blue line outlines the mole region segmented according to Sec. 3.2, and the red lines show the vertical and horizontal splits of the bounded region.  After calculating the Cp values, we calculate the similarity of compactness of both horizontal and vertical splits. For the horizontal split, For the vertical split, Finally, we calculate the symmetry of compactness of the mole by averaging the two similarities of the horizontal and vertical splits using For images at which more than one segment is found by the previous measure, this similarity measure is calculated for all the detected segments, and the similarity with the lowest value is used. 4.4.Border Irregularity of the MoleFor disorder recognition in the border of the mole, we used fractal dimension (FD) algorithm using the box-counting method. Fractal geometry42 provides a mathematical model for the shapes of many complex objects found in nature such as coastlines, mountains, and clouds. These objects are not suitable for description by Euclidean geometry. Self-similarity is an essential property of fractals in nature and may be quantified by the FD value. The FD has been applied in texture analysis and segmentation, shape measurement, and graphic analysis in other fields. The box-counting method for the calculation of the FD of a pictorial shape can be performed as follows: Place the picture on a grid by dividing the image into equal-size boxes. Then, count the number of boxes that the shape touches and label this number (Nr). Now, reduce the grid-box sizes and repeat the process several times. Plot the values found on a graph where the -axis is the log(s) and the -axis is the , and where is the box-edge size. Draw the line of best fit, and find the slope. The box-counting dimension measure is the slope of that line (Fig. 6). 5.ResultsThere were 20 ORSI sequences of rotated-polarization skin mole images available for this study. Figures 7Fig. 8Fig. 9–10 present the results of each of the above measures, and Fig. 11 presents a resulting mole classification space. In Figs. 7–10 the right red bars, indexed 1 to 10, are the results of the malignant moles, while the left blue and purple bars, indexed 11 to 20, represent the benign moles. The moles indexed 13 and 18 (purple bars in Figs. 9 and 10) are benign moles with high dysplasia, becoming-cancerous moles. The clinical check of moles 13 and 18 by a medical doctor (MD) was that they are benign moles. But after these moles were checked by pathology MDs, who examined the biopsies, it was seen that these moles have higher dysplasia than all the benign moles and are becoming cancerous moles. Fig. 7Results of the local contrast across the ORSI images measure. Mole numbers 1 to 10 are the cancerous moles and 11 to 20 are the benign moles. 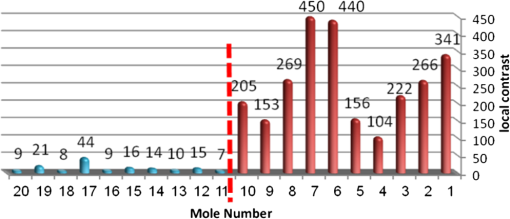 Fig. 8Results of the large-scale homogeneity measure. Moles 1 to 10 are the cancerous and 11 to 20 are the benign. 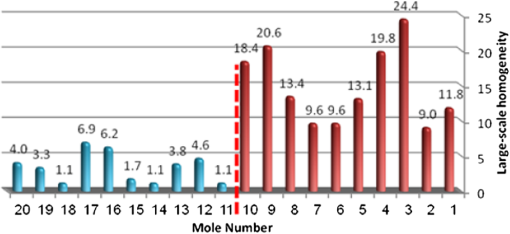 Fig. 9Results of the symmetry of compactness measure. Moles 1 to 10 are the cancerous and 11 to 20 are the benign. 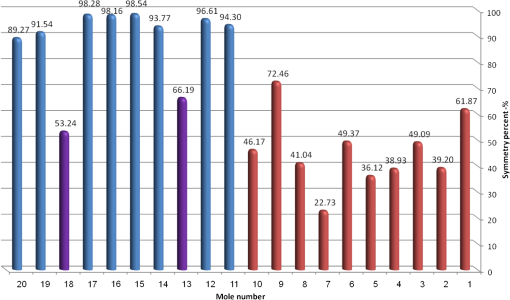 Fig. 10Results of the border irregularity measure. Moles 1 to 10 are the cancerous and 11 to 20 are the benign. 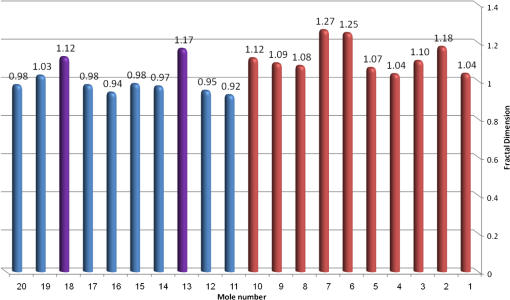 Fig. 11A 3-D classification space of the moles according to the three strongest mole features. Blue asterisks represent benign moles, green circles represent benign moles but with high dysplasia, and black triangles are malignant moles. 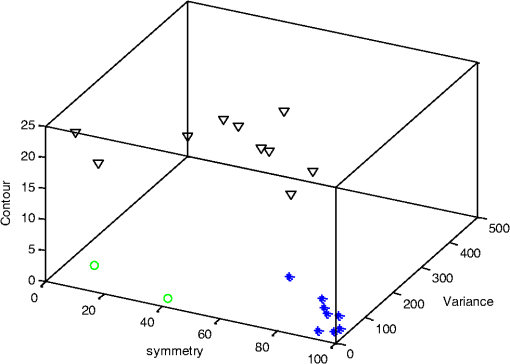 Figures 7 and 8 show the results of the across-frame local contrast and large-scale homogeneity measures. We can see that all the malignant moles have high variance and contours numbers, while the benign moles have low variance and contours numbers. Figures 9 and 10 show the results of the symmetry of compactness and border-irregularity measures. We can see that all the malignant moles have low symmetry of compactness and border irregularity, while the benign moles have high symmetry and border irregularity except for 13 and 18, which are benign moles with high dysplasia, becoming cancerous moles. Figure 11 presents 3-D classification space of the moles according to the three strongest mole features (local contrast across images, large-scale homogeneity, and asymmetry of the mole’s extracted area). It can be seen from the figure that the combination of these three mole features provides a separation between three different mole types: malignant (the black triangles), benign (the blue asterisks), and the benign moles but with high dysplasia (green circles). Note that the high dysplasia cases appear as a separate cluster in Fig. 11. However, it is only the difference in the symmetry of compactness measure (Fig. 9), where they are similar to the malignant cases that puts them at a different location with regard to the benign cases. 6.Summary and ConclusionsIn this study, we developed a method to automatically classify malignant and benign moles from images obtained with a newly developed skin imaging technique (called ORSI) that scans reflected polarization properties by continuously rotating a linearly polarized light incident on the suspected mole area. Our study examined these unique images in order to automatically distinguish malignant from benign moles. This is a pilot study, as only 10 subjects could be examined at this stage. For each subject, two ORSI image sequences in two different wavelengths (520 and 700 nm) were taken and used for the mole analysis and classification. We proposed four measures calculated on features extracted from the ORSI images to characterize the moles. These measures include local contrast across polarization-rotated images, large-scale homogeneity (measured by a count of hill-like shapes), asymmetry of the mole’s extracted area, and mole’s border disorder. The first two measures produced the highest differences between the malignant and benign moles. However, the last two measures yielded a significant difference between the completely benign moles and benign moles with high risk of becoming malignant, according to biopsy results. AcknowledgmentsWe are thankful to the following people who worked on the different forms of the skin-imaging tools developed in our group and the development of the liquid-crystal devices, which without their works we could not develop this methodology: Riki Moses, Ofir Aharon, Avner Safrani, and Shahar Mor. We would also like to thank the following MDs and Pathologists from the Soroka University Hospital for their cooperation in developing these tools: Professor Lior Rosenberg, Dr. Ofer Arnon, Dr. Victor Dyomin, and Dr. Eldad Silberstein. This work was partially supported by the Ministry of Science under the “Tashtiot” program. ReferencesA. Safraniet al.,
“Skin biomedical optical imaging system using dual wavelength polarimetric control with liquid crystals,”
J. Biomed. Opt., 15
(2), 026024
(2010). http://dx.doi.org/10.1117/1.3394338 JBOPFO 1083-3668 Google Scholar
O. Aharonet al.,
“Differential optical spectropolarimetric imaging system assisted by liquid crystal devices for skin imaging,”
J. Biomed. Opt., 16
(8), 086008
(2011). http://dx.doi.org/10.1117/1.3609003 JBOPFO 1083-3668 Google Scholar
R. M. Woodwardet al.,
“Terahertz pulse imaging in reflection geometry of human skin cancer and skin tissue,”
Phys. Med. Biol., 47
(21), 3853
–3863
(2002). Google Scholar
N. Aspreset al.,
“Imaging the skin,”
Australas. J. Dermatol., 44
(1), 19
–27
(2003). http://dx.doi.org/10.1046/j.1440-0960.2003.00632.x AJDEBP 0004-8380 Google Scholar
D. L. FarkasD. Becker,
“Application of spectral imaging: detection and analysis of the human melanoma and its precursors,”
Pigm. Cell Res., 14
(1), 2
–8
(2001). http://dx.doi.org/10.1034/j.1600-0749.2001.140102.x PCREEA 0893-5785 Google Scholar
P. Yang,
“Macroscopic spectral imaging and gene expression analysis of the early stages of melanoma,”
Mol. Med., 5
(12), 785
–794
(1999). MOMEE2 0268-2680 Google Scholar
B. Farinaet al.,
“Multispectral imaging approach in the diagnosis of cutaneous melanoma: property and limits,”
Phys. Med. Biol., 45
(5), 1243
–1254
(2000). http://dx.doi.org/10.1088/0031-9155/45/5/312 PHMBA7 0031-9155 Google Scholar
A. M. P. MontgomeryR. A. ReisfeldD. A. Cheresh,
“Integrin aVP3 rescues melanoma cells from apoptosis in three dimensional dermal collagen,”
Proc. Natl. Acad. Sci. U S.A., 91 8856
–8860
(1994). http://dx.doi.org/10.1073/pnas.91.19.8856 1091-6490 Google Scholar
“What you need to know about™ melanoma and other skin cancers,”
National Cancer Institute,
(2010). Google Scholar
S. L. JacquesJ. C. Ramella-RomanK. Lee,
“Imaging skin pathology with polarized light,”
J. Biomed. Opt., 7
(3), 329
–340
(2002). http://dx.doi.org/10.1117/1.1484498 JBOPFO 1083-3668 Google Scholar
I. AbdulhalimR. MosesR. Sharon,
“Biomedical optical applications of liquid crystal devices,”
Acta Phys. Pol. A, 112
(5), 715
–722
(2007). ATPLB6 0587-4246 Google Scholar
M. NeyI. Abdulhalim,
“Modeling of reflectometric and ellipsometric spectra from the skin in the TeraHertz and submillimeter waves region,”
J. Biomed. Opt., 16
(6), 067006
(2011). http://dx.doi.org/10.1117/1.3592779 JBOPFO 1083-3668 Google Scholar
J. C. Ramella-Romanet al.,
“Design, testing, and clinical studies of a handheld polarized light camera,”
J. Biomed. Opt., 9
(6), 1305
–1310
(2004). http://dx.doi.org/10.1117/1.1781667 JBOPFO 1083-3668 Google Scholar
N. Kolliaset al.,
“Fluorescence photography in the evaluation of hyper pigmentation in photo damaged skin,”
J. Am. Acad. Dermatol., 36
(2), 226
–230
(1997). http://dx.doi.org/10.1016/S0190-9622(97)70285-8 JAADDB 0190-9622 Google Scholar
M. Binderet al.,
“Epiluminescence microscopy. A useful tool for the diagnosis of pigmented skin lesions for formally trained dermatologists,”
Arch. Dermatol., 131
(3), 286
–291
(1995). http://dx.doi.org/10.1001/archderm.1995.01690150050011 ARDEAC 0003-987X Google Scholar
C. MassoneA. D. StefaniH. P. Soyer,
“Dermatoscopy for skin cancer detection,”
Curr. Opin. Oncol., 17
(2), 147
–153
(2005). http://dx.doi.org/10.1097/01.cco.0000152627.36243.26 CUOOE8 1040-8746 Google Scholar
A. J. Sober,
“Diagnosis and management of skin cancer,”
Cancer, 51
(S12), 2448
–2452
(1983). http://dx.doi.org/10.1002/(ISSN)1097-0142 60IXAH 0008-543X Google Scholar
H. PehambergeA. SteinerK. Wolff,
“In vivo epiluminescence microscopy of pigmented skin lesions. I. Pattern analysis of pigmented skin lesions,”
J. Am. Acad. Dermatol., 17
(4), 571
–583
(1987). http://dx.doi.org/10.1016/S0190-9622(87)70239-4 JAADDB 0190-9622 Google Scholar
G. Argenzianoet al.,
“Epiluminescence microscopy for the diagnosis of doubtful melanocytic skin lesions. Comparison of the ABCD rule of dermatoscopy and a new 7-point checklist based on pattern analysis,”
Arch. Dermatol., 134
(12), 1563
–1570
(1998). http://dx.doi.org/10.1001/archderm.134.12.1563 ARDEAC 0003-987X Google Scholar
J. M. Bueno,
“Confocal scanning laser ophthalmoscopy improvement by use of Mueller-matrix polarimetry,”
Opt. Lett., 27
(10), 830
–832
(2002). http://dx.doi.org/10.1364/OL.27.000830 OPLEDP 0146-9592 Google Scholar
K. S. NehalD. GareauM. Rajadhyaksha,
“Skin imaging with reflectance confocal microscopy,”
Semin. Cutan. Med. Surg., 27
(1), 37
–43
(2008). http://dx.doi.org/10.1016/j.sder.2008.01.006 SCMSFR 1085-5629 Google Scholar
J. E. Fulton,
“Utilizing the ultraviolet (UV detect) camera to enhance the appearance of photodamage and other skin conditions,”
Dermatol. Surg., 23
(3), 163
–169
(1997). http://dx.doi.org/10.1016/S1076-0512(97)00097-6 DESUFE 1076-0512 Google Scholar
A. Bonoet al.,
“The ABCD system of melanoma detection,”
Cancer, 85
(1), 72
–77
(1999). http://dx.doi.org/10.1002/(ISSN)1097-0142 60IXAH 0008-543X Google Scholar
G. Argenzianoet al.,
“Dermoscopy of pigmented skin lesions: results of a consensus meeting via the Internet,”
J. Am. Acad. Dermatol., 48
(5), 679
–693
(2003). http://dx.doi.org/10.1067/mjd.2003.281 JAADDB 0190-9622 Google Scholar
F. Nachbaret al.,
“The ABCD rule of dermatoscopy: high prospective value in the diagnosis of doubtful melanocytic skin lesions,”
J. Am. Acad. Dermatol., 30
(4), 551
–559
(1994). http://dx.doi.org/10.1016/S0190-9622(94)70061-3 JAADDB 0190-9622 Google Scholar
N. R. Abbasiet al.,
“Early diagnosis of cutaneous melanoma: revisiting the ABCD criteria,”
J. Am. Med. Assoc., 292
(22), 2771
–2776
(2004). http://dx.doi.org/10.1001/jama.292.22.2771 JAMAAP 0098-7484 Google Scholar
M. MastrolonardoE. ConteJ. P. Zbilut,
“A fractal analysis of skin pigmented lesions using the novel tool of the variogram technique,”
Chaos Soliton Fract., 28
(5), 1119
–1135
(2006). http://dx.doi.org/10.1016/j.chaos.2005.08.106 CSFOEH 0960-0779 Google Scholar
Y. ZhaoL. ZhangQ. Pan,
“Spectropolarimetric imaging for pathological analysis of skin,”
Appl. Opt., 48
(10), D236
–D246
(2009). http://dx.doi.org/10.1364/AO.48.00D236 APOPAI 0003-6935 Google Scholar
Y. ZhaoQ. PanH. C. Zhang,
“New polarization imaging method based on spatially adaptive wavelet image fusion,”
Opt. Eng., 45
(12), 123202
(2006). http://dx.doi.org/10.1117/1.2404917 OPEGAR 0091-3286 Google Scholar
R. R. Anderson,
“Polarized light examination and photography of the skin,”
Arch. Dermatol., 127
(7), 1000
–1005
(1991). http://dx.doi.org/10.1001/archderm.1991.01680060074007 ARDEAC 0003-987X Google Scholar
J. A. Mucciniet al.,
“Polarized light photography in the evaluation of photoaging,”
J. Am. Acad. Dermatol., 33
(5), 765
–769
(1995). http://dx.doi.org/10.1016/0190-9622(95)91813-2 JAADDB 0190-9622 Google Scholar
S. B. Phillipset al.,
“Polarized light photography enhances visualization of inflammatory lesions of acne vulgaris,”
J. Am. Acad. Dermatol., 37
(6), 948
–952
(1997). http://dx.doi.org/10.1016/S0190-9622(97)70070-7 JAADDB 0190-9622 Google Scholar
O. AharonI. Abdulhalim,
“Liquid crystal wavelength independent continuous polarization rotator,”
Opt. Eng., 49
(3), 034002
(2010). http://dx.doi.org/10.1117/1.3366545 OPEGAR 0091-3286 Google Scholar
O. AharonI. Abdulhalim,
“Liquid crystal tunable filter with extended free spectral range,”
Opt. Express, 17
(14), 11426
–11433
(2009). http://dx.doi.org/10.1364/OE.17.011426 OPEXFF 1094-4087 Google Scholar
O. AharonI. Abdulhalim,
“Birefringent tunable filter with wide dynamic range,”
Opt. Lett., 34
(14), 2114
–2116
(2009). http://dx.doi.org/10.1364/OL.34.002114 OPLEDP 0146-9592 Google Scholar
A. SafraniI. Abdulhalim,
“Liquid crystal polarization rotator and a tunable polarizer,”
Opt. Lett., 34
(12), 1801
–1803
(2009). http://dx.doi.org/10.1364/OL.34.001801 OPLEDP 0146-9592 Google Scholar
A. BuadesB. CollJ. M. Morel,
“On image denoising methods,”
SIAM Multiscale Model. Simul., 4
(2), 490
–530
(2005). http://dx.doi.org/10.1137/040616024 MMSUBT 1540-3459 Google Scholar
S. G. ChangB. YuM. Vetterli,
“Adaptive wavelet thresholding for image denoising and compression,”
IEEE Trans. Image Process., 9
(9), 1532
–1546
(1998). http://dx.doi.org/10.1109/83.862633 IIPRE4 1057-7149 Google Scholar
C. TomasiR. Manduchi,
“Bilateral filtering for gray and color images,”
in Proc. Sixth Int. Conf. on Computer Vision,
839
–846
(1998). Google Scholar
N. Otsu,
“A Threshold selection method from gray- level histograms,”
IEEE Trans. Syst. Man Cybernet., 9
(1), 62
–66
(1979). http://dx.doi.org/10.1109/TSMC.1979.4310076 ITSCFI 1083-4419 Google Scholar
R. M. Rangayyanet al.,
“Measures of acutance and shape for classification of breast tumors,”
IEEE Trans. Med. Imag., 16
(6), 799
–810
(1997). http://dx.doi.org/10.1109/42.650876 ITMID4 0278-0062 Google Scholar
H. O. PeitgeH. JürgenD. Saupe, Chaos and Fractals, New Frontiers of Science, 2nd ed.Springer-Verlag, New York
(2004). Google Scholar
|


