
|
|
1.IntroductionOptical testing is an issue of increasing interest in the field of biomedical engineering due to noncontact and noninvasive measuring of biomedical and, especially, biomechanical optical properties.1,2 This study concentrates on determining stress-strain data in combination with strain-dependent optical properties of human iliotibial tracts specimens by using a powerful halogen light bulb. Human iliotibial tract consist of areas with mostly parallel-aligned collagen fiber bundles.3 Due to the wide spectral range of the halogen light source, wavelength-specific information about the behavior of collagen structures can be gained during tensile tests rather than using a monochromatic light source like a laser. No such optical tests have been performed to the authors’ knowledge at this time. In the most of the former studies dealing with optical examinations, lasers4–7 and video systems7,8 were applied for determining changes of mechanical properties in biomechanics of human tissues and prosthetics. In contrast to these publications, the aim of this study lies in gaining spectrophotometric data about the mechanical behavior of a model tissue of the skeletal and locomotor system: the iliotibial tract. 2.Experimental2.1.Iliotibial Tract PreparationFive iliotibial tracts were gained from five body donors (three males and two females, mean age 41.8 years, standard deviation 22.5 years, range 24 to 80 years) during autopsy at the Institute of Forensic Medicine and at the Institute of Anatomy, University of Leipzig, Germany. The local ethics committee approved the study. The 70-mm long tracts were sectioned lengthwise into two or three specimens each (total of 13 specimens), according to our previous setup, and plastinated partially to prevent material slippage,9,10 while keeping the 20-mm long central part of the specimens to be tested in the fresh condition. Widths and thicknesses of the specimens varied between the body donors. After clamping the specimen for material testing, a minimum cross-section was created centrally by means of a template. This cross-section was calculated (Datinf® Measure, Datinf GmbH, Tübingen, Germany) after casting the specimens with vinylpolysiloxane (HS-A Silikon Light Body, Henry Schein Inc., Melville, New York). All the specimens were kept at moist conditions before testing. For histological examination, two stretched and two unstretched tract specimens were dehydrated in ascending ethanol series before embedding them with paraffin. Serial sections of 10 μm were stained with hematoxylin-eosin (HE),10,11 or left unstained to perform a polarized light microscopy.12 2.2.Experimental SetupThe experimental setup used in this study combines a custom-built system for spectrophotometry transmission measurements with an industrial norm material testing machine. A schematic view can be seen in Fig. 1. Fig. 1Experimental setup for spectrophotometry on human tissues combined with tensile testing. Numbers (1) to (6) are explained in the text.  The light source, a 100 W halogen light bulb, was coupled into a standard endoscope light cable (1) for guiding the radiation to the tissue by minimal transmission loss.13 The unfiltered radiation was then coupled out of the endoscope cable and free-space radiated onto the tissue’s surface (2), where the diameter of the spot was . The specimens (3) were mounted in a Z20.0 uniaxial testing machine (Zwick GmbH & Co. KG, Ulm, Germany) with both ends clamped between the two jaws each (4). After 20 cycles of preconditioning with a load of 10 to 100 N,9,14 each specimen was loaded with another five cycles, ranging between 20 and 100 N. A 2.5-kN force transducer was used with an accuracy of , according to DIN EN ISO 7500-1 (Ref. 15). Elongation rate was mm/min to ensure suitable acquisition of optical data, which was recorded at a frequency of 0.5 Hz. The transmitted radiation (5) was first collected by a custom-made 2:1 fiber combiner (Avantes, Apeldoorn, The Netherlands) (6) and afterward split into two spectrometers. Spectrometer 1, equipped with a 3048 px Si CCD, was sensitive from 400 to 1040 nm. Spectrometer 2, equipped with a 256 px InGaAs CCD, was sensitive from 1040 to 1700 nm. Both spectrometers were manufactured by Avantes, and worked on the basis of a Czerny-Turner grid monochromator. Average distance between light emission and detection was . All experiments were performed at room temperature. Light scattering was not considered for evaluating the results since the diameter of the light spot was , and thus out-of-range of scattering measurements. 3.Results and DiscussionStress-strain data and related optical properties of nine iliotibial tract specimens were recorded by means of the materials testing machine and the optical system. Depending on the initial cross-section area of each specimen, strain values ranged between 1.3% and 4.7% at the maximum cycle force of 100 N. Accordingly, stress values ranged between 5.8 and . The strain-dependent transmission behavior of one exemplary specimen can be seen in Fig. 2. Fig. 2Percentage of transmission of an iliotibial tract specimen during tensile testing. The red line shows the course of strain, and the blue dots are the transmission values (absolute %) recorded at a frequency of 0.5 Hz. The bars indicate the measuring inaccuracy. The two dotted green lines are a curve fitting of the local transmission maxima and minima.  When the specimen was strained (red line), transmission (blue circles) dropped immediately. Conversely, transmission increased when strain decreased. This may be caused by lateral contraction of the specimens. As confirmed by the histology samples, the collagen fibers approached to one another when straining the tissue samples. Hence, less light was transmitted at higher strains. In the HE-stained specimens, the aforementioned alteration was observed between the unstrained and the strained conditions (Fig. 3). Collagen fibers of the unstrained specimens had a wavy pattern, and were arranged loosely. Fig. 3(a) Hematoxylin-eosin (HE) staining of iliotibial tract specimens under unstrained (upper row) and strained conditions (lower row) at different magnifications. The unstrained tracts show a wavy pattern of the loosely arranged collagen fibers. The collagen within the strained tracts appears more parallel-aligned and compact. (b) Polarized light microscopy of the same specimens as in (a). Arrows indicate inhomogeneities of light transmission within the unstrained specimen. The collagen fibers within the strained tracts appear to be aligned closer and less translucent but homogeneous. artifacts. 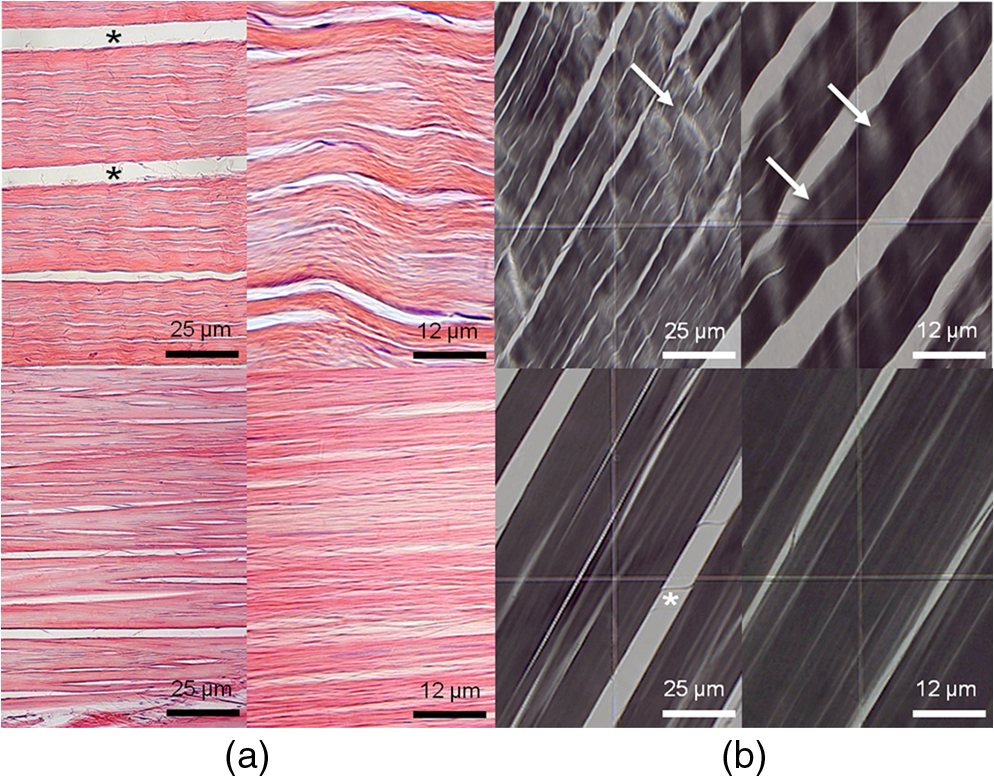 In contrast, the collagen fibers in the strained condition were more compact, and were aligned in a straight instead of a wavy manner. The strained fibers were less translucent as compared with the unstrained fibers. These findings were confirmed by polarized light microscopy (Fig. 3). Here, inhomogeneities of polarized light transmission were observed for the unstrained specimens due to their wavy appearance. Light transmission of the strained specimens was more homogeneous, and the specimens appeared to be less translucent due to the closely aligned collagen fiber bundles. During the five cycles, the following trend could be determined in all nine cases: for recurring strain values, higher transmission values were recorded from cycle to cycle. Descriptive analyses showed that an exponential function best describes the observed behavior (Fig. 2). Since the partial plastination technique was used, material slippage can be excluded as a reason for cyclic transmission increase.9,10 Since the strain behavior remains steady over all the five cycles, no creep deformations could be observed during the testing process. Hence, the viscoelastic behavior might not be crucial for the exponential change of the transmission values. Another explanation for the cyclic transmission increase might be the decreased water content of the specimens. In detail, spectral analyses showed characteristic changes in light absorption behavior of the specimens in the experimental progress. Especially at wavelengths between 1400 and 1500 nm transmission values increased, since water has its most influencing absorption band at 1450 nm concerning the whole investigated wavelength range from 400 to 1700 nm.16 Before testing, all specimens were kept in isotonic sodium chloride. After tensile testing, the specimens exhibited an extraordinarily dry surface in the area where the powerful halogen light source was radiating the tissue. The mean duration of testing was 93 s (standard deviation 23 s). Since the halogen light bulb used in our setup is a thermal radiator having its highest intensities in the near infrared range, its radiation strongly caused dehydration in addition to the evaporation-induced dehydration at room temperature (standard temperature and pressure). Comparison of the single transmission data among the tract specimens revealed a high variation for the transmission degree (Table 1). Potential error sources are the minimally varying distances between light source and detector, as well as the thicknesses of the specimens. In addition to that, the collagen fibers are not homogenously aligned across the overall specimen area, so the absolute transmission values may depend on the observed position on the tissue. However, a clear tendency in transmission behavior during the five-cycle tensile test, as described previously, was observed for all the specimens. Four specimens cannot be quantitatively discussed due to inconclusively delineated maxima and minima caused by directly irradiating the detector when lateral contracting occurred (undersized specimens). Nevertheless, these four specimens showed the same cyclic transmission behavior as described previously. Table 1Transmission values (minimum/maximum) of the five specimens during the five-cycle tensile test. Extended data of specimen no. 1 is plotted in Fig. 1.
Averaged over all the five specimens and all the five cycles, mean variation of transmission values (maxima–minima) per cycle is 1.23 transmission-% with a standard deviation of 0.47 transmission-%. 4.ConclusionTransmission data during a five-cycle tensile test were successfully recorded for five specimens gained from human iliotibial tract. In all nine cases, an inversely proportional transmission behavior concerning tensile force progress as well as drying phenomena could be determined; cyclic transmission alterations of the five specimens could be described quantitatively. Optical testing reveals much more sensitive data regarding dehydration than the stress-strain data of the tensile test device. Certainly, optical data can only be gained in a defined area, depending on the size of the light spot on the tissue’s surface, while stress-strain data are recorded representing the whole specimen. Within the study, the sensitive detection of the lateral contraction behavior of iliotibial tract specimens, and in this way a direct correlation between force progressing and transmission data, could be confirmed. In this regard, it is conceivable not just to describe a qualitative, but also a quantitative correlation between transmission degree and lateral contraction in further studies. Mathematic coherences referring to specimen thickness, specimen straining, and transmission data could not be determined within this study due to high-quality criteria and a nonapplicable designed experimental setup; furthermore a larger number of specimens is recommended. Prospectively, experiments acquiring strain-dependent reflection data and different anatomical regions of connective tissues containing collagen would be of further interest for developing noninvasive or noncontact measuring systems. In further tensile testing, dehydration should be minimized by using a less intense or different light source and moistening the specimens during testing. Thus, being more sensitive to drying phenomena, spectrophotometry may likely serve as a quality control, complementing existing methods to determine stress-strain data. AcknowledgmentsWe would like to thank Christine Auste for taking the photos and Dr. Carsten Hädrich for providing the specimens. ReferencesH. ArimotoM. Egawa,
“Non-contact skin moisture measurement based on near-infrared spectroscopy,”
Appl. Spectrosc., 58
(12), 1439
–1446
(2004). http://dx.doi.org/10.1366/0003702042641218 APSPA4 0003-7028 Google Scholar
J. SwartlingJ. S. DamS. Andersson-Engels,
“Comparison of spatially and temporally resolved diffuse-reflectance measurement systems for determination of biomedical optical properties,”
Appl. Opt., 42
(22), 4612
–4620
(2003). http://dx.doi.org/10.1364/AO.42.004612 APOPAI 0003-6935 Google Scholar
K. Birnbaumet al.,
“Anatomical and biomechanical investigations of the iliotibial tract,”
Surg. Radiol. Anat., 26
(6), 433
–446
(2004). http://dx.doi.org/10.1007/s00276-004-0265-8 0930-1038 Google Scholar
P. Heerde,
“Employment of the speckle interferometry for the evaluation of the tension and deformation behavior for the material-dependent shape optimization of prosthetic constructions,”
Charité—University Medicine Berlin (GER),
(2009). Google Scholar
G. Coxet al.,
“3-Dimensional imaging of collagen using second harmonic generation,”
J. Struct. Biol., 141
(1), 53
–62
(2003). http://dx.doi.org/10.1016/S1047-8477(02)00576-2 JSBIEM 1047-8477 Google Scholar
M. S. PattersonB. ChanceB. C. Wilson,
“Time resolved reflectance and transmittance for the noninvasive measurement of tissue optical properties,”
Appl. Opt., 28
(12), 2331
–2336
(1989). http://dx.doi.org/10.1364/AO.28.002331 APOPAI 0003-6935 Google Scholar
L. Dong-Xuet al.,
“Modulus of elasticity of human periodontal ligament by optical measurement and numerical simulation,”
Angle Orthod., 81
(2), 229
–236
(2011). http://dx.doi.org/10.2319/060710-311.1 0003-3219 Google Scholar
J. Z. Wuet al.,
“Comparison of mechanical properties of rat tibialis anterior tendon evaluated using two different approaches,”
Biomed. Mater. Eng., 14
(1), 13
–22
(2004). BMENEO 0959-2989 Google Scholar
H. Steinkeet al.,
“Deformation behavior of the iliotibial tract under different states of fixation,”
Med. Eng. Phys., 34
(9), 1221
–1227
(2012). http://dx.doi.org/10.1016/j.medengphy.2011.12.009 MEPHEO 1350-4533 Google Scholar
N. Hammeret al.,
“Ultimate stress and age-dependent deformation characteristics of the iliotibial tract,”
J. Mech. Behav. Biomed., 16
(1), 81
–86
(2012). http://dx.doi.org/10.1016/j.jmbbm.2012.04.025 1751-6161 Google Scholar
M. A. Hayat, Stains and Cytochemical Methods (Perspectives on Individual Differences), Plenum Press, New York, NY
(1993). Google Scholar
F. KellerG. Leutert,
“Age dependence of collagen structures of the human heart,”
Z. Gerontol., 27
(3), 186
–193
(1994). ZGERAG 0044-281X Google Scholar
M. Ernstbergeret al.,
“Spectrophotometric measurements of human tissues for the detection of subjacent blood vessels in an endonasal endoscopic surgical approach,”
J. Biophoton., 6
(4), 310
–313
(2013). http://dx.doi.org/10.1002/jbio.201200072 JBOIBX 1864-063X Google Scholar
K. P. QuinnB. A. Winkelstein,
“Preconditioning is correlated with altered collagen fiber alignment in ligament,”
J. Biomech. Eng., 133
(6), 064506
(2011). http://dx.doi.org/10.1115/1.4004205 JBENDY 0148-0731 Google Scholar
Metallic materials—verification of static uniaxial testing machines—Part 1: Tension/compression testing machines—verification and calibration of the force-measuring system (ISO/DIS 7500-1:2004); German version prEN ISO 7500-1:2004, DIN Deutsches Institut für Normung e.V, Beuth Verlag GmbH, Berlin
(2004). Google Scholar
J. A. CurcioC. C. Petty,
“The near infrared absorption spectrum of liquid water,”
J. Opt. Soc. Am., 41
(5), 302
(1951). http://dx.doi.org/10.1364/JOSA.41.000302 JOSAAH 0030-3941 Google Scholar
|
|||||||||||||||||||||||||||||||||||||||||


