|
|
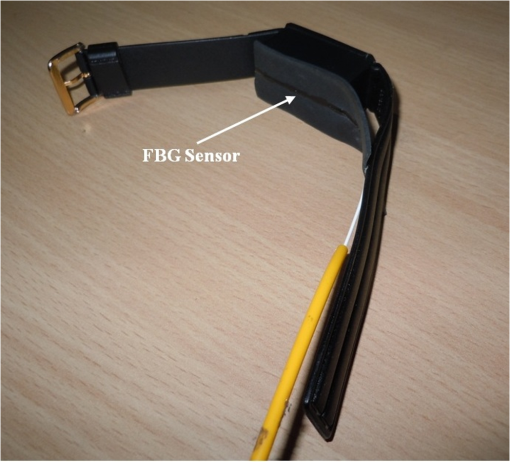
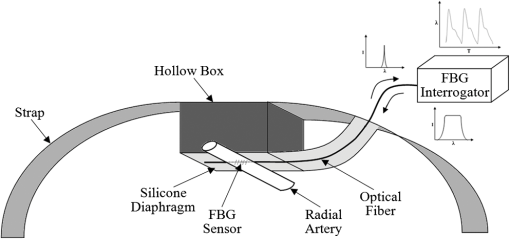
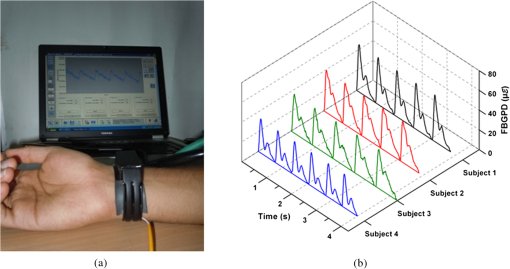
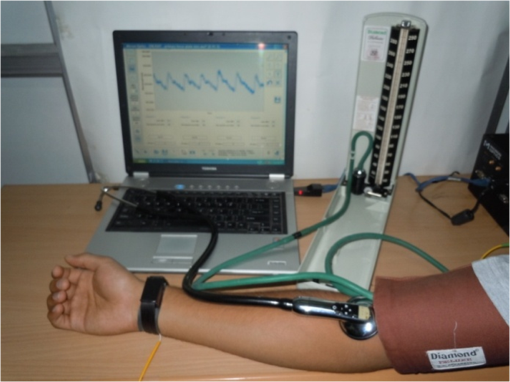
1.IntroductionHypertension is known to adversely affect the cardiovascular and renal systems.1 Hence, it is important to precisely measure the blood pressure to aid the diagnosis and management of hypertension. Direct intra-arterial measurement of blood pressure, though being the gold standard method,2 has limited clinical usage due to its invasive nature.3 Physicians commonly palpate the peripheral arterial pulse to study the cardiovascular status of subjects, and have relied on it to measure the blood pressure in conjunction with the Riva-Rocci cuff.4 The detection of Korotkoff sounds during deflation of the Riva-Rocci cuff by auscultatory method has been the mainstay for clinical measurement of blood pressure.2 Further, oscillometric devices have been developed for the automated blood pressure measurement, which are limited by accuracy of the algorithms used, stiffness of the arteries, differences between various makes of devices, and assumption of a regular pulse rate between bladder deflation bleed steps.5 Also, other methods such as tonometry, finger-cuff method of Penaz,6 and ultrasound techniques have been developed, which have their own drawbacks.5 In sphygmomanometry,3 when the cuff wound on the upper arm is inflated above the systolic blood pressure (SBP), the brachial artery is occluded resulting in complete cessation of blood flow. On gradual deflation, there is an initial turbulent blood flow which transforms into a normal laminar flow as the pressure of blood in the brachial artery overcomes the decreasing cuff pressure. The pressure at which the laminar flow is reestablished represents the diastolic blood pressure (DBP). Using the same principle, a fiber Bragg grating pulse device (FBGPD) has been designed and developed in the present work, for detecting the arterial pulse; the aim of this work, is to study the corresponding changes in the arterial pulse waveform from the radial artery and to provide a noninvasive assessment of blood pressure. The devices which measure blood pressure noninvasively at the wrist, such as the Colin radial tonometer,7 the Vasotrac monitor,7 the arterial pulsimeter equipped with Hall device,8 etc., apply the principle of tonometry9 to measure blood pressure with a single pulse, providing beat-to-beat estimation of blood pressure. The FBGPD developed differs from these devices by focusing on the volumetric flow response and radial arterial diametrical variation for the evaluation of SBP and DBP during sphygmomanometry. The use of fiber Bragg grating (FBG) sensors brings potential advantages, such as insensitivity to electromagnetic interference, low fatigue, and ultra-fast response, making the proposed FBGPD an effective means for the evaluation of the blood pressure. 2.Fiber Bragg Grating SensorsFBG is a periodic modulation of the refractive index of the core of a single-mode photosensitive optical fiber, along its axis,10 established by exposing the core to an intensity-modulated UV light. When a broadband light is launched into an FBG, a single wavelength which satisfies the Bragg’s condition will be reflected back, and the remaining part of the spectrum is transmitted.11 This reflected Bragg wavelength () of the FBG is given by Here, is the pitch of the grating and is the effective refractive index of the fiber core. FBG can be fabricated using a variety of ways; in the present work, FBGs of 3-mm lengths have been fabricated in photo-sensitive germania-doped silica fiber using the phase mask method.12 The sensing action of the FBG is based on the principle that any external perturbation, such as strain, temperature, etc., will alter the pitch of the grating and in turn the reflected Bragg wavelength. By interrogating the shift in Bragg wavelength, the external perturbation at the grating site can be quantified.13–15 For example, the strain effect on an FBG sensor is expressed as where and are components of the strain-optic tensor, is the Poisson’s ratio, and is the axial strain change.16 The strain sensitivity of a FBG inscribed in a germania-doped silica fiber is approximately .17 As the temperature variations can also cause a shift in the Bragg wavelength, it is important to compensate for temperature variations (if any) while using the FBG sensor for strain measurements.18 However, in the present work, temperature effect on the FBG sensor has been ignored, as the temperature change during the experimental course was negligibly small.3.Arterial Pulse Waveform DetectionThe FBGPD consists of a hollow, open-bottomed rectangular box with a dimension of , made of a plastic material attached to a strap. An elastic silicone diaphragm of dimension is adhered to the open side of the box. The FBG sensor of gauge length 3 mm is bonded to the outer surface of the silicone diaphragm, ensuring that the FBG sensor is positioned at the center of the bottom surface of the rectangular box as shown in Fig. 1. The silicone diaphragm facade of the FBGPD is placed on the flexor aspect of the wrist, corresponding to the site of maximal impulse of the radial arterial pulse as illustrated schematically in Fig. 2. The broadband light being launched into the fiber and the reflected wavelength interrogated for the arterial pulse pressure acquisition are depicted. The FBGPD fixed on the wrist recording the arterial pulse waveform is shown in Fig. 3(a). The FBGPD can be fixed on the wrist using a strap, which also exerts minimal inward pressure on the rectangular box. During the measurement, the FBG sensor site on the FBGPD is positioned on the skin surface exactly above the radial artery which is approximately 2 mm in diameter. The pulsatile flow of blood in the radial artery applies pressure on the silicone diaphragm, creating strain variations on it, which is sensed by the FBG sensor to provide the fundamental quantitative information of arterial pulse waveform of the subjects, as shown in the Fig. 3(b). The pulsatile nature of blood flow in the artery generates the beat-to-beat amplitude variation. A sustained push on the diaphragm due to the arterial diametric distension is also recorded in the response curve of the FBGPD. The present study involved 30 volunteers (19 males and 11 females) aged between 20 and 35 years, who are nonsmokers, nonalcoholics, and nonhypertensives. Two trials have been carried out on each subject. Prior to the onset of the test, the subjects are made to sit comfortably on a chair with a back rest, and are allowed to acclimatize to the surroundings for 15 min. While seated, the subject’s legs are not crossed, and the feet are placed on the ground. A Riva-Rocci cuff is wound on the right arm, two finger breadths above the ante-cubital fossa at the elbow, with the cuff applied directly on the skin. The forearm of the subject is rested on a table on which a mercury sphygmomanometer is placed such that their height corresponded to the level of the heart,19 as shown in Fig. 4. 4.Experimental MethodThe estimate of the SBP is made by the palpatory method of blood pressure measurement to avoid an auscultatory gap.20 The FBGPD is subsequently placed on the flexor aspect of the wrist as described earlier, which records the changes in reflected Bragg wavelength of the FBG sensor using an FBG interrogator (Micron Optics, SM130, Atlanta, GA). The diaphragm of the electronic stethoscope (3M Littmann brand model 3200), which transmits the acoustic signals to a computer, has been placed at the ante-cubital fossa over the brachial artery. Both the FBG sensor and electronic stethoscope are triggered simultaneously to ensure comparability of the acquired data. The pressure in the cuff, indicated by the sphygmomanometer, is then raised to 30 mm of mercury higher than the value of SBP as estimated by the palpatory method. The cuff pressure is then decreased at an approximate rate of 1 mm of mercury per second. Following the conventional ascultatory technique, the level of pressure in the cuff when the first Kortokoff sound is heard through the stethoscope is taken to represent SBP. The level of pressure when Korotkoff sounds disappeared completely marks the DBP.21 The data obtained from both techniques have been compared. 5.Results and DiscussionData obtained from a typical male subject of age 24 years is used to validate the blood pressure measurement using the present FBGPD. Analysis of the response of the FBGPD shows the pressure exerted by the radial artery over the silicone diaphragm. Figure 5 shows the response of both FBGPD (in ) and acoustic signals (in arbitrary units) recorded from the electronic stethoscope compared in real time during sphygmomanometric test. The test has been carried out for about 116 s, and the FBGPD response has been classified into five phases:
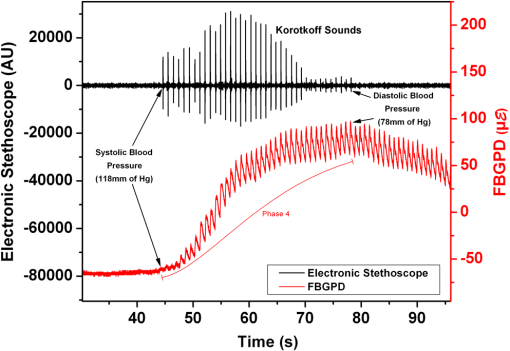
Fig. 5Comparison of response of FBGPD and electronic stethoscope acoustic signals during sphygmomanometry. 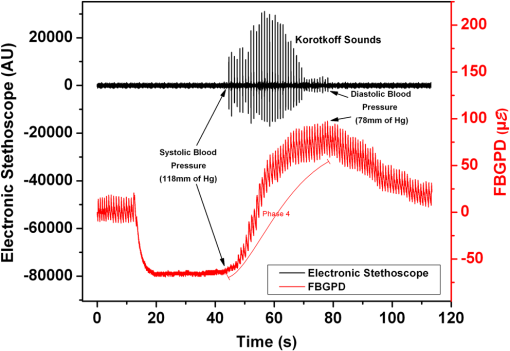 The unique signatures of pulse detection and peak point of the FBG pulse response with corresponding pressure values from the sphygmomanometer represent the SBP and DBP of the subject. This method of blood pressure evaluation has been tested for accuracy with 30 test subjects, and the accuracy of the measured values has been calculated. The time delay between the unique signatures of FBGPD-sensed waveform and occurrence and disappearance of Korotkoff sounds detected by the electronic stethoscope is used to generate the accuracy of the two techniques. The number of trials of both SBP and DBP is divided into brackets of time delay, which indicates the blood pressure difference recorded by both the techniques knowing the pressure deflation rate of 1 mm of mercury per second. Table 1 shows the statistical distribution of the acquired trials with the difference in timing for SBP and DBP obtained from FBGPD and electronic stethoscope signals, which correspond to the differences in the blood pressure values. It is observed that for SBP, for of mercury pressure difference measured by both methods, an accuracy of 99.99% () is achieved. Similarly for DBP, for of mercury pressure difference measured by both the methods, an accuracy of 79.99% () is achieved. The variation in the results obtained by both methods can be attributed to the positional offset of the FBGPD above the radial artery or to an additional pressure application on the radial artery by the FBGPD, which may limit the expansion of the radial artery. Further, the present FBGPD can also provide information regarding hemodynamic changes in the radial artery in the form of volumetric flow response and arterial diametrical change simultaneously, which makes this technique very unique and effective for blood pressure evaluation. Table 1Statistics of the acquired trials for accuracy calculation.
6.ConclusionIn the present work, a blood pressure evaluation method has been demonstrated which uses FBGPD for recording the radial arterial pulse waveform in real time during sphygmomanometry. The results obtained are compared with the data recorded from the electronic stethoscope, and have been found to be in good agreement. In addition, the FBGPD provides information about the arterial diametrical variations. The noticeable constraints of this technique are the difficulty in placement of the device and precise pressure application by the FBGPD over the radial artery. Further, this study can be extended to observe the arterial pulse waveform in hypertensive subjects with significant atherosclerosis and also in hypotensive subjects. ReferencesW. C. Cushman,
“The burden of uncontrolled hypertension: morbidity and mortality associated with disease progression,”
J. Clin. Hypertens., 5
(3), 14
–22
(2003). http://dx.doi.org/10.1111/jch.2003.5.issue-3 JCHYEM 0748-450X Google Scholar
M. WardJ. A. Langton,
“Blood pressure measurement,”
Contin. Educ. Anaesth. Crit. Care Pain., 7
(4), 122
–126
(2007). Google Scholar
D. Perloffet al.,
“Human blood pressure determination by sphygmomanometry,”
Circulation, 88
(5 Pt 1), 2460
–2470
(1993). http://dx.doi.org/10.1161/01.CIR.88.5.2460 CIRCAZ 0009-7322 Google Scholar
D. SahuM. Bhaskaran,
“Palpatory method of measuring diastolic blood pressure,”
J. Anaesth. Clin. Pharmacol., 26
(4), 528
–530
(2010). Google Scholar
T. G. Pickeringet al.,
“Blood pressure measurement in humans,”
Hypertension, 45
(1), 142
–161
(2005). http://dx.doi.org/10.1161/01.HYP.0000150859.47929.8e HPRTDN 0194-911X Google Scholar
J. Penaz,
“Photoelectric measurement of blood pressure, volume and flow in the finger,”
in Digest 10th Int. Conf. Med. Bio. Eng.,
104
(1973). Google Scholar
B. H. Friedmanet al.,
“Self-reported sensitivity to continuous noninvasive blood pressure monitoring via the radial artery,”
J. Psych. Res., 57
(2), 119
–121
(2004). http://dx.doi.org/10.1016/S0022-3999(03)00597-X JPYRA3 0022-3956 Google Scholar
S. S. Leeet al.,
“Measurement of blood pressure using an arterial pulsimeter equipped with a hall device,”
Sensors, 11
(2), 1784
–1793
(2011). http://dx.doi.org/10.3390/s110201784 SNSRES 0746-9462 Google Scholar
E. G. Kimet al.,
“Development of an arterial tonometer sensor,”
in Engineering in Medicine and Biology Society, 2009, EMBC 2009, Annual International Conference of the IEEE,
3771
–3774
(2009). Google Scholar
W. W. MoreyG. MeltzW. H. Glenn,
“Fiber Bragg grating sensors,”
Proc. SPIE, 1169 98
–107
(1989). http://dx.doi.org/10.1117/12.963022 PSISDG 0277-786X Google Scholar
A. Othonos,
“Fiber Bragg gratings,”
Rev. Sci. Instrum., 68
(12), 4309
–4341
(1997). http://dx.doi.org/10.1063/1.1148392 RSINAK 0034-6748 Google Scholar
K. O. Hillet al.,
“Bragg gratings fabricated in monomode photosensitive optical fiber by UV exposure thorough a phase-mask,”
Appl. Phys. Lett., 62
(10), 1035
–1037
(1993). http://dx.doi.org/10.1063/1.108786 APPLAB 0003-6951 Google Scholar
A. D. Kerseyet al.,
“Fiber grating sensors,”
J. Lightwave Technol., 15
(8), 1442
–1462
(1997). http://dx.doi.org/10.1109/50.618377 JLTEDG 0733-8724 Google Scholar
A. OthonosK. Kalli, Fiber Bragg Gratings Fundamentals and Applications in Telecommunications and Sensing, Artech House, Boston
(1999). Google Scholar
R. Kashyap, Fiber Bragg Gratings, Academic Press, San Diego
(1999). Google Scholar
B. A. TahirJ. AliR. A. Rahman,
“Fabrication of fiber grating by phase mask and its sensing application,”
J. Optoelectron. Adv. Mater., 8
(4), 1604
–1609
(2006). 1454-4164 Google Scholar
S. M. Melleet al.,
“A Bragg grating-tuned fibre laser strain sensor system,”
IEEE Photonics Technol. Lett., 5
(2), 263
–266
(1993). http://dx.doi.org/10.1109/68.196025 IPTLEL 1041-1135 Google Scholar
R. Aashiaet al.,
“Strain-temperature discrimination using a single fiber Bragg grating,”
IEEE Photonics Technol. Lett., 22
(11), 778
–780
(2010). http://dx.doi.org/10.1109/LPT.2010.2044657 IPTLEL 1041-1135 Google Scholar
J. C. Petrieet al.,
“Recommendations on blood pressure measurement,”
Br. Med. J., 293
(6547), 611
–615
(1986). http://dx.doi.org/10.1136/bmj.293.6547.611 BMJOAE 0007-1447 Google Scholar
J. M. Askey,
“The auscultatory gap in sphygmomanometry,”
Ann. Intern. Med., 80
(1), 94
–97
(1974). http://dx.doi.org/10.7326/0003-4819-80-1-94 AIMEAS 0003-4819 Google Scholar
H. IrisawaH. GokiM. Yukutake,
“Cause of the disappearance of the auscultatory sound in indirect blood pressure measurements,”
Am. Heart J., 64
(3), 308
–313
(1962). http://dx.doi.org/10.1016/0002-8703(62)90144-8 AHJOA2 0002-8703 Google Scholar
|

