|
|
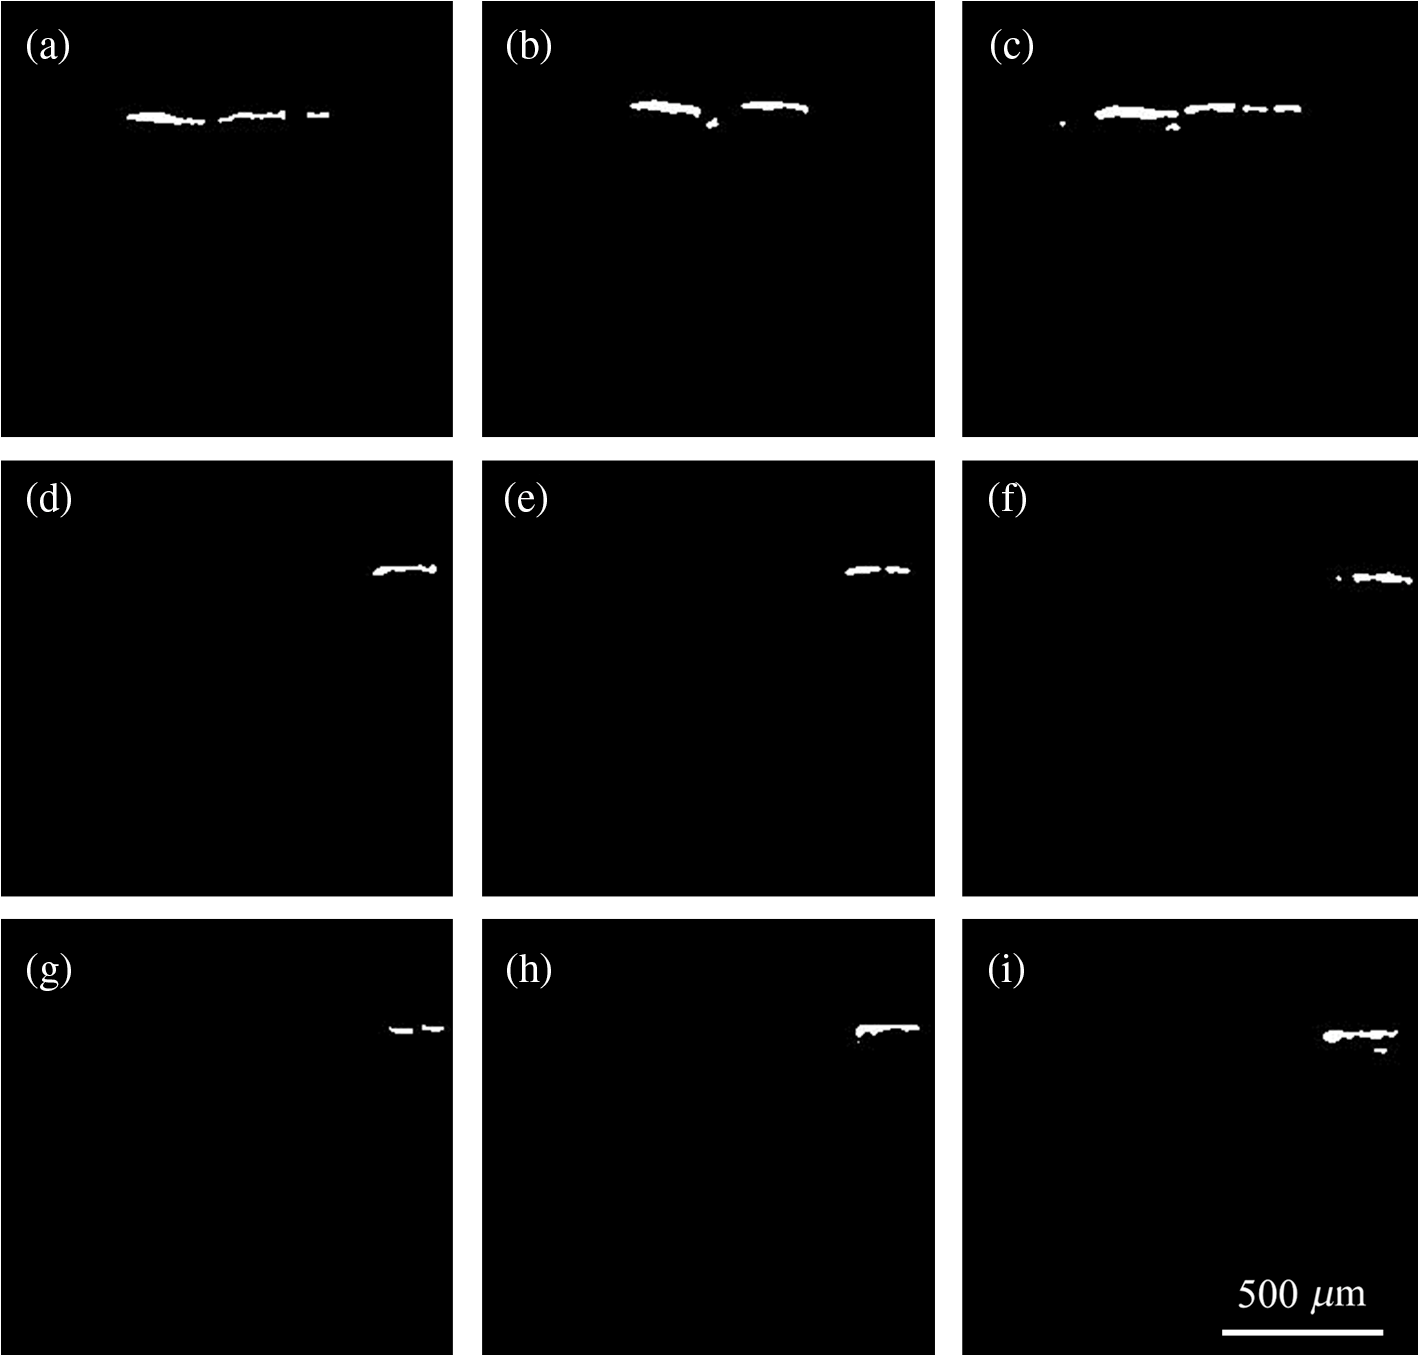
1.IntroductionFocused ultrasound (FUS) enhanced with microbubbles could be a potential tool for affecting endothelium for permeability enhancement of vessels,1,2 treatment of thrombolysis,3,4 or transient blood-brain barrier (BBB) opening.5,6 Previous studies have demonstrated that FUS can enhance enzymatic thrombolysis by increasing the transport of thrombolytic agents into clots.7 The FUS combined with microbubbles can enhance thrombolysis even without the presence of thrombolytic agents. In addition, BBB disruption using FUS in the presence of microbubbles can increase localized chemotherapeutic drug delivery for brain tumor treatment.8 Also, when the acoustic wave encounters microbubbles, the local tissue motion contributed from microbubble oscillation may be enhanced,9,10 which enhances the mechanical effect. Yet, the local motion/vibration caused by FUS exposure is difficult to observe and is poorly understood, owing to high spatial and temporal requirements. Also, the effect of FUS exposure can be influenced by acoustic parameters, such as acoustic pressure, exposure duration, or exposure mode (continuous or pulsed waves). Therefore, an imaging technique with a high resolution is required to monitor and evaluate the effects of FUS treatment. Fluorescein angiography (FA) is a common approach for the examination of circulation in biological tissues by using a specific fluorescence dye and a CCD camera.11–13 Angiography can be performed by the injection of fluorescence dye into the vessels. Fluorescence is one type of photoluminescence that occurs when fluorophores absorb photon energy and are excited to a higher energy state. As the molecules return to their original energy level, they emit light at a different, usually longer, wavelength. FA is currently considered a standard approach in ophthalmology and a powerful imaging modality to identify the presence, location, and size of the vascular complex, composed of the choroidal vascular lesion and its associated components.14–16 Additionally, optical coherence tomography (OCT) has also been widely used for biomedical and industrial applications because of its advantages of noninvasiveness, depth-resolved imaging, and high-speed scanning.17,18 Aside from these advantages, functional variations such as polarization-sensitive OCT for the measurement of tissue birefringence;19,20 phase-resolved OCT for the measurement of blood velocity;21,22 and spectroscopic OCT for the measurement of tissue content of, for example, the oxygen-hemoglobin complex are feasible.23 In the last decade, with the development of swept sources and line-scan CCDs, Fourier-domain OCT, including swept-source OCT (SS-OCT)24,25 and spectral-domain OCT,26,27 can provide superior system performances over time-domain OCT, and the imaging speed and system sensitivity can be greatly improved to hundreds of kilohertz and more than 100 dB, respectively. Furthermore, OCT systems can provide resolutions as high as a few micrometers in the longitudinal and transverse directions and reconstruct the tissue structure from the backscattered signal of the sample. Given that OCT is based on the backscattered property of the sample, an extraneous contrast agent is not required. Currently, OCT is commonly used in clinical trials and studies on ophthalmology,28,29 dermatology,30,31 and cardiac diseases.32,33 Because FUS-induced morphological changes on biological tissues and vessels as well as the relationship between morphological change and permeability are poorly understood, we propose to use FA and OCT techniques for monitoring the outcome and investigating the effects of FUS-induced local permeability change. In this study, an FA system was implemented for the investigation of permeability enhancement caused by microbubble-facilitated FUS exposure. Additionally, an SS-OCT system was used to evaluate the morphological changes after FUS exposure. In Sec. 2, the schematic setups and operation specifications of FUS, FA, and OCT are described. The methods for animal preparation and experiments are also discussed. In Sec. 3, the results obtained from using the FA and OCT systems are presented, discussed, and analyzed. To quantitatively evaluate the morphological changes, a new algorithm to determine vessel structures from OCT images and to estimate the vessel area is proposed. Finally, conclusions are drawn in Sec. 4. 2.System Setup and Experimental MethodFigure 1 shows the platform for FUS treatment, the setup of the FA system, and the setup of the OCT system. In this study, the blood vessels in mouse ears were imaged using the FA and OCT systems sequentially. In Fig. 1(a), a high-intensity FUS transducer (Imasonics, Besancon, France; diameter: 60 mm, radius of curvature: 80 mm, frequency: 400 kHz, electric-to-acoustic efficiency: 70%) was driven by a function generator (33220A, Agilent, Santa Clara, CA) to generate the acoustic wave. Before feeding the driving signal into the FUS transducer, the FUS excitation signal was amplified by a radiofrequency power amplifier (150A100B, Amplifier Research, Souderton PA) and monitored by a power meter (Model 4421, Bird, Atlanta). Then, the acoustic wave was transmitted through a homemade water tank and focused on the mouse ear, which was mounted on a transparent plastic plate. The focal zone distribution of the intensity of the ultrasound field was measured in an acrylic water tank filled with deionized and degassed water. The measured diameter of the half-maximum pressure amplitude was 2 mm, and the length of the produced focal zone was 15 mm. As shown in Fig. 1(b), a halogen lamp (Lumen 200, Prior Scientific, Rockland, MA) was used as the excitation source in our FA system, and the output light was transmitted to an excitation filter to reserve the 488-nm light. In this study, fluorescein isothiocyanate (FITC) was used as the fluorescence dye to visualize the vessels. Therefore, a dichroic mirror was used to combine the 488- and 515-nm light. Then, the 488-nm light was focused on the mouse ear using a objective lens (UPLFLN , Olympus, Tokyo, Japan) and a 515-nm light was generated. Finally, a two-dimensional (2-D) CCD (Evolution VF, MediaCybernetics, Silver Spring, Maryland) was employed after an emission filter to capture the fluorescence images. A swept source (HSL-2000, Santec, Komaki, Aichi, Japan) was connected to a Mach-Zehnder interferometer as shown in Fig. 1(c), which can provide an A-scan rate of 30 kHz and output power of 6 mW. The center wavelength of the swept source is approximately 1310 nm, with a scanning range of 110 nm. In the sample arm, a two-axis galvanometer was used to provide the transverse and lateral scanning. Ten percent of the output power from the swept source was connected to a narrowband fiber Bragg grating (FBG) with a Bragg wavelength of 1270 nm, generating the trigger signal for each interference spectrum.34 The reflected signal from the FBG combined with the interference signal using a coupler and only 90% of the output power port was utilized. To effectively eliminate the DC component of the interfered spectrum, the other output port of a coupler was also connected to a coupler. The combined signal was subsequently detected by using a balanced detector (PDB150C, Thorlabs, Newton, NJ). The data were acquired by utilizing a high-speed digitizer (PXIe-5122, National Instruments, Austin, TX) with a sampling rate of 50 MHz. In our OCT system, the longitudinal and transverse resolutions are approximately 8 and 15 μm, respectively, and the frame rate can achieve 30 frames/s, each consisting of 1000 A-scans. In addition, a three-dimensional image composed of , which corresponds to a physical image size of , was acquired in 10 s. In our experiments, the mouse ear was mounted on the plastic plate, and the acoustic wave was focused on the ear from the bottom side of the ear, as shown in Fig. 1. Additionally, the optical beams of the FA and OCT systems were focused on the top side of the ear sequentially. Fig. 1(a) Setup of the FA system, (b) the platform for FUS treatment, and (c) setup of the OCT system. DM, dichroic mirror; OL, objective lens; PC, optical polarization controller; CIR, optical circulator; FBG, fiber Bragg grating; FC, fiber coupler; Galva, galvanometer; and M, mirror. 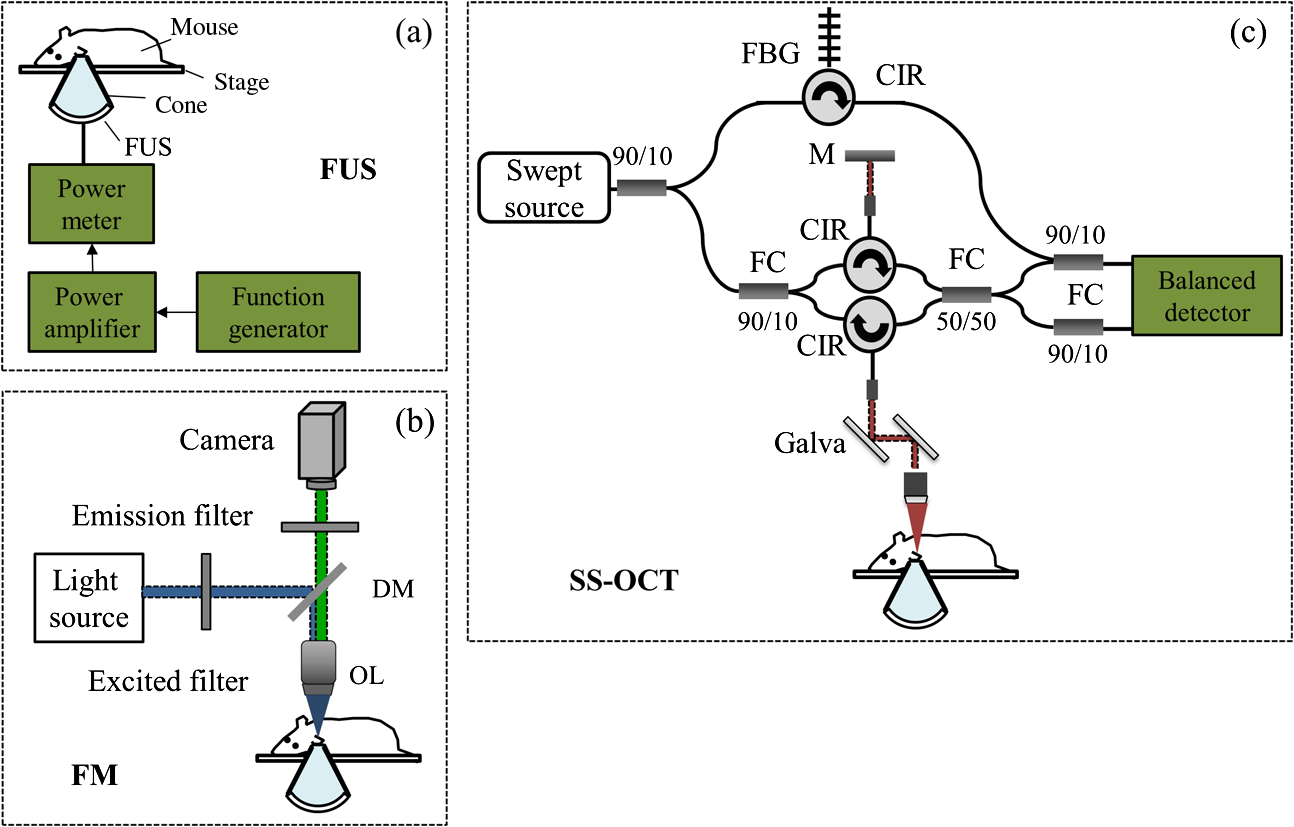 Before FUS exposure, the mice (C57 wild-type; male; 7-to-8-weeks old) were anesthetized with Avertin and the ears were mounted on a plastic plate. Ultrasound gel was swabbed on both sides of the ear to provide acoustic path coupling. To ensure that the imaged regions by the FA and OCT systems were overlapped, the field-of-view (FOV) region of the ear was marked. An intravenous catheter was then inserted into the tail to allow tail vein injections of microbubbles and FITC fluorescence dye. After microbubbles and fluorescent dye injection, burst-mode wave was delivered (burst length: 10 ms, pulse repetitive frequency: 1 Hz, duration: 120 s). The exposed FUS powers from the ultrasound transducer were set at 1, 4, and 10 W, which are equivalent to the rarefactional peak pressure of 0.075, 0.15, and 0.24 MPa, respectively. However, to reduce the damage accumulated on the same mouse ear and to better observe the relationship between vascular leakage/deformation and exposure power, only three different powers were used in our experiments. When the mouse ear was exposed under ultrasonic pressure, the FOV was simultaneously monitored by the FA system. After FA imaging and FUS exposure, the same marked region was scanned by the OCT system. The experiment was repeated with various FUS exposure powers on the same marked region. 3.Experimental Results and DiscussionFigure 2 shows the FA images obtained using various exposure powers of 1, 4, and 10 W. The images were captured 2 min after the injection of the fluorescence dye. Figure 2 shows that the fluorescent intensities of the extravascular spaces adjacent to the blood vessels increased after exposing the FUS due to the disruption of the cytoplasmic membrane of the endothelial cells, with which the signal increases as a function of the exposure level. To further illustrate the enhancement of fluorescent intensities as a function of time, Fig. 3 depicts the time-intensity curve (TIC) of the selected region of interest (ROI) from FA images at different time points (0, 5, 10, 15, 20, and 25 s) after the FITC dextrans injection and FUS exposure (10 W). Different diffusion patterns of the fluorescent dextrans were observed after FUS exposure (the difference between white and yellow arrows). Such information might be useful for characterizing vessel types, such as the differences between arteries and veins, and may be beneficial for further investigation of the effects of FUS on artery and vein. Fig. 2FA images of the mouse ear obtained using various exposure powers of 1, 4, and 10 W. The images were captured 2 min after the injection of fluorescence dye.  After FA imaging, the same marked regions were scanned by the OCT system. The FOV of the FA system was , but limited by the focus lens used in the sample arm of our OCT system, the scanning range was approximately [OCT scanning regions are squarely marked in Fig. 3(a)]. Figure 4 shows the corresponding 2-D OCT images of the identical locations indicated in Fig. 2(a). Figure 4(a) to 4(c) corresponds to the OCT scanning results at location I under the FUS exposure of 1, 4, and 10 W. Similarly, Fig. 4(d) to 4(f) and Fig. 4(g) to 4(i) show the OCT scanning results at locations II and III, respectively, under various FUS exposure levels ( roomed vessel structures were shown in the same figures to better observe the morphological changes of blood vessels). It can be qualitatively observed that the vessels present a significant lumen formation and intravascular space change, particularly at the FUS exposure level of 10 W. Fig. 42-D OCT images obtained from the three different locations indicated in Fig. 2(a) using various FUS exposure powers. (a) to (c) OCT scanning results at location I using exposure powers of 1, 4, and 10 W. (d) to (f) OCT scanning results at location II using exposure powers of 1, 4, and 10 W. (g) to (i) OCT scanning results at location III with various exposure powers of 1, 4, and 10 W. The vessel structures were magnified , as shown in the lower right corner.  4.Quantitative Analysis and DiscussionNext, we present a more quantitative analysis of the information obtained from FA and OCT images. To further analyze time-dependent intensity variation, three different regions in Fig. 2 were chosen for evaluating time-resolved changes of fluorescent intensities [denoted as A (black), B (red), and C (blue)]. The fluorescent intensities in each selected ROI was averaged to obtain mean intensities, and the TIC changes under exposure of 1, 4, and 10 W are demonstrated in Fig. 5(a) to 5(c). For the extravascular region (region A), the fluorescent intensity appeared to be a relatively low increase (20%) at 1 and 4 W exposure after FITC dextran injection, indicating that lower FUS exposure power did not cause dye leakage in region A. Here, nonzero background intensity in region A might be contributed from the fluorescence intensity of the vessels and capillaries at various depths. Relatively increased signal change in region C may be presumably due to fluorescence coupling from deeper vessels or microvascular leakage beyond our detection resolution limit of FA (currently a objective lens was applied). When increasing the power to 10 W, a significant fluorescent signal increase () due to the vessel disruption caused FITC dextran leakage. Concurrently, in blood vessel regions (regions B and C), similar signal increases were observed after FITC injection, which was relatively independent of the FUS exposure. Yet, the TIC patterns in vessel region B presents a signal overshoot, which the vessel region C did not. Here, the overshot signal at was due to the dye delivery through the artery. Thus the region B, indicated by the red lines, represents the artery. As time increases, the dye was delivered into the vein, resulting in the intensity decrease in region B and intensity increase in region C as shown in the blue line. Moreover, the vessel region C was not influenced by the signal enhancement due to FUS exposure, but the vessel region B seems to have a compensated signal reduction against the leakage of region C. These distinct TIC patterns may be utilized to characterize the blood vessel type (i.e., artery and vein) or the scale that vessels have been affected by FUS exposure. Also, we confirm that time-resolved intensity variation can be used to identify the occurrence of permeability increase, and FA might serve as a powerful tool to observe the dynamics of dye leakage and to identify the exposed outcome induced by FUS exposure. Fig. 5Time-resolved intensity variation with various exposure powers of 1, 4, and 10 W. Three different regions, which are indicated as A (black line), B (red line), and C (blue line) in Fig. 2, were chosen for the evaluation of time-resolved fluorescent intensities.  To quantitatively evaluate the morphological changes of the blood vessels from the OCT images, we propose an algorithm to determine the vessel area, which is based on the comparison of the backscattered properties of the skin tissue and vessels. Figure 6 shows the flow chart of OCT image processing algorithm for the estimation of vessel area. First, we evaluated the mean backscattered intensity over the entire lateral range at various depths from a 2-D OCT image, which can be expressed as where and are the lateral and longitudinal pixels, respectively, and and are the total pixels in a 2-D OCT image in the lateral and longitudinal directions, respectively. and represent the backscattered intensities of the 2-D OCT image and the mean backscattered intensities at various depths, respectively. In this study, each frame consists of 1000 A-scans, corresponding to equal to 1000, and only 500 pixels in the longitudinal direction are chosen for the evaluation of . The intensity variation of each pixel in a 2-D OCT image can be obtained by using as a threshold value. The intensity variation can be expressed asFigure 4 shows that the vessels in the ROI have weaker backscattered intensities than those of other skin tissues, making the values less than zero. Then, a binary image of vascular structures, , can be obtained by using zero as a threshold value. Thus, the vessel area also can be determined from . Subsequently, to further eliminate the background noise, the moving average method with a window size of was implemented to acquire an averaged OCT image. is the intensity of each pixel in the averaged OCT image after the moving average. In the averaged OCT image, a threshold value, , was chosen to distinguish the background noise from the tissue signal. Here, can be determined from the intensity of the vessel region of the A-scan intensity profile. Then, the logic operation was used to eliminate the background noise. When is larger than , the pixel is set to zero. Thus, the other binary image can be obtained from , denoted as . Finally, the vascular image can be acquired from Eq. (3), and the pixel intensity can be denoted as . Based on this algorithm, the vessel area in an OCT image also can be estimated. After obtaining the binary vascular image of Fig. 4, the vessel area can be estimated by summation of the pixel numbers of bight area, corresponding to vessel structures. Then, the sum is multiplied by the area of the single pixel. In our system, the area of the single pixel approximately equals . Finally, Fig. 7 shows the binary vascular image of Fig. 4, which was obtained from the proposed algorithm. To further investigate the relationship between morphological changes in vessel dimension and exposure power, the vessel area was estimated (Fig. 7 and the area summarized in Table 1). Table 1 indicates that the vascular area increased as a function of exposure power. The vascular area increased slightly when the ear was exposed to a lower FUS power (4 W). In contrast, the vascular area increased significantly when high-power FUS (10 W) was exposed. From the OCT results, it can be seen that high-power FUS exposure could induce vascular deformation, and it became more severe when the exposure power was increased. Based on the proposed algorithm, OCT can be used for the detection and quantitative evaluation of vascular deformation due to FUS exposure. Such information cannot be obtained from FA imaging. Table 1Summary of intravascular area (μm2) after FUS exposure (obtained from Fig. 7).
5.ConclusionsIn this study, the FA and OCT systems were implemented to investigate the effects of FUS treatment and to monitor vascular deformation after FUS treatment. The FUS-induced mechanical effect resulted in disruption of the cytoplasmic membrane of the endothelial cells of the blood vessels, making it easy for molecules to diffuse to the surrounding tissue. Thus, the diffusion process after the FUS treatment can be observed by using the FA system with the injection of fluorescence dye. The results indicate that the fluorescent intensities increased with the exposure power, likely because higher exposure power caused severe disruption of the cytoplasmic membrane of the endothelial cells. Moreover, the occurrence of permeability improvement can be identified from the time-resolved fluorescence intensities. Therefore, an FA system can be useful for real-time monitoring of molecular leakage induced by FUS. Although FUS treatment can effectively improve blood vessel permeability, a high-power FUS exposure may cause permanent histological damage. Therefore, an OCT system can be used to evaluate the deformation of blood vessels after FUS treatment. OCT scanning showed that FUS results in the morphological changes of blood vessels, a finding that could not be obtained using FA system. Additionally, to quantitatively evaluate the morphological changes of blood vessels, we proposed an algorithm to estimate the vascular area. The estimated results showed that the vascular area increased as the exposed FUS power increased. Such information is in agreement with the results obtained by using the FA system. The combination of the FA and OCT systems can be a powerful tool for real-time monitoring and evaluation of the effects of FUS treatment. AcknowledgmentsThis research was supported by National Science Council (NSC), and Chang Gung Memorial Hospital, under the grants of NSC 101-2221-E-182-056-MY2, NSC-101-2221-E-182-002-MY3, NSC-101-2321-B-182-015-, and CMRPD2B0031. ReferencesY. Taniyamaet al.,
“Local delivery of plasmid DNA into rat carotid artery using ultrasound,”
Circulation, 105
(10), 1233
–1239
(2002). http://dx.doi.org/10.1161/hc1002.105228 CIRCAZ 0009-7322 Google Scholar
P. E. Huberet al.,
“Focused ultrasound (HIFU) induces localized enhancement of reporter gene expression in rabbit carotid artery,”
Gene Ther., 10
(18), 1600
–1607
(2003). http://dx.doi.org/10.1038/sj.gt.3302045 GETHEC 0969-7128 Google Scholar
K. TachibanaS. Tachibana,
“Albumin microbubble echo-contrast material as an enhancer of ultrasound accelerated thrombolysis,”
Circulation, 92
(5), 1148
–1150
(1995). http://dx.doi.org/10.1161/01.CIR.92.5.1148 CIRCAZ 0009-7322 Google Scholar
K. Hynynenet al.,
“Noninvasive MR imaging-guided focal opening of the blood-brain barrier in rabbits,”
Radiology, 220
(3), 640
–646
(2001). http://dx.doi.org/10.1148/radiol.2202001804 RADLAX 0033-8419 Google Scholar
N. McDannoldet al.,
“MRI-guided targeted blood-brain barrier disruption with focused ultrasound: histological findings in rabbits,”
Ultrasound Med. Biol., 31
(11), 1527
–1537
(2005). http://dx.doi.org/10.1016/j.ultrasmedbio.2005.07.010 USMBA3 0301-5629 Google Scholar
H. L. Liuet al.,
“Magnetic resonance monitoring of focused ultrasound/magnetic nanoparticle targeting delivery of therapeutic agents to the brain,”
Proc. Natl. Acad. Sci. U. S. A., 107
(34), 15205
–15210
(2010). http://dx.doi.org/10.1073/pnas.1003388107 1091-6490 Google Scholar
V. Frenkelet al.,
“Pulsed high-intensity focused ultrasound enhances thrombolysis in an in vitro model,”
Radiology, 239
(1), 86
–93
(2006). http://dx.doi.org/10.1148/radiol.2391042181 RADLAX 0033-8419 Google Scholar
H. L. Liuet al.,
“Blood-brain barrier disruption by focused ultrasound enhances delivery of chemotherapeutic drugs for glioblastoma treatment,”
Radiology, 255
(2), 415
–425
(2010). http://dx.doi.org/10.1148/radiol.10090699 RADLAX 0033-8419 Google Scholar
J. S. AllenD. J. MayK. W. Ferrara,
“Dynamics of therapeutic ultrasound contrast agents,”
Ultrasound Med. Biol., 28
(6), 805
–816
(2002). http://dx.doi.org/10.1016/S0301-5629(02)00522-7 USMBA3 0301-5629 Google Scholar
S. B. Raymond,
“Multiphoton imaging of ultrasound/Optison mediated cerebrovascular effects in vivo,”
J. Cereb. Blood Flow Metab., 27
(2), 393
–403
(2007). http://dx.doi.org/10.1038/sj.jcbfm.9600336 JCBMDN 0271-678X Google Scholar
A. Agarwal, Fundus Fluorescein and Indocyanine Green Angiography: a Textbook and atlas Atlas, 1st ed.Slack Incorporated, NJ
(2007). Google Scholar
W. Songet al.,
“Integrating photoacoustic ophthalmology with scanning laser ophthalmoscopy, optical coherence tomography, and fluorescein angiography for a multimodal retinal imaging platform,”
J. Biomed. Opt., 17
(6), 061206
(2012). http://dx.doi.org/10.1117/1.JBO.17.6.061206 JBOPFO 1083-3668 Google Scholar
T. Holmeset al.,
“Dynamic indocyanine green angiography measurements,”
J. Biomed. Opt., 17
(11), 116028
(2012). http://dx.doi.org/10.1117/1.JBO.17.11.116028 JBOPFO 1083-3668 Google Scholar
S. W. KangC. Y. ParkD. I. Ham,
“The correlation between fluorescein angiographic and optical coherence tomographic features in clinically significant diabetic macular edema,”
Am. J. Ophthalmol., 137
(2), 313
–322
(2004). http://dx.doi.org/10.1016/j.ajo.2003.09.016 AJOPAA 0002-9394 Google Scholar
F. J. Ascaso,
“Spontaneous resolution of central serous chorioretinopathy in patient with congenital retinal macrovessel,”
Circulation, 124
(25), e904
–e905
(2011). http://dx.doi.org/10.1161/CIRCULATIONAHA.111.029835 CIRCAZ 0009-7322 Google Scholar
J. O. Norelet al.,
“Comparison of fluorescence of sodium fluorescein in retinal angiography with measurement in vitro,”
J. Biomed. Opt., 7
(2), 190
(2002). http://dx.doi.org/10.1117/1.1462034 JBOPFO 1083-3668 Google Scholar
D. Huanget al.,
“Optical coherence tomography,”
Science, 254
(5035), 1178
–1181
(1991). http://dx.doi.org/10.1126/science.1957169 SCIEAS 0036-8075 Google Scholar
D. C. Adleret al.,
“Three-dimensional endomicroscopy using optical coherence tomography,”
Nat. Photon., 1 709
–716
(2007). http://dx.doi.org/10.1038/nphoton.2007.228 1749-4885 Google Scholar
T. Torzickyet al.,
“Retinal polarization-sensitive optical coherence tomography at 1060 nm with 350 kHz A-scan rate using an Fourier domain mode locked laser,”
J. Biomed. Opt., 18
(2), 026008
(2013). http://dx.doi.org/10.1117/1.JBO.18.2.026008 JBOPFO 1083-3668 Google Scholar
S. MakitaM. YamanariY. Yasuno,
“Generalized Jones matrix optical coherence tomography: performance and local birefringence imaging,”
Opt. Express, 18
(2), 854
–876
(2010). http://dx.doi.org/10.1364/OE.18.000854 OPEXFF 1094-4087 Google Scholar
L. YuZ. Chen,
“Doppler variance imaging for three-dimensional retina and choroid angiography,”
J. Biomed. Opt., 15
(1), 016029
(2010). http://dx.doi.org/10.1117/1.3302806 JBOPFO 1083-3668 Google Scholar
S. Zotteret al.,
“Visualization of microvasculature by dual-beam phase-resolved Doppler optical coherence tomography,”
Opt. Express, 19
(2), 1217
–1227
(2011). http://dx.doi.org/10.1364/OE.19.001217 OPEXFF 1094-4087 Google Scholar
C. W. Luet al.,
“Measurement of the hemoglobin oxygen saturation level with spectroscopic spectral-domain optical coherence tomography,”
Opt. Lett., 33
(5), 416
–418
(2008). http://dx.doi.org/10.1364/OL.33.000416 OPLEDP 0146-9592 Google Scholar
M. T. Tsaiet al.,
“Effective indicators for diagnosis of oral cancer using optical coherence tomography,”
Opt. Express, 16
(20), 15847
–15862
(2008). http://dx.doi.org/10.1364/OE.16.015847 OPEXFF 1094-4087 Google Scholar
A. H. Dhallaet al.,
“Efficient sweep buffering in swept source optical coherence tomography using a fast optical switch,”
Biomed. Opt. Express, 3
(12), 3054
–3066
(2012). http://dx.doi.org/10.1364/BOE.3.003054 BOEICL 2156-7085 Google Scholar
L. Anet al.,
“High speed spectral domain optical coherence tomography for retinal imaging at 500,000 A-lines per second,”
Biomed. Opt. Express, 2
(10), 2770
–2783
(2011). http://dx.doi.org/10.1364/BOE.2.002770 BOEICL 2156-7085 Google Scholar
E. J. Minet al.,
“Full range spectral domain optical coherence tomography using a fiber-optic probe as a self-phase shifter,”
Opt. Lett., 37
(15), 3105
–3107
(2012). http://dx.doi.org/10.1364/OL.37.003105 OPLEDP 0146-9592 Google Scholar
S. MakitaT. FabritiusY. Yasuno,
“Full-range, high-speed, high-resolution 1-m spectral domain optical coherence tomography using BM-scan for volumetric imaging of human posterior eye,”
Opt. Express, 16
(12), 8406
–8420
(2008). http://dx.doi.org/10.1364/OE.16.008406 OPEXFF 1094-4087 Google Scholar
L. AnM. JohnstonR. K. Wang,
“Optical microangiography provides correlation between microstructure and microvasculature of optic nerve head in human subjects,”
J. Biomed. Opt., 17
(11), 116018
(2012). http://dx.doi.org/10.1117/1.JBO.17.11.116018 JBOPFO 1083-3668 Google Scholar
S. M. Srinivaset al.,
“Determination of burn depth by polarization-sensitive optical coherence tomography,”
J. Biomed. Opt., 9
(1), 207
–212
(2004). http://dx.doi.org/10.1117/1.1629680 JBOPFO 1083-3668 Google Scholar
S. Sakaiet al.,
“In vivo three-dimensional birefringence analysis shows collagen differences between young and old photo-aged human skin,”
J. Inv. Dermatol., 128
(7), 1641
–1647
(2008). http://dx.doi.org/10.1038/jid.2008.8 JIDEAE 0022-202X Google Scholar
W. Weiet al.,
“Integrated ultrasound and photoacoustic probe for co-registered intravascular imaging,”
J. Biomed. Opt., 16
(10), 106001
(2011). http://dx.doi.org/10.1117/1.3631798 JBOPFO 1083-3668 Google Scholar
Z. Wang,
“Volumetric quantification of fibrous caps using intravascular optical coherence tomography,”
Biomed. Opt. Express, 3
(6), 1413
–1426
(2012). http://dx.doi.org/10.1364/BOE.3.001413 BOEICL 2156-7085 Google Scholar
M. T. Tsaiet al.,
“Microvascular imaging using swept-source optical coherence tomography with single-channel acquisition,”
Appl. Phys. Express, 4 097001
(2011). http://dx.doi.org/10.1143/APEX.4.097001 1882-0778 Google Scholar
|