|
|
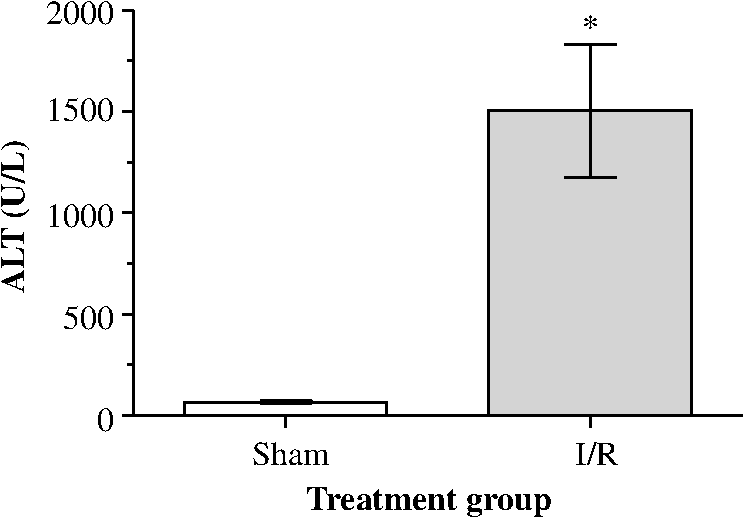
1.IntroductionA growing interest in intravital imaging has evolved due to limitations of conventional techniques in measuring dynamic real-time events.1 Intravital microscopy provides information about molecular and cellular processes with high spatial and temporal resolution in vivo.2 Imaging of live animal organs has been going on for 80 years, but has largely increased in the last decade with the improvement of conventional microscopes, especially nonlinear excitation, which has allowed deep tissue imaging.3 Multiphoton tomography (MPT) is the most popular application of fluorescence microscopy for imaging thick tissue and live animals, producing high-resolution three-dimensional images.4 It involves the excitation of two (or more) photons of lesser energy normally produced by single photon absorption of higher energy.5 MPT is particularly well suited for in vivo studies of drug distribution in biological tissues, as it reduces tissue damage and enhances image quality due to reduced photobleaching and increased penetration depth compared with conventional fluorescence microscopy.6–8 Fluorescence lifetime imaging microscopy (FLIM) in combination with MPT can identify fluorescent probes with overlapping spectral properties and measure lifetime specific for the probe and the surrounding environment.9 For example, autofluorescent nicotinamide adenine dinucleotide (NADH) is a direct measure of cellular metabolic state and can be used to study cellular damage.10–12 The free and bound forms of NADH are involved in the anaerobic and aerobic production of adenosine triphosphate (ATP), respectively.13,14 Accordingly, a change in the free/bound ratio gives insight into the metabolic state of a cell. In a previous study, our group showed a decreased metabolic activity as shown by an increased ratio of free/bound NADH in ischemia-reperfusion (I/R) injury in the liver.12 I/R injury is a common phenomenon in liver transplantation and resection, with morbidity and mortality as complications.15,16 During liver transplantation, ischemic damage occurs when blood flow is cut off to the donating liver, and the injury is further intensified when the liver is transplanted into the recipient.17 The reason for reperfusion injury is the reintroduction of oxygenated blood, which results in oxidative stress, causing increased microvascular permeability, intracellular ATP loss, inflammatory cell infiltration, and, potentially, cell death.18–20 As a consequence, oxidative stress may lead to graft failure and rejection of the liver.21 Cellular damage occurring in I/R injury have been shown to affect membrane proteins,22–24 which could affect distribution of drugs in the liver. Hepatic transporters are membrane proteins located on the sinusoidal, lateral, or canalicular membranes, facilitating uptake and excretion of many endogenous and exogenous substances.25 Fluorescein is a fluorescent probe and a substrate for the uptake transporters organic anion transporting polypeptides (OATP).26 It is metabolized to fluorescein monoglucuronide.27 Both fluorescein and fluorescein monoglucuronide are excreted into the bile by multidrug resistance-associated protein 2 (MRP2). It is not known if they are substrates for MRP3,28 an export transporter located on the lateral membrane of the cell, transporting substrate back to the blood (Fig. 1).25 However, other members of the fluorescein family, such as 5(6)-carboxy-2’7’-dichlorofluorescein and 5(6)-carboxyfluorescein, are secreted into the blood by MRP3; thus, it is likely that fluorescein and fluorescein monoglucuronide also interact with this transporter.29,30 The aim of this study was to investigate the transport of fluorescein in the liver following I/R injury by intravital multiphoton tomography, correlating these results with changes in biliary excretion, plasma concentrations, and expression of the transporters. 2.Materials and Methods2.1.Chemicals and ReagentsSodium fluorescein and -glucuronidase were purchased from Sigma Aldrich (St. Louis, MO). Ilium xylazil and ketamine hydrochloride were obtained from Bayer Australia (Pymble NSW, Australia) and Parnell Laboratories, Australia, respectively. Reagents used for western blot analysis were purchased from Bio-rad (Protein std precision plus BIO-Rad, IMMuno-blot membrane PVDF, TGS Buffer, TG Buffer, 30% Acrylamide/Bis Solution, , TEMED and Ammonium Persulfate); Thermo Fisher (Supersensitive West Femto Maximum Sensitivity, Pierce BCA Protein Assay Kit, Dental Developer replenisher, Dental fixer replenisher and T-mat g film); and Whatman (Whatman filter paper). MRP2 monoclonal [M2 III-6] antibody (catalogue number AB3373) was purchased from Sapphire Bioscience (Sydney NSW, Australia); OATP2 (catalogue number AB3572P) was purchased from Merck Millipore (Kilsyth VIC, Australia); and rabbit antibody MRP3 from Sigma Aldrich. The reagents used in real-time polymerase chain reaction (RT-PCR) were obtained from Invitrogen to Life Technologies Australia (Mulgrave, Victoria, Australia) (Sybr master mix) and Sigma Aldrich [quantitative PCR (qPCR) primers]. 2.2.AnimalsMale Wistar rats, weighing , purchased from the University of Queensland Biological Resources, were used in all experiments. All studies were approved by the Animal Ethics Committee at the University of Queensland. Rats were housed at the University of Queensland in Pharmacy Australia Centre of Excellence, where the temperature was maintained at and humidity at 60 to 75%, with artificial light for 12 h (7 a.m. to 7 p.m.) daily. All animals had unlimited access to food and water. 2.3.Surgical Procedures and I/R ModelRats were anaesthetized initially by an intraperitoneal injection of ketamine hydrochloride () and xylazine (). Anesthesia was maintained throughout the experiment by administering ketamine () and xylazil (). Body temperature was controlled by placing rats on a heating pad set to 37°C. Ischemia was induced locally in approximately 70% of the liver, by clamping the portal vein, hepatic artery, and bile duct supplying the median and left lobes using a microvascular clamp. After 60 min, the clamp was removed to allow reperfusion of the liver for 4 h and rats were allowed to recover during this time under close monitoring. Sham rats (i.e., untreated controls) underwent the same procedure without clamping the vessels. After 3 h of reperfusion, rats were again anaesthetized. The jugular vein and carotid artery were cleared of surrounding tissue and cannulated using polyethylene (PE)-tubing for administration of sodium fluorescein (intravenous bolus at 4 h of reperfusion) and blood collection. A midline laparotomy was performed to expose the liver and to cannulate the bile duct, which was cleared of surrounding fat tissue and cannulated using PE-tubing. The left lobe was slightly raised above the intraperitoneal cavity to allow imaging of fluorescein distribution. The liver and intraperitoneal cavity were kept moist by continuous administration of 0.9% saline throughout the experiment. 2.4.Tissue CollectionBlood (0.2 mL) was collected during the surgery from the inferior vena cava using a 30 gauge needle and plasma concentration of alanine transaminase (ALT) was measured using a Hitachi 747 analyzer (Hitachi Ltd., Tokyo, Japan). Blood for fluorescein determination was collected at 5, 10, 30, 60, 120, and 180 min from the carotid artery. Bile was collected in preweighted tubes every 10 min for 1 h and every hour after that for 3 h. At the end of the experiment, the left and median lobes were excised and portions were snap frozen in liquid nitrogen and stored at for later analysis with western blot and RT-PCR. 2.5.Multiphoton Intravital ImagingMPT images were recorded using a DermaInspect system (JenLab GmbH, Jena, Germany) equipped with an ultrashort (85 fs pulse width) pulsed mode-locked 80-MHz Titanium:Sapphire MaiTai laser (Spectra Physics, 25 Mountain View, USA). The excitation wavelength was set to 740 nm for liver autofluorescence and 920 nm for fluorescein fluorescence, with an emission signal range of 350 to 650 nm established through the use of a BG39 bandpass filter. Images were recorded with (low magnification) or (high magnification) objectives. The laser power was set to 15 or 20 mW and the acquisition time for obtaining the images was 13.4 or 7.4 s per frame for high- and low-magnification imaging, respectively. Each image was wide at a resolution of . The left lobe of the liver was placed on a metal plate, attached to an adjustable stand that could be elevated or lowered as required. The plate was slightly raised above the intraperitoneal cavity to reduce movement in the image from respiration and to minimize pressure on the organs underneath. Images were recorded before injection of fluorescein and then continuously throughout the experiment up to 180 min. FLIM data were collected with a time-correlated single-photon counting (TCSPC) SPC-830 detector (Becker & Hickl GmbH, Berlin, Germany) integrated into the MPT system. The TCSPC module assembles a photon distribution of the scan area across the and coordinates taken from four photon counters, with only three used for this study. The module determines the time of arrival for each photon detected within the fluorescence decay. Fluorescence emission was spectrally resolved between three linearly arranged photon counters through the use of three dichroic filters in the beam path, spectrally dividing the emission light into three channels for each photon counter: 350 to 450 nm {reduced nicotinamide adenine dinucleotide phosphate [NAD(P)H]}, 450 to 515 nm [NAD(P)H, flavin adenine dinucleotide (FAD)], and 515 to 620 nm (FAD, fluorescein).10,31 Each FLIM image was collected at an exposure of 13.4 s and acquisition image size of . 2.6.Image ProcessingAll image processing was done in ImageJ 1.44p (National Institutes of Health, USA). To trace the distribution of fluorescein in blood and hepatocytes, these areas were selected in the images recorded by low magnification. For analysis of fluorescein distribution in bile, this area was selected in images recorded by high magnification. The mean fluorescence intensity in these areas was calculated and converted into concentrations using a standard curve prepared in homogenized liver. The profile of fluorescein concentration (in sinusoid or hepatocyte) versus time was fitted by an empirical triexponential model. where is the concentration of F, is the time, , , , , , are model parameters, and was calculated as . The area under the curve (AUC) was calculated asModel fitting was performed using software SCIENTIST® (Micromath Scientist, Salt Lake City, UT). 2.7.FLIM Data AnalysisFLIM data analysis was performed using SPCImage 3.9.7 software (Becker & Hickl GmbH). FLIM data is composed of an array of pixels containing several time channels distributed across the fluorescence decay curve. The decay curve represents a sum of multiple exponentials, or components, as each pixel contains an overlay of fluorescence from several endogenous fluorophores at various conformations. For the data we obtained, a double-exponential decay model function was used. The fitted decay curve establishes two lifetimes: the short () and long () fluorescence decay lifetimes (ps) and with corresponding relative amplitude coefficients and (%), respectively. The instrument response function (IRF) was calibrated using a sucrose crystal standard first analysed by FLIM (Ajax Finechem Pty Ltd, Sydney, NSW, Australia) was used. Each individual FLIM image is convoluted with in the model function, , to calculate the function . The function below corresponds to the shape of the signal if the measured optical signal was identical to the model function . Using the function, the measured data points are obtained and analyzed to determine the average lifetime and relative contributions of each endogenous molecule. 2.8.High-Performance Liquid ChromatographyThe concentration of fluorescein and fluorescein monoglucuronide in each collected bile sample was determined by high-performance liquid chromatography (HPLC, Shimadzu, Kyoto, Japan) using 1 mL/min flow rate with a C18 column [Agilent HC-C18 (2) , 5 μm] that included a security guard column (Phenomex C18 ). Fluorescence excitation and emission wavelengths were 488 and 515 nm, respectively, with a retention time of 5 min. The mobile phase consisted of 50 mM and methanol (). Analysis of fluorescein involved diluting 5 μl of bile to 500 μl with 0.2 M acetate buffer. For analysis of fluorescein monoglucuronide (FG), a 5-μl bile sample was diluted in 50 μl -glucuronidase (10 U/100 μl). All samples were then incubated for 1 h at 37°C in a water bath. Fluorescein samples were further diluted in deionized water (), whereas FG samples were first diluted in an acetate buffer () and then in water (). Samples (10 μl) were injected into the HPLC system. Bile was collected in preweighted tubes, enabling calculation of the excretion rates for fluorescein and fluorescein monoglucuronide. 2.9.RT-PCRRNA was extracted from 100 to 150 mg liver tissue using TRIzol Reagent as instructed by the manufacturer. DNA contaminations were removed by incubation with RNase-free DNAse-1. First strand cDNA was synthesized from 1 μg total RNA using SuperScript III reverse transcriptase (Invitrogen) and oligo dT as instructed by the manufacturer. cDNA was diluted () in water, and 2 μl of the sample was added to each well in duplicates. A mixture containing 5 μl platinum SYBR® Green qPCR, 0.2 μl of forward and 0.2 μl of reverse primer and 2.6 μl water, was added to each well, after which the plate was centrifuged to mix the solutions. RT-PCR was read using a Roche LightCycler480. 2.10.Western BlotLiver slices were homogenized in protein lysis buffer solution (, weight:volume), after which triton ( buffer) was added and stored on ice. The solution was centrifuged at 13,000 rpm at 4°C for 20 min and the supernatant was collected. The supernatant, equivalent to 30 or 50 μg of protein, was mixed with loading buffer and heated for 5 min at 100°C. Acrylamide resolving gel (10%) and 4% stacking gel, both with sodium dodecyl sulfate, were prepared with tris-glycine as a running buffer. Electrophoresis was run at 150 V for 45 min, after which the gel was transferred to membranes at 100 V for 1 h at 4°C. The membranes were blocked in 10% skim milk in blocking buffer [tris-buffered saline with 0.1% Tween 20 (TBS-T)] overnight at 4°C while shaking. Membranes were incubated with primary antibody ( for OATP2 and MRP2 and for MRP3) in blocking buffer for 1.5 h, after which it was washed in TBS-T. Membranes were incubated with the secondary antibody ( for OATP2, for MRP3, and for MRP2) for 1.5 h, followed by washing in TBS-T first and then TBS. The membrane was developed onto film using a luminescence kit (SuperSignal® West Femto) with a reaction time of 5 min. -actin was used as a loading control ( for primary and for secondary antibody). Protein bands were quantified using ImageJ and adjusted with density of -actin. 2.11.Statistical AnalysisThe data are expressed as ( to 7). A student’s -test was used for statistical comparison of serum ALT levels, fluorescence lifetime data, and pharmacokinetic parameters between sham and I/R injury groups. To analyze statistical differences in mRNA or protein levels between sham and I/R injury groups at 4 and 24 h, a one-way analysis of variance was used with a post hoc Newman-Keuls test. Statistical analysis was done using GraphPad Prism v5.03 (GraphPad Software Inc., La Jolla, California) with a value less than 0.05 considered statistically significant. 3.Results3.1.I/R-Induced Elevation in Serum ALT LevelsFigure 2 demonstrates extensive liver damage as indicated by significantly elevated (; ) serum ALT levels in rats subjected to I/R injury () compared to sham (). 3.2.Intravital FLIM Imaging of the Rat Liver after Sham or I/R InjuryFigure 3(a) shows representative intravital FLIM images (pseudocolored according to average weighted lifetime ), across three spectral channels (i.e., 350 to 450, 450 to 515, and 515 to 620 nm), of hepatocytes from within the rat liver following sham or I/R injury. The data demonstrate that in the second spectral channel [450 to 515 nm; NAD(P)H/FAD], appears to be smaller in the rat liver after I/R injury (blue) relative to sham (yellow-green). This observation is also seen in Fig. 3(b), indicated by the left-shift of the histogram derived from the FLIM image. The average [450 to 515 nm; NAD(P)H/FAD] of hepatocytes from I/R-treated rats () was significantly lower (; ) than the sham control () [Fig. 3(c)]. Further examination revealed that the fast decay lifetime component () within hepatocytes was significantly smaller () in I/R-treated rats () compared to the sham control () [Fig. 3(d)]. The tendency for the long decay lifetime component () in I/R-treated rats to be smaller than the sham control was not statistically significant. In addition, while the of I/R-treated rats, in the 350 to 450 nm [NAD(P)H] spectral channel appeared smaller than the sham control [Fig. 3(b)], this difference was not statistically significant. Fig. 3I/R injury associated changes in the average weighted fluorescence lifetime () within the liver in vivo. (a) Representative intravital images of sham and I/R injury in the liver. FLIM data were measured within three spectral ranges [pseudocolor range (blue-to-red) indicated in parenthesis]: 350 to 450 (750 to 1500 ps), 450 to 515 (1000 to 1750 ps), and 515 to 620 nm (500 to 1750 ps) to capture NAD(P)H, NAD(P)H/FAD, and FAD/fluorescein, respectively. Each image is . (b) lifetime histograms of sham and I/R injury liver NAD(P)H, NAD(P)H/FAD, and FAD/fluorescein, respectively. The histograms represent the average pixel intensity for each lifetime. (c) The corresponding average lifetimes from the three spectral channels are charted for the sham and I/R injury groups. (d) The average short () and long () decay lifetimes obtained from the NAD(P)H/FAD (450 to 515 nm) channel for the sham and I/R injury groups. Values are presented as the mean±SEM (), or significantly different from sham.  Similar to Fig. 3, Fig. 4 shows representative redox FLIM images of hepatocytes from I/R and sham control rats. The images were pseudocolored according to the ratio of amplitude coefficients and . Figure 4(a) demonstrates that in the 350 to 450 nm [NAD(P)H] spectral channel, the redox ratio () appears higher in hepatocytes after I/R injury (red) relative to sham (blue-green). This tendency is reflected in the ratio histograms in Fig. 4(b). However, the average ratio in I/R-treated rats () is not significantly higher () than the sham control () [Fig. 4(c)]. Fig. 4I/R injury associated changes in the redox ratio () within the liver in vivo. (a) Representative redox intravital images of sham and I/R injury in the liver. FLIM data were measured within three spectral ranges [pseudocolor range: 0 to 5 (blue-to-red)]: 350 to 450, 450 to 515, and 515 to 620 nm to capture NAD(P)H, NAD(P)H/FAD, and FAD/fluorescein, respectively. Each image is . (b) Redox ratio histograms of sham and I/R injury liver NAD(P)H, NAD(P)H/FAD, and FAD/fluorescein, respectively. The histograms represent the average pixel intensity for each redox ratio value. (c) The corresponding average redox ratios from the three spectral channels are charted for the sham and I/R injury groups. Values are presented as the mean±SEM (). 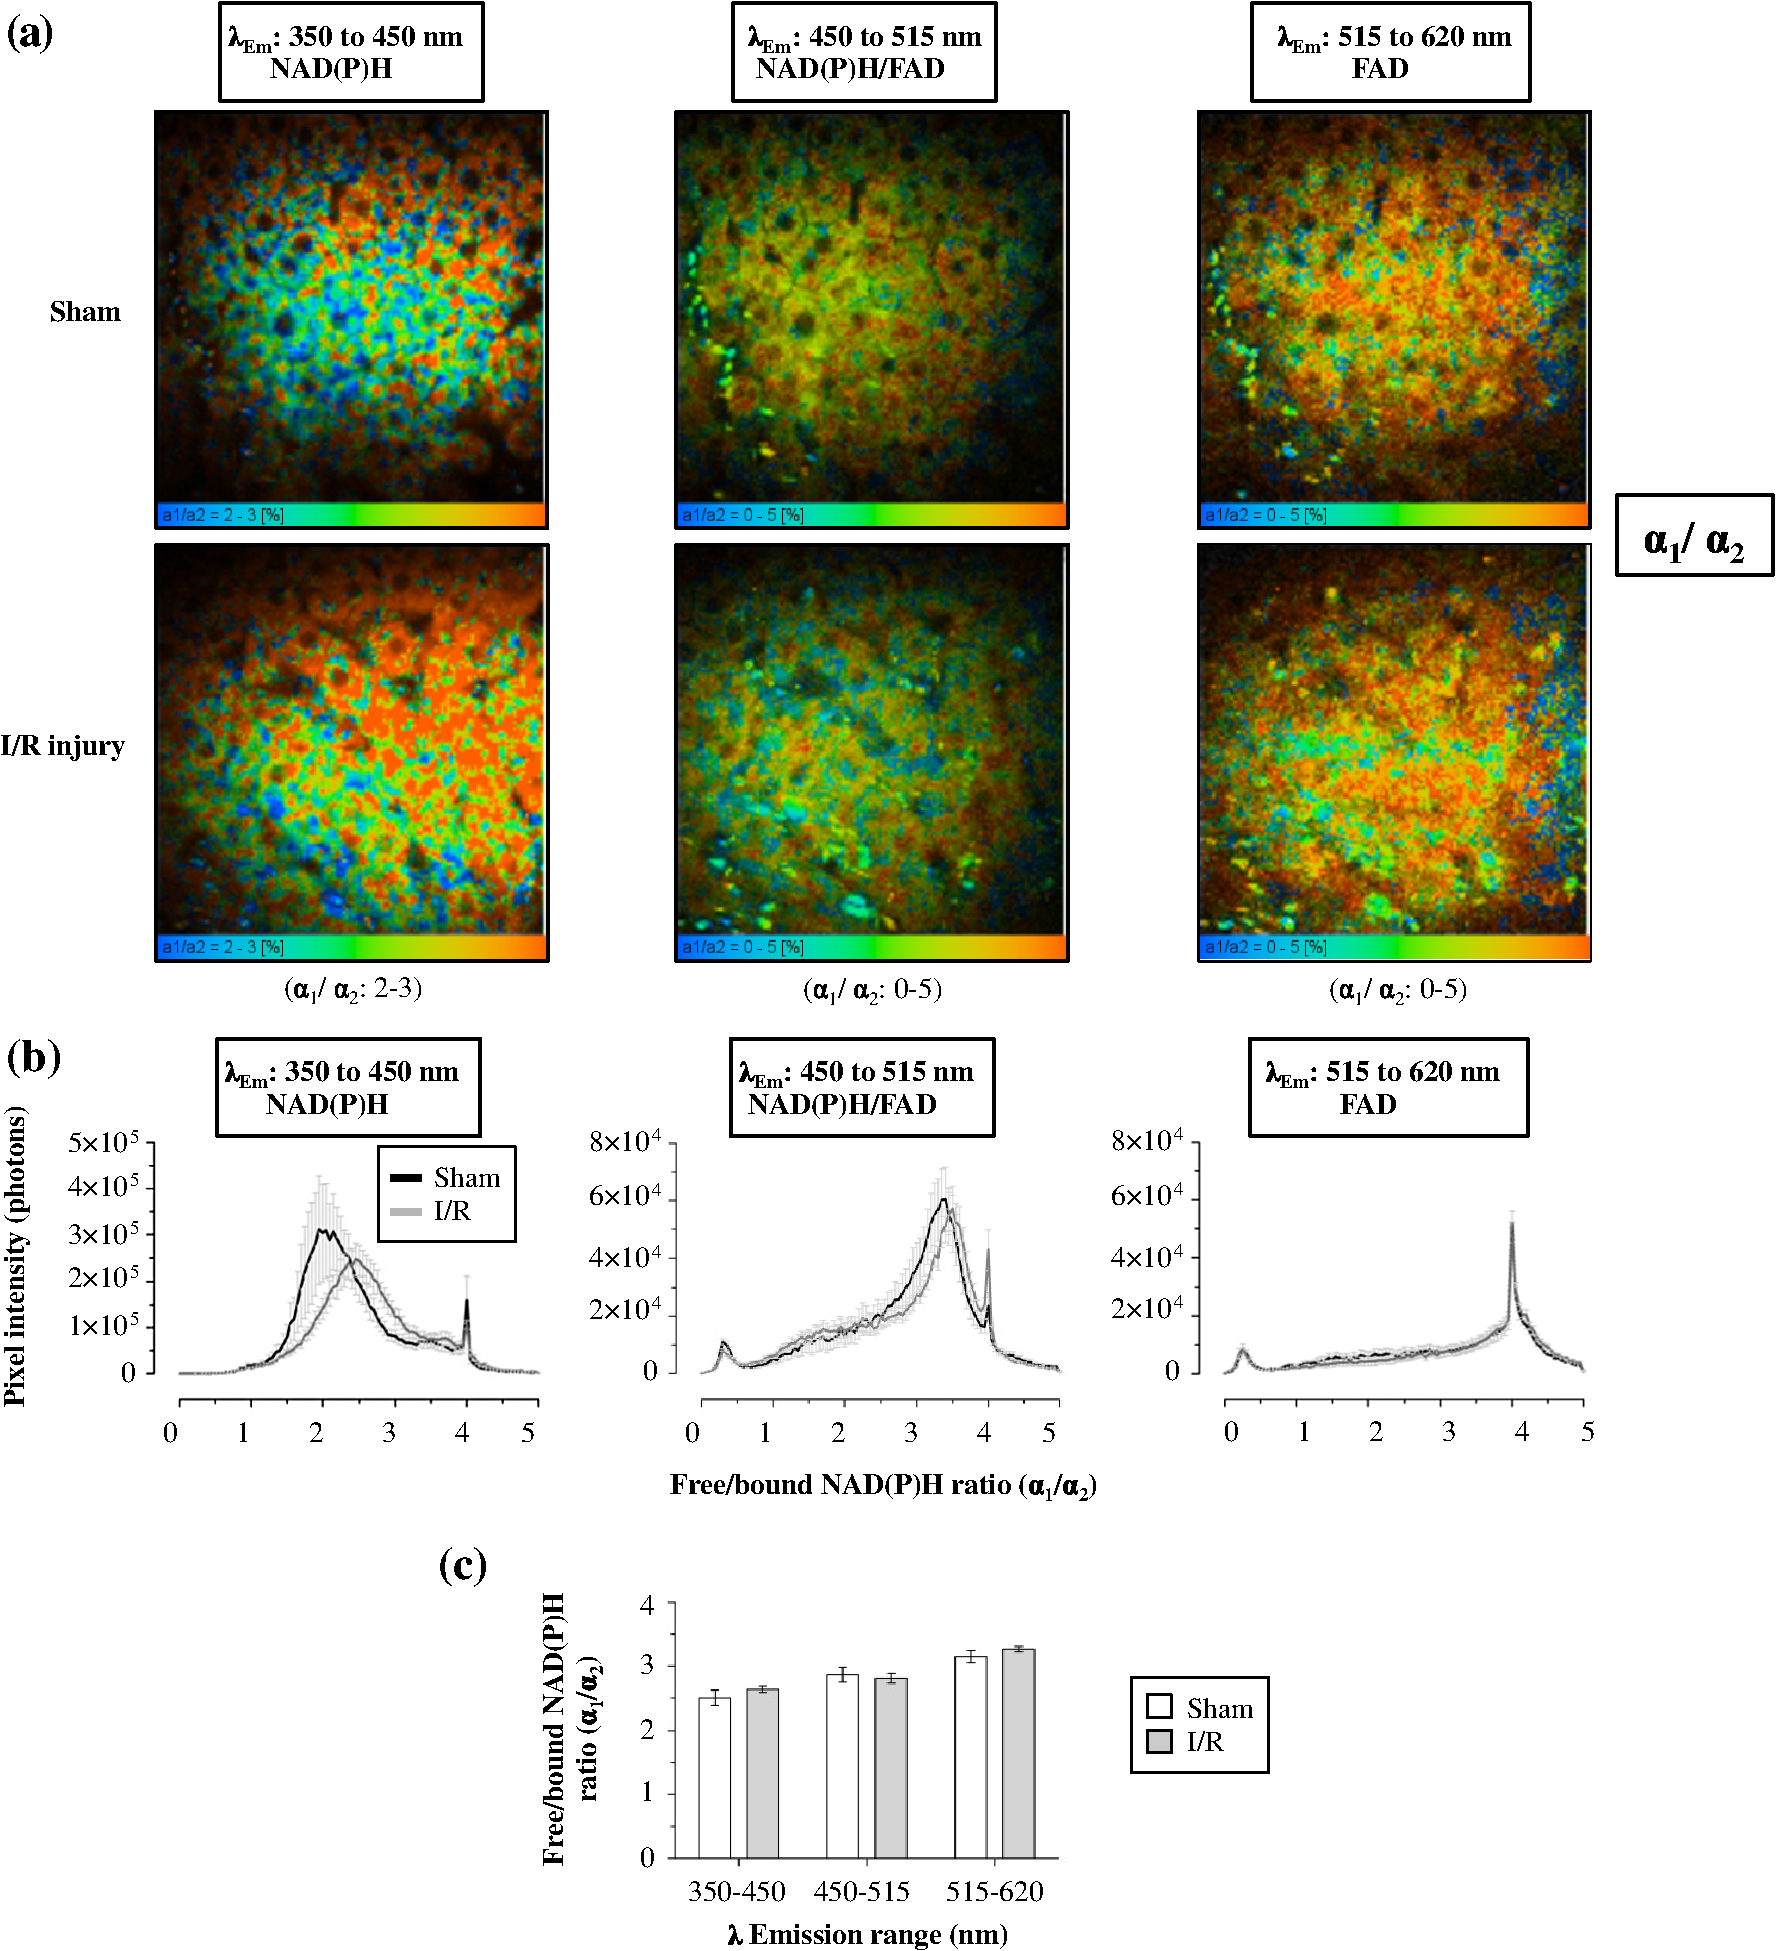 3.3.Fluorescein Uptake, Distribution, and Clearance from the Rat Liver after I/R InjuryFigure 5 shows representative fluorescence intravital images of the rat liver, from sham and I/R injury groups, over time after injection of fluorescein. Representative intravital images, taken at and magnifications [Fig. 5(a)], demonstrate elevated hepatocyte autofluorescence [two photon excitation (): 740 nm) in the sham control rats compared to I/R injury group. Figure 5(b) and 5(c) shows representative images of fluorescein (: 920 nm) uptake, distribution, and clearance within the liver of sham and I/R injury rats after injection at selected time points over a 180-min time-course. Fluorescein was detected within minutes after injection of fluorescein in sham and I/R injury rats. Fluorescein appears to be taken up and cleared from the liver faster in the sham group compared to the I/R injury group, which displayed delayed uptake and elevated retention within the liver over time [Fig. 5(b) and 5(c)]. Fig. 5Representative intravital images of fluorescein uptake in the sham and I/R injury rat liver groups. (a) Fluorescence intensity images recorded in vivo at : to 650 nm (endogenous autofluorescence) within sham and I/R injury (4 h of reperfusion) groups at low () and high () magnifications. (b) and (c) Fluorescence intensity images recorded in vivo at : to 650 nm (fluorescein fluorescence alone) in sham and I/R injury groups at various time points following 4 h of reperfusion at low () and high () magnifications, respectively. Narrow arrows indicate blood vessels, filled white arrows show hepatocytes, and opened arrows show bile duct. Scale bars for images taken at and magnifications indicate a length of 200 and 40 μm, respectively.  Figure 6(a) to 6(c) show the changes in fluorescein concentration within the sinusoids, hepatocytes, and bile, respectively, of sham and I/R injury rats after fluorescein injections. It appears that the fluorescein clearance rate from the sinusoids was slower for I/R injury, as indicated by a shallower slope [Fig. 6(a)], which was statistically significant () at 10 to 25 min. Similarly, the excretion rate from the hepatocytes also appeared slower in the I/R group [Fig. 6(b)]. Fig. 6Change in fluorescein concentration over time within the sinusoid (a), hepatocytes (b), and bile (c) of sham and I/R injury groups, measured by intravital imaging of fluorescein fluorescence within the rat liver and bile. A standard curve of fluorescein fluorescence intensity to concentration was established to measure unknown concentrations by intravital imaging. Data represent the mean concentration of fluorescein (). Significant differences are indicated with an asterisk ().  Figure 7(a) and 7(b) shows the AUC value and elimination half-life, respectively, for fluorescein in the sinusoids and hepatocytes, calculated by fitting data from Fig. 6(a) and 6(b) to a triple exponential equation. The data show a significantly increased () AUC in the hepatocytes () for the I/R injury group compared to the sham group (). The AUC in the sinusoids and the half-life in the hepatocytes tended to be higher for the I/R injury group ( and , respectively) relative to the sham group ( and , respectively), but these differences were not statistically significant. Fig. 7Pharmacokinetic parameters of fluorescein clearance within the hepatocytes of sham and I/R injury groups. Fluorescein accumulation (area under the curve) (a) and elimination half-life (b) were calculated from fluorescein fluorescence intensity changes within the hepatocytes. Data represent the mean±SEM (). Significant differences are indicated with an asterisk ().  3.4.Concentration of Fluorescein in Plasma and Excretion of Fluorescein and Metabolites in BileFigure 8(a) demonstrates that the plasma concentration of fluorescein, measured by HPLC, was similar in sham and I/R injury groups at 4 h of reperfusion. The biliary excretion rate of fluorescein [Fig. 8(b)] showed a slight tendency to be lower in the I/R injury group relative to the sham control group, though these differences were not statistically significant. In contrast, the biliary excretion rate of fluorescein monoglucuronide for sham and I/R injury groups was comparable over time [Fig. 8(c)]. 3.5.mRNA and Protein Expression of OATP2, MRP2, and MRP3Figure 9 shows the mRNA and protein expression of OATP2, MRP2, and MRP3 within excised liver tissue from sham and I/R injury groups. mRNA expression of the transporter gene MRP2 tended to be higher in the I/R injury group compared to the sham group after 4 h of reperfusion, respectively, while OATP2 and MRP3 transporter expression appeared to decrease after 4 and 24 h of reperfusion, respectively [Fig. 9(a)]. However, none of these differences were statistically significant. Similar to mRNA expression, OATP2 protein levels for the I/R injury group appeared to be higher than the sham group after 4 h of reperfusion [Fig. 9(b) and 9(c)]. MRP2 protein levels were comparable between sham and I/R injury groups at both time points. After 4 h of reperfusion, MRP3 levels in the I/R injury group were significantly lower than the sham [Fig. 9(c)]. At 24 h, MRP3 protein levels were comparable to the sham group. Fig. 9mRNA (a) and protein expression (b) and (c) of the transporters (MRP2, OATP2, and MRP3) involved in the uptake and excretion of both fluorescein and fluorescein monoglucuronide within the rat liver of sham and I/R injury groups. (b) Western blots of MRP2, OATP2, MRP3, and -actin expression from four independent rats in sham and I/R injury groups (4 and 24 h after reperfusion). (c) Densitometry quantification of protein expression of OATP2, MRP2, and MRP3 (normalized to -actin) of sham and I/R injury groups (4 and 24 h of reperfusion). Data represent the (). Significant differences are indicated with an asterisk ().  4.DiscussionIn this study, we used intravital imaging of the rat liver to further characterize hepatic metabolic damage associated with I/R injury. I/R injury was confirmed by measuring elevated serum ALT levels and changes in the metabolic and redox state of hepatocytes by FLIM. Intravital imaging of fluorescein uptake, distribution, and clearance was a more sensitive indicator of impaired liver function for I/R injury than measuring fluorescein levels in plasma or biliary excretion. Changes in uptake and clearance were also associated with acute changes in liver transport protein expression. As with previous studies showing an increased ALT in response to I/R injury,12,23,32 the present model for I/R injury also resulted in a significant elevation of serum ALT (Fig. 2), indicative of liver damage. We have previously described differences in the redox state of hepatocytes, using fluorescence lifetime imaging, between the sham and I/R damaged rat liver.12 Specifically, the amplitude coefficients ratio () of the short () and long () decay lifetimes increased over 4 h after I/R injury. The ratio is an indicator of the redox state of the cells, representing the proportion of free and protein-bound NAD(P)H within the cell.10 While we observed a tendency for the redox ratio to be elevated, this difference was not statistically significant (Fig. 4). In this study, we further characterized changes in the metabolic state of hepatocytes, after I/R injury, identifying a decrease in average weighted lifetime (), specifically due to a decrease in the lifetime (Fig. 3). This lifetime difference was observed in both the 350 to 450 and 450 to 515 nm spectral channels, both of which encompass NAD(P)H autofluorescence,31 though this was statistically significant only in the latter. The lack of any change in the fluorescence lifetime in the 515 to 620 nm spectral channel, which predominantly isolates the FAD autofluorescence,31 further supports the conclusion that NAD(P)H is responsible for the lifetime changes observed in the 450 to 515 nm channel. Moreover, as no lifetime change was simultaneously observed for FAD, this suggests that an environmental factor (e.g., pH) may not be responsible for the decrease in the lifetime of NAD(P)H [Fig. 3(d)] and may instead indicate a protein-binding interaction. As a result, the increase in the ratio in Fig. 4(b) may not necessarily indicate an increase in the proportion of free NAD(P)H. Our data are similar to NAD(P)H differences observed between photo-damaged skin, whereas solar-protected skin had an elevated lifetime () compared to solar-exposed skin. This may be due to similar metabolic damage occurring in both cell types, namely oxidative damage due to reactive oxygen species generation. As a result, NAD(P)H may be recruited by similar proteins related to oxidative repair, causing the lifetime change we observe in both solar-exposed skin and the liver after I/R injury.33 Interestingly, these lifetime changes are in sharp contrast to ischemic necrosis and apoptosis, which are associated with a significant increase in the fluorescence lifetime of NAD(P)H.11,34,35 While these processes also involve oxidative damage, the outcome is ultimately cell death and a breakdown of internal compartmentalization within the cell,36 which may alter protein recruitment of NAD(P)H and thus result in the lifetime changes we observe. Further studies are required to identify the protein-binding associated changes for NAD(P)H in response to I/R injury and cell death. To our knowledge, we are the first to associate hepatic I/R injury with specific lifetime changes in NAD(P)H, in addition to the free/bound redox ratio association we have published earlier.12 Our results demonstrate a delayed appearance and clearance of fluorescein within the sinusoid of liver with I/R injury (Fig. 5). Our mathematical model showed an increased elimination half-life and accumulation of fluorescein in the hepatocytes in the I/R injury group compared to the sham group, although only hepatocyte fluorescein accumulation was significantly elevated (Fig. 7). The delayed uptake of fluorescein following I/R injury is consistent with a previous study that showed delayed uptake and clearance of indocyanine green (ICG) in the rabbit liver following I/R injury.37 Another recent study also found a reduced uptake and clearance of perfused rhodamine 123 in the rat liver after I/R injury.38 To our knowledge, we are the first to use intravital imaging to visualize and model the uptake and clearance of a fluorescent compound to assess liver function following I/R injury. Delayed ICG uptake by the rabbit liver after I/R injury was associated with impaired hepatic microcirculation.37 In addition, another study reports that I/R injury is associated with a reduction in sinusoid density within the liver,39 which is believed to impair hepatic microcirculation.40 Therefore delayed fluorescein uptake may be due to a decrease in sinusoid diameter that impairs blood flow and thus availability of the dye to the hepatocytes. Interestingly, the differences in uptake and clearance of fluorescein measured by intravital imaging were not observed in plasma or bile using traditional HPLC to assay fluorescein or fluorescein monoglucuronide (Fig. 8). However, the model of I/R injury results in damage of parts of the liver, namely the median and left lobes, leaving the remaining lobes intact. Thus, the bile and plasma collected for concentration measurements represent the whole liver, including the nonischemic lobes. Intravital imaging allows us to image the damaged lobes directly and record events in space and time in vivo. In this study, we showed significantly decreased protein expression of the MRP3 transporter at 4 h of reperfusion compared to the sham group (Fig. 9). As MRP3 is responsible for transporting fluorescein from the hepatocytes into the sinusoids, this result may explain the increased AUC accumulation of fluorescein within the hepatocytes observed in Fig. 7. The expression of hepatic transporters is reported to be altered as a result of I/R injury. For example, the expressions of the bile salt export pump, MRP2, and OATP(s) were all reported to be decreased after 24 h of reperfusion in rats, while multidrug resistance protein 1B was increased.22–24 In nonalcoholic fatty liver disease, expression of MRP2 has been reported to be upregulated,41 whereas it was relatively well preserved in cholestasis and primary biliary cirrhosis.42,43 Interestingly, mRNA and protein levels of the OATP2 transporter appeared contradictory after 4 h of reperfusion [Fig. 7(a) and 7(c)]. While the differences in OATP2 expression between sham and I/R injury groups are not statistically significant, the trend may suggest an initial upregulation of OATP2 expression, as reflected by elevated protein levels after 4 h of reperfusion, to augment impaired fluorescein uptake into the hepatocytes from the sinusoids due to I/R damage. A consequence of increased levels of transporters may be that they facilitate liver regeneration and possibly increase bile secretion per weight of functional liver and provide hepatic resistance against cytokine-metabolic stress.44 Decreased mRNA transcripts of OATP2 in the I/R injury group after 4 h may be indicative of a negative feedback loop that has not yet affected protein levels at this time point. The comparable mRNA and protein levels of OATP2 between sham and I/R injury groups after 24 h appears to support this hypothesis. Additional studies measuring changes in transcription and protein levels real-time are necessary to elucidate this possibility. Our study has demonstrated that MPT imaging and the kinetics of fluorescein uptake and/or clearance may be used to measure liver function after transplantation, in order to assess damage from I/R injury. This approach may be used to assess liver damage intraoperatively by directly imaging selected lobes of the transplanted or damaged liver.12 The advantage of this approach is that potential damage could be determined in a few hours, rather than up to 18 to 24 h post-transplantation using plasma-ICG clearance,45 to allow for clinical intervention prior to the completion of surgery. MPT imaging equipment and the use of microendoscopic objectives are improving the size and portability as demonstrated for dermatological imaging46 and small animal surgery,47 suggesting current equipment can be used for assessing liver function in vivo as demonstrated by our study. In conclusion, intravital MPT is a simple and effective optical technique to study drug distribution in normal and diseased liver. It has proven to be a more sensitive alternative to bile and plasma concentration measurements. Furthermore, we have provided a simple mathematical model in studying drug uptake and excretion using intravital MPT. AcknowledgmentsWe would like to thank National Health and Medical Research Council (NHMRC #569710) for funding this project; Mr. Goce Dimeski and colleagues at Queensland Pathology Services, Princess Alexandra Hospital, for conducting ALT measurements; Mrs. Lesley-Anne Jaskowski, Ms. Erika de Guzman, and Ms. Xiaowen Liang for technical assistance. ReferencesK. W. EliceiriC. Rueden,
“Tools for visualizing multidimensional images from living specimens,”
Photochem. Photobiol., 81
(5), 1116
–1122
(2005). http://dx.doi.org/10.1562/2004-11-22-IR-377 PHCBAP 0031-8655 Google Scholar
R. K. JainL. L. MunnD. Fukumura,
“Dissecting tumour pathophysiology using intravital microscopy,”
Nat. Rev. Cancer, 2
(4), 266
–276
(2002). http://dx.doi.org/10.1038/nrc778 NRCAC4 1474-175X Google Scholar
R. Weigertet al.,
“Intravital microscopy: a novel tool to study cell biology in living animals,”
Histochem. Cell Biol., 133
(5), 481
–491
(2010). http://dx.doi.org/10.1007/s00418-010-0692-z 0948-6143 Google Scholar
J. CondeelisJ. E. Segall,
“Intravital imaging of cell movement in tumours,”
Nat. Rev. Cancer, 3
(12), 921
–930
(2003). http://dx.doi.org/10.1038/nrc1231 NRCAC4 1474-175X Google Scholar
W. R. ZipfelR. M. WilliamsW. W. Webb,
“Nonlinear magic: multiphoton microscopy in the biosciences,”
Nat. Biotechnol., 21
(11), 1369
–1377
(2003). http://dx.doi.org/10.1038/nbt899 NABIF9 1087-0156 Google Scholar
K. W. DunnP. A. Young,
“Principles of multiphoton microscopy,”
Nephron Exp. Nephrol., 103
(2), e33
–e40
(2006). http://dx.doi.org/10.1159/000090614 1660-2129 Google Scholar
H-S. Leeet al.,
“Optical biopsy of liver fibrosis by use of multiphoton microscopy,”
Opt. Lett., 29
(22), 2614
–2616
(2004). http://dx.doi.org/10.1364/OL.29.002614 OPLEDP 0146-9592 Google Scholar
R. M. WilliamsW. R. ZipfelW. W. Webb,
“Multiphoton microscopy in biological research,”
Curr. Opin. Chem. Biol., 5
(5), 603
–608
(2001). http://dx.doi.org/10.1016/S1367-5931(00)00241-6 COCBF4 1367-5931 Google Scholar
L. Yanet al.,
“Applications of combined spectral lifetime microscopy for biology,”
BioTechniques, 41
(3), 249
–251
(2006). http://dx.doi.org/10.2144/000112251 BTNQDO 0736-6205 Google Scholar
M. S. Robertset al.,
“Non-invasive imaging of skin physiology and percutaneous penetration using fluorescence spectral and lifetime imaging with multiphoton and confocal microscopy,”
Eur. J. Pharm. Biopharm., 77
(3), 469
–488
(2011). http://dx.doi.org/10.1016/j.ejpb.2010.12.023 EJPBEL 0939-6411 Google Scholar
W. Y. Sanchezet al.,
“Analysis of the metabolic deterioration of ex vivo skin from ischemic necrosis through the imaging of intracellular NAD(P)H by multiphoton tomography and fluorescence lifetime imaging microscopy,”
J. Biomed. Opt., 15
(4), 046008
(2010). http://dx.doi.org/10.1117/1.3466580 JBOPFO 1083-3668 Google Scholar
C. A. Thorlinget al.,
“Multiphoton microscopy can visualize zonal damage and decreased cellular metabolic activity in hepatic ischemia-reperfusion injury in rats,”
J. Biomed. Opt., 16
(11), 116011
(2011). http://dx.doi.org/10.1117/1.3647597 JBOPFO 1083-3668 Google Scholar
D. K. Birdet al.,
“Metabolic mapping of MCF10A human breast cells via multiphoton fluorescence lifetime imaging of the coenzyme NADH,”
Cancer Res., 65
(19), 8766
–8773
(2005). http://dx.doi.org/10.1158/0008-5472.CAN-04-3922 CNREA8 0008-5472 Google Scholar
V. V. GhukasyanF-J. Kao,
“Monitoring cellular metabolism with fluorescence lifetime of reduced nicotinamide adenine dinucleotide,”
J. Phys. Chem. C, 113
(27), 11532
–11540
(2009). http://dx.doi.org/10.1021/jp810931u 1932-7447 Google Scholar
J. Baumannet al.,
“Short-term effects of N-acetylcysteine and ischemic preconditioning in a canine model of hepatic ischemia-reperfusion injury,”
Eur. Surg. Res., 41
(2), 226
–230
(2008). http://dx.doi.org/10.1159/000135707 EUSRBM 0014-312X Google Scholar
Y. Takamatsuet al.,
“Inhibition of inducible nitric oxide synthase prevents hepatic, but not pulmonary, injury following ischemia-reperfusion of rat liver,”
Dig. Dis. Sci., 51
(3), 571
–579
(2006). http://dx.doi.org/10.1007/s10620-006-3172-5 DDSCDJ 0163-2116 Google Scholar
M. L. Hartet al.,
“Use of a hanging-weight system for liver ischemic preconditioning in mice,”
Am. J. Physiol. Gastrointest. Liver Physiol., 294
(6), G1431
–G1440
(2008). http://dx.doi.org/10.1152/ajpgi.00083.2008 0193-1857 Google Scholar
R. Chavez-Cartayaet al.,
“Free radical scavengers to prevent reperfusion injury following experimental warm liver ischaemia. Is there a real physiological benefit?,”
Transpl. Int., 12
(3), 213
–221
(1999). http://dx.doi.org/10.1111/j.1432-2277.1999.tb00609.x TRINE5 0934-0874 Google Scholar
D. Crenesse,
“Protein kinase activation by warm and cold hypoxia—Reoxygenation in primary-cultured rat hepatocytes–JNK1/SAPK1 involvement in apoptosis,”
J. Microsc., 32
(5), 1029
–1036
(2000). http://dx.doi.org/10.1053/jhep.2000.19065 JMICAR 0022-2720 Google Scholar
G. Seneret al.,
“Melatonin and N-acetylcysteine have beneficial effects during hepatic ischemia and reperfusion,”
Life Sci., 72
(24), 2707
–2718
(2003). http://dx.doi.org/10.1016/S0024-3205(03)00187-5 LIFSAK 0024-3205 Google Scholar
H. Sasakiet al.,
“Activation of apoptosis during early phase of reperfusion after liver transplantation,”
Transplant. Proc., 29
(1–2), 406
–407
(1997). http://dx.doi.org/10.1016/S0041-1345(96)00138-8 TRPPA8 0041-1345 Google Scholar
D. Banet al.,
“Decreased Mrp2-dependent bile flow in the post-warm ischemic rat liver,”
J. Surg. Res., 153
(2), 310
–316
(2009). http://dx.doi.org/10.1016/j.jss.2008.02.064 JSGRA2 0022-4804 Google Scholar
L. Fouassieret al.,
“Hypoxia-induced changes in the expression of rat hepatobiliary transporter genes,”
Am. J. Physiol. Gastrointest. Liver Physiol., 293
(1), G25
–35
(2007). http://dx.doi.org/10.1152/ajpgi.00175.2006 0193-1857 Google Scholar
Y. Tanakaet al.,
“Kupffer cell-mediated downregulation of hepatic transporter expression in rat hepatic ischemia-reperfusion,”
Transplantation, 82
(2), 258
–266
(2006). http://dx.doi.org/10.1097/01.tp.0000226243.69023.54 TRPLAU 0041-1337 Google Scholar
P. Liet al.,
“Liver transporters in hepatic drug disposition: an update,”
Curr. Drug Metab., 10
(5), 482
–498
(2009). http://dx.doi.org/10.2174/138920009788898037 CDMUBU 1389-2002 Google Scholar
T. De. Bruynet al.,
“Sodium fluorescein is a probe substrate for hepatic drug transport mediated by OATP1B1 and OATP1B3,”
J. Pharm. Sci., 100
(11), 5018
–5030
(2011). http://dx.doi.org/10.1002/jps.22694 JPMSAE 0022-3549 Google Scholar
D. GrotteV. MattoxR. F. Brubaker,
“Fluorescein glucuronide: can this metabolite interfere with fluorescein tracer studies?,”
Trans. Am. Ophthalmol. Soc., 81 125
–129
(1983). TAOSAT 0065-9533 Google Scholar
S. Vander Borghtet al.,
“Expression of multidrug resistance-associated protein 1 in hepatocellular carcinoma is associated with a more aggressive tumour phenotype and may reflect a progenitor cell origin,”
Liver Int., 28
(10), 1370
–1380
(2008). http://dx.doi.org/10.1111/j.1478-3231.2008.01889.x LIINCM 1478-3223 Google Scholar
M. J. Zamek-Gliszczynski,
“Pharmacokinetics of 5 (and 6)-carboxy-2,”7-”dichlorofluorescein and its diacetate promoiety in the liver,”
J. Pharmacol. Exp. Ther., 304
(2), 801
–809
(2003). http://dx.doi.org/10.1124/jpet.102.044107 JPETAB 0022-3565 Google Scholar
S. TengV. JekerleM. Piquette-Miller,
“Induction of ABCC3 (MRP3) by pregnane X receptor activators,”
Drug Metab. Dispos., 31
(11), 1296
–1299
(2003). http://dx.doi.org/10.1124/dmd.31.11.1296 DMDSAI 0090-9556 Google Scholar
Y. Yuet al.,
“Imaging-guided two-photon excitation-emission-matrix measurements of human skin tissues,”
J. Biomed. Opt., 17
(7), 077004
(2012). http://dx.doi.org/10.1117/1.JBO.17.7.077004 JBOPFO 1083-3668 Google Scholar
S. DemirM. Inal-Erden,
“Pentoxifylline and N-acetylcysteine in hepatic ischemia/reperfusion injury,”
Clin. Chim. Acta., 275
(2), 127
–135
(1998). http://dx.doi.org/10.1016/S0009-8981(98)00078-3 CCATAR 0009-8981 Google Scholar
W. Y. Sanchezet al.,
“Changes in the redox state and endogenous fluorescence of in vivo human skin due to intrinsic and photo-aging, measured by multiphoton tomography with fluorescence lifetime imaging,”
J. Biomed. Opt., 18
(6), 61217
(2013). http://dx.doi.org/10.1117/1.JBO.18.6.061217 JBOPFO 1083-3668 Google Scholar
H-W. Wanget al.,
“Differentiation of apoptosis from necrosis by dynamic changes of reduced nicotinamide adenine dinucleotide fluorescence lifetime in live cells,”
J. Biomed. Opt., 13
(5), 054011
(2008). http://dx.doi.org/10.1117/1.2975831 JBOPFO 1083-3668 Google Scholar
M. C. Skalaet al.,
“In vivo multiphoton fluorescence lifetime imaging of protein-bound and free nicotinamide adenine dinucleotide in normal and precancerous epithelia,”
J. Biomed. Opt., 12
(2), 024014
(2007). http://dx.doi.org/10.1117/1.2717503 JBOPFO 1083-3668 Google Scholar
S. Elmore,
“Apoptosis: a review of programmed cell death,”
Toxicologic Path., 35
(4), 495
–516
(2007). http://dx.doi.org/10.1080/01926230701320337 TOPADD 0192-6233 Google Scholar
A. M. Seifalianet al.,
“Effects of hepatic ischaemia/reperfusion injury in a rabbit model of indocyanine green clearance,”
Clin. Sci., 102
(5), 579
–586
(2002). http://dx.doi.org/10.1042/CS20010225 CSCIAE 1470-8736 Google Scholar
R. ParasrampuriaI. H. ShaikR. Mehvar,
“Effects of in vivo hepatic ischemia-reperfusion injury on the hepatobiliary disposition of rhodamine 123 and its metabolites in isolated perfused rat livers,”
J. Pharm. Pharm. Sci., 15
(2), 318
–328
(2012). JPMSAE 0022-3549 Google Scholar
C. K. Sunet al.,
“Effect of ischemia-reperfusion injury on the microcirculation of the steatotic liver of the Zucker rat,”
Transplantation, 72
(10), 1625
–1631
(2001). http://dx.doi.org/10.1097/00007890-200111270-00008 TRPLAU 0041-1337 Google Scholar
M. Mendes-Brazet al.,
“The current state of knowledge of hepatic ischemia-reperfusion injury based on its study in experimental models,”
J. Biomed. Biotechnol., 2012 298657
(2012). http://dx.doi.org/10.1155/2012/298657 JBBOAJ 1110-7251 Google Scholar
A. J. Lickteiget al.,
“Efflux transporter expression and acetaminophen metabolite excretion are altered in rodent models of nonalcoholic fatty liver disease,”
Drug Metab. Dispos., 35
(10), 1970
–1978
(2007). http://dx.doi.org/10.1124/dmd.107.015107 DMDSAI 0090-9556 Google Scholar
G. Zollneret al.,
“Hepatobiliary transporter expression in percutaneous liver biopsies of patients with cholestatic liver diseases,”
Hepatology, 33
(3), 633
–646
(2001). http://dx.doi.org/10.1053/jhep.2001.22646 HEPADF 0161-0538 Google Scholar
G. Zollneret al.,
“Adaptive changes in hepatobiliary transporter expression in primary biliary cirrhosis,”
J. Hepatol., 38
(6), 717
–727
(2003). http://dx.doi.org/10.1016/S0168-8278(03)00096-5 JOHEEC 0168-8278 Google Scholar
T. A. Voset al.,
“Up-regulation of the multidrug resistance genes, Mrp1 and Mdr1b, and down-regulation of the organic anion transporter, Mrp2, and the bile salt transporter, Spgp, in endotoxemic rat liver,”
Hepatology, 28
(6), 1637
–1644
(1998). http://dx.doi.org/10.1002/(ISSN)1527-3350 HEPADF 0161-0538 Google Scholar
J. N. Plevriset al.,
“Indocyanine green clearance reflects reperfusion injury following liver transplantation and is an early predictor of graft function,”
J. Hepatol., 30
(1), 142
–148
(1999). http://dx.doi.org/10.1016/S0168-8278(99)80018-X JOHEEC 0168-8278 Google Scholar
M. Baluet al.,
“In vivo multiphoton NADH fluorescence reveals depth-dependent keratinocyte metabolism in human skin,”
Biophys. J., 104
(1), 258
–267
(2013). http://dx.doi.org/10.1016/j.bpj.2012.11.3809 BIOJAU 0006-3495 Google Scholar
K. Konig,
“Clinical multiphoton tomography,”
J. Biophoton., 1
(1), 13
–23
(2008). http://dx.doi.org/10.1002/(ISSN)1864-0648 JBOIBX 1864-063X Google Scholar
|