
|
|
1.IntroductionIn our laboratory, we are developing a wireless implantable device for neural microstimulation, where near-infrared (NIR) light is used for energy transfer to the microstimulators through neural tissue.1–3 Microelectrode implants often fail either due to the chronic tissue response caused by the tethering forces of the wires or their breakage.4,5 A wireless neural stimulator can solve the problems associated with wire interconnects. While the main objective of this study was to determine whether we could transmit such amounts of light into the depths of neural tissue that can generate sufficient electric currents for neural stimulation, our results can also provide practical insights for those who are investigating NIR light–neural tissue interactions. NIR lasers have been utilized for many diagnostic and therapeutic applications in medicine such as neural imaging6 and chronic pain treatment.7 Hematoma detection8 and treatments for stroke patients are new applications under investigation.9 An NIR light between 700 and 900 nm has minimal absorption and scattering,10 therefore light penetration into neural tissue is maximum at these wavelengths. Recent NIR applications considered for the clinic have produced a perception that NIR light can penetrate a few centimeters into the tissue through skin exposure where it can cause functional changes, whether due to the heat generated or other mechanisms.9 Although this may be correct in general, one should be cautious about how the penetration depth is defined. Photon density decreases steeply with depth in tissue and the remaining light intensity at the targeted depths may be too small to induce the desired effects. The intensity at the surface will always be higher relative to the deeper regions whether it is muscle or neural tissue that is under investigation. When light photons are sent into tissue, they may be reflected back at the surface of entry, absorbed or scattered as they propagate inside, or transmitted to the other side. In general, light propagation inside a uniform medium is defined by the absorption (), scattering (), and anisotropy () coefficients. The wavelength and the tissue type are the primary factors that determine these coefficients. The light intensity profile by depth is governed by Beer’s law, a simple exponential decay, if multiple scatterings can be avoided. In tissue slices thicker than , however, the intensity profile deviates from an exponential where multiple scatterings take place before a photon is absorbed. Both direct and indirect methods have been employed to measure the optical properties of biological tissues.11 Direct methods are based on Beer’s law where a thin piece of tissue is used, as in the collimated transmission technique. In this method, the unscattered light transmitted through the slab is detected on the other side for various tissue thicknesses and penetration depth is calculated by fitting an exponential curve to the measurements according to the Beer’s law. The scattering coefficient can be predicted from experimental measurements of transmittance and reflectance together.12 Indirect methods are based on a model of light transport. The integrating sphere method is a common technique where the absorption coefficient () and the reduced scattering coefficient () are deduced from measurements of diffuse reflectance and total transmittance. The coefficients are then predicted based on light transport models such as the Monte Carlo method.13 The Monte Carlo simulation is a powerful technique where probabilistic locations of a large number of photons are calculated as they propagate inside the tissue with known optical properties. Because scattering is the dominant phenomenon in the neural tissue at NIR wavelengths, it is crucial to know the scattering coefficient in order to predict the light penetration profile. The rat nervous system is frequently used as an animal model in testing lasers for various applications.14 There are several reports on optical properties of human neural tissue also.15–17 However, the scattering and absorption coefficients predicted in these reports spread over a wide range of values.10,18 Thus, we set out to determine the light intensity profile with direct measurements of light intensity inside the brain of an intact animal model using an optical fiber. Our main objective was to narrow the reported range of scattering coefficients down and determine its value with a higher confidence in the rat brain. The results from the in vivo experiments were compared with the in vitro transmission measurements published in an abstract form earlier19 and Monte Carlo simulations were used to estimate the scattering coefficients. 2.Methods2.1.In Vivo ExperimentsNine Sprague–Dawley rats (275 to 450 g) were used in this part. All experimental procedures were approved by the Animal Care Committee at Rutgers University, New Jersey. Under a single injection of urethane anesthesia (, IP), a cranial opening was made immediately rostral to the bregma on the right side of the central fissure [Fig. 1(a)]. Dexamethasone (, IM) was injected prior to surgery to reduce edema of the brain. Some protrusion of the brain pressing against the edge of the skull through the cranial opening was allowed to stabilize the tissue and minimize the motion artifact due to respiration and cardiac pulsation. A slight traction on the tail further reduced the brain motion in some cases. Connective tissue and any blood clot over the surface were cleaned without removing the dura mater. Surgical wax was applied to seal between the dura and the skull around the edges of the opening, and a shallow pool of normal saline (-mm high) was made to prevent dehydration. The rectal temperature was continuously monitored and maintained at 36°C using a temperature regulated heating pad underneath the animal. The end-tidal was observed to stay within the normal range throughout the experiment, which usually lasted about 6 to 7 h including the surgery. Fig. 1(a) Sketch of the cranial opening made rostral to the bregma on the right side of the central fissure. (b) The preparation used to measure light intensities in the rat brain.  After positioning the head perfectly horizontally in the stereotaxic frame, a 26-g needle was slowly inserted from below at a point a few millimeters right of the trachea, until the tip of the needle passed through a hole at the base of the skull and reached a few millimeters below the cortical surface in the center of the skull opening [Fig. 1(b)]. Care was taken to stay away from major blood vessels of the cortex. An optical fiber (, graded index, Newport Inc., CA) was desheathed from its plastic insulation and cladding for about 5 cm of its tip. The fiber tip was polished flat by three different grain size sand papers in a decreasing order (3, 1, and 0.5 μm), attached to a micromanipulator facing up, and inserted through the lower end of the needle until its tip was leveled with the pial surface under the dura. The fiber tip was visible through the dura under microscopic vision. A free-air, NIR laser beam (74 mW, 830 nm, DLS-500-830FS-100, StockerYale, Canada) with a circular footprint of 0.4 mm in diameter was aimed at the fiber tip from 13.5 cm above the cortex. The light power entering the polished end of the optical fiber was measured with a photodiode and a current amplifier is connected to the other end of the fiber. The laser activation pattern and data acquisition were controlled through matlab™. A train of NIR pulses (10 ms pulse width, 25 pulses at 0.5-s intervals) was sent to the cortex while the light intensities were measured at depths from 0 to 2500 μm in steps of 50 or 100 μm from the dura. Pulsed laser was preferred over continuous exposure to avoid overheating the tissue. For each depth of the fiber tip position, the laser source was horizontally moved in a rostral or caudal direction in steps of 50 or 100 μm up to 1000 μm away from the fiber axis while repeating the light measurements. Thus, an intensity map was developed in a parasagittal plane for an area of . Due to the vertical placement of the optical fiber, photons traveling from top to bottom were collected more efficiently than those traveling in other directions. Thus, it should be noted that the light intensity measurements were directionally biased in this study. The laser intensity profile at a distance of 13.5 cm was verified using a commercial photodiode (G9842, Hamamatsu, GaAs PIN photodiode, ) as shown in Fig. 4(a) on top. The profile was Gaussian with a circular cross section. The radius was taken as the value of the Gaussian intensity curve, which is the horizontal distance where the intensity profile drops down to of its peak in the center. This diameter was equal to that of a flat profile beam with the same peak power intensity and the same total power as the Gaussian profile laser that was used. The light power that was collected by the optical fiber just underneath the dura mater was measured as the calibration value. All measurements inside the brain were normalized by this maximum light intensity level. If the fiber optic tip was broken or damaged during an experiment, it was prepared again by sand papering; then the calibration measurement was repeated and used as normalization value for further experiments. Measurements of the light power obtained by placing the fiber in air were compared with the subdural values to estimate the contribution of the dura matter to NIR light attenuation. 2.2.Data ProcessingThe average of 25 pulses in the laser train was taken as the representative light intensity measurement at the corresponding point in the brain. This averaging step substantially reduced the periodic variations due to cardiac and respiration artifacts. The trial was repeated when the animal had a sigh, which caused a small but significant mechanical displacement of the brain. The exact peak position of the light intensity profile in the horizontal direction usually occurred between two adjacent measurement points, although we decreased the step size to 50 μm near the center. Cubic spline interpretation was used to find the exact horizontal position of the maximum as well as all the other rostrocaudal points at 50 μm steps from the new horizontal zero point. 2.3.In Vitro ExperimentsThe description of in vitro experiments can be found elsewhere19 and they are summarized, here, for clarity of this paper. Seven Sprague–Dawley rats were used for in vitro measurements. The brain was explanted quickly after sacrificing the animal and placed in sucrose cutting media (0.75 mmol KCl, 0.625 mmol , 6.5 mmol , 2.5 mmol glucose, 0.25 mmol , 50.39 mmol sucrose, 0.5 mmol , ). Horizontal brain slices were cut using a Vibratome at various thicknesses from 300 to 1500 μm. The sliced samples were kept in the sucrose cutting media for less than 3 h until in vitro measurements were completed. A commercial photodiode (G9842) was used to measure the transmitted light intensity through the brain slices. The photodiode was first secured at the bottom of a plastic chamber such that the photodiode active area was even with the bottom surface. The same free-air laser source of the in vivo experiments was aimed at the surface of the tissue slab from above and aligned with the center of the photodiode. The incident light power was measured first with no neural tissue present. The brain slices were then laid out on the bottom of the chamber in direct contact with the photodiode. The samples were kept moist with normal saline during measurements, which took maximally a few minutes. The horizontal extent of the tissue sample orthogonal to the incident light beam was assumed to be sufficiently large to neglect the boundary effects. The transmittance values were obtained for various thicknesses of the gray matter samples in the center of the laser beam. 2.4.Monte Carlo SimulationsA public domain software was utilized for the Monte Carlo simulations.20 An infinitely narrow photon beam was vertically aimed at an infinitely wide tissue (Fig. 2). Each layer was characterized by the refractive index (), the absorption coefficient (), the scattering coefficient (), the anisotropy factor (), and the thickness of the layer (). The simulation software keeps a score of the photon densities on a three-dimensional grid inside the tissue (fluence) and across the surfaces of the medium boundaries, i.e., reflectance at the entry surface and transmittance on the opposite side. Fig. 2The three-dimensional model geometry for Monte Carlo simulations. Tissue slice extends infinitely in the two-dimensional (2-D) horizontal plane.  Neural tissue has an inhomogeneous structure with multiple regions of different scattering coefficients.18 From our measurement of light intensity in the cortex, it was also evident that multiple layers with varying slopes of the photon density curve existed in deep locations (). The scattering coefficient was estimated from the averaged NIR light intensity curve. The scattering coefficient was adjusted iteratively in the simulations to curve fit the light intensity values measured during the in vivo and in vitro experiments () as a function of depth in the beam center. The transmittance for an infinitely narrow beam size (Monte Carlo modeling of light transport in multi-layered tissues component of software package) was computed first and then the results were convolved (convolution program component) with the Gaussian beam profile to simulate the experimental case. Finally, the scattering coefficient was incrementally adjusted while repeating the simulations until a minimum was found for the average percent error for all depths (or slice thicknesses for the in vitro data) between the simulated () and experimental curves (). Other parameters of simulation included the following: number of photons 1,000,000, refractory index for saline and gray matter 10,18; absorption coefficient for biological tissue (Ref. 18); and anisotropy factor .10,18 All simulations were conducted on a computer with Intel 2.3 GHz processor and each run took less than 3 min. 3.Results3.1.In Vivo ExperimentsPhoton density decreased exponentially with depth from the dura at the center of the laser beam (Fig. 3). Photon densities were at 100 μm and () at 3000 μm into the cerebrum. In order to exclude the effect of the dura, the light intensities were plotted in percentages as a fraction of the subdural light intensity in the beam center. This was necessary to factor out the large variations we noticed in the dura thickness and the subdural light intensities between the animals. Light attenuation by the dura was calculated separately and found to be by comparing the subdural and in-air measurements. Results obtained from postmortem animals (red curve in Fig. 3) were significantly different () from that of the alive photon densities between 100 and 1500 μm. Fig. 3The average NIR light intensity inside the brain as a function of depth at the center of the laser beam. (×) Average data from 16 penetrations in nine live animals and (▪) data shortly after termination in six animals. (Δ) Average in vitro transmittance as a function of slice thickness (). The in vivo light intensities from 1500 to 3000 μm are reported in the inset on a larger vertical scale. 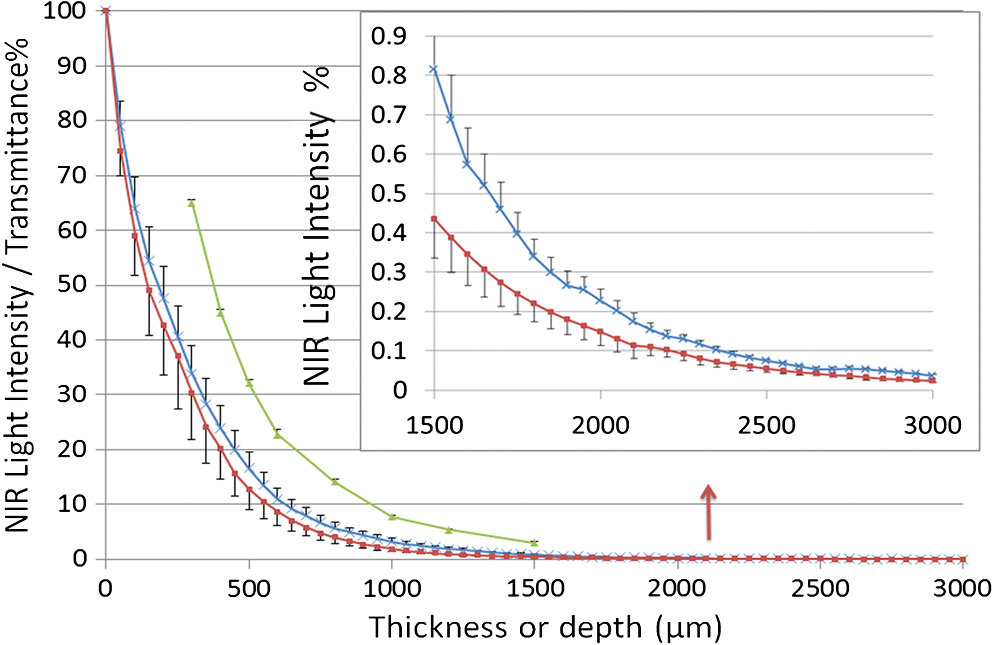 Figure 4(a) shows the two-dimensional (2-D) illumination profile in the parasagittal plane of the measurements. In the horizontal direction near the surface, the light intensity profile drops quickly, almost following a similar course to the laser intensity. In deeper locations, however, the light intensity profile becomes more spread horizontally [Fig. 4(b)]. The illumination contours extend a few times the laser diameter in the vertical direction and becomes wider at depths, resembling the shape of a bulb. A possible explanation for this shape is that the scattering increases in deeper regions of the brain. Fig. 4(a) Two-dimensional illumination inside the rat brain in a parasagittal plane. Results shown are the average data from four animals. Measurements were made in steps of 100 μm in the vertical and horizontal directions and then interpolated for intermediate points. The light intensities are normalized by the intensity measured subdurally in the beam center and expressed on a logarithmic scale. Measurements were made in half the plane since the data are vertically symmetrical. The bell shaped curve on the top shows the laser intensity profile at the dura surface. (b) Horizontal spread of the illumination profile at 2100 μm from dura.  3.2.In Vitro ExperimentsThe transmittance measurement for each slice thickness was obtained by averaging measurements from seven animals (green curve in Fig. 3). Specifically, the transmittance values were , , , , , , , and () at thicknesses of 300, 400, 500, 600, 800, 1000, 1200, and 1500 μm respectively. These in vitro values were much larger than the light intensities obtained from live and postmortem animals (paired -test, ). Note that the in vitro experiments were normalized with the light intensity received by the photodiode without any tissue present, whereas in vivo measurements were normalized to the subdural light intensity. Using the Fresnel equation [, where for air and for neural], the reflection for a light beam entering the tissue perpendicularly was calculated as 2.55%, and neglected in the in vitro plot. This means the reflected light at the surface of entry was lumped into the attenuation by the tissue. 3.3.Monte Carlo SimulationsThe scattering coefficient for in vitro samples was estimated by fitting simulated transmittance curves to the measured values and found to be .19 The average deviation from the experimental curve was 9.9% for the optimal fit. The mean error would approximately double if the scattering coefficient was set to 90 or on each side of the optimal value. Thus, the optimal value of () clearly produced the minimum error within this range. Simulations were repeated using two extreme values of absorption coefficient to investigate the effect of on transmittance.18 The average deviation from the in vitro transmittance curve was 9.4% at and , which was smaller than the mean error at optimal . This indicated that had a minimal effect on the simulated transmittance. Therefore, we varied the scattering coefficient alone and fixed at a typical value of (Ref. 21) in further simulations. The scattering coefficient was estimated also from in vivo data using the Monte Carlo method. This time, however, the curves appeared to have multiple regions with different exponentials. Figure 5 depicts the goodness of the fit using three different values of the scattering coefficient (, 175, or ). Two main regions with different optical properties existed as shown in the figure; first from the surface down to 1500 μm and the second from 1500 to 3000 μm. The photon intensity curve could be approximated with a single scattering coefficient () in the first region with an average error of 7.42% only. If the measurements at 100 to 400 μm were excluded, the average error would reduce to 3.81%. In the second region, multiple layers with different coefficients were present. The average deviations from the experimental curve were 77.5%, 36.5%, and 31.2% for scattering coefficient values of 125, 175, , respectively. Each scattering value was good only for a small section of the curve but not for the entire range. We concluded that the optimal scattering coefficient varied between 125 and at depths of 1500 to 3000 μm in the rat brain. Fig. 5Photon density simulations using different scattering coefficients. The simulated values are fitted to the experimental group averages by adjusting the scattering coefficient. Experimental data (•, blue), simulated data using (×), (Δ), and (▪). The data points from 1000 to 3000 μm are reported in the inset on a larger vertical scale.  4.DiscussionIn this study, we report direct measurements of photon density inside a rodent brain under a beam of NIR laser exposure. The results are compared to in vitro transmittance measurements from neural tissue slices and the scattering coefficients were predicted using Monte Carlo simulations. Overall, the intensity decreases exponentially by depth in the beam center, although multiple regions exist in the curve suggesting different scattering coefficients. These regions with different optical properties most probably correspond to the gray matter of the cortex and the underlying white matter of the brain. The in vitro transmittance values were larger than the light intensities obtained in vivo from live and postmortem animals (Fig. 3). The discrepancies can be attributed to the differences between the in vivo experimental setup and the in vitro sample preparation techniques. Small amounts of blood residue on the dura surface and the mechanical displacement of the brain due to breathing and cardiac pulsation might have contributed to the variations observed in the in vivo measurements. Data from postmortem animals were slightly different from that of the live animals suggesting that the optical properties of neural tissue change when the arterial blood pressure diminishes. The light intensity profile followed an exponential decline with an initial phase that could be simulated with a single scattering coefficient up to 1500 μm. Excluding the first few points lowered the estimation error. Outliers at the superficial layers may be due to the contribution of the dura matter, which was not characterized in this study. A single scattering coefficient can probably represent the optical properties from 0 to 1500 μm where the brain cortex predominantly has cell bodies. The data suggest that the scattering coefficient begins to increase at the border of gray and white matter and continues to increase gradually within the white matter. It was reported that the gray matter inside the rat brain cortex extends from the surface down to 1 to 2 mm.18 Our results suggest that the border of gray and white matter is located at a depth of . The profile obtained from the in vitro samples had a simple exponential decrease as well, except at the beginning of the curve. Obtaining brain slices below 300 μm in thickness was not possible without compromising the intactness of the tissue samples. The estimated scattering coefficients for the rat brain tissue were within the ranges reported in the literature. Johns et al. reported the reduced scattering coefficient value () as 10 to (which corresponds to a scattering coefficient () of 100 to for ) in the rat brain tissue while the detector was moving from gray to white matter.18 They found the of the white matter to be a little higher (35 to ). Scattering coefficients reported in the literature for human brain tissue also vary within a large range. Yaroslavsky et al. found the for the human gray matter to be around at 850 nm in vitro.15 Gottschalk et al. reported also for the human brain gray matter to be 364 and at 675 and 1064 nm, respectively.22 It is difficult to make a comparison even between the rat and human gray matter with these reported scattering coefficients differing between 4- and 6-folds within each species. Sample preparation technique is very important in measurements of optical tissue properties in vitro. We believe that the data presented in this report are more realistic because the measurements were made in live animals. Roggan et al.23 found that both shock and slow freezing procedures alter the optical properties of biological tissue. The freezing procedure changes the optical properties by damaging the tissue due to mechanical forces generated by ice crystals. Chan et al. observed that compressing the tissue between microscope slides also alters the optical properties,24 and thus we abandoned the usage of microscope slides for the in vitro part of this study. On the other hand, the in vivo techniques of this study may have other shortcomings. Insertion of a 100 μm fiber optic into the brain tissue might have caused breaking of microvessels and cellular damage. The interstitial liquid that was oozing slowly at the lower end of the inserted needle was clear, suggesting that microvessel bleeding was minimal. The track left behind as the fiber was being lowered in the cortex was collapsing in each trial, which could be verified under microscopic vision through the dura. Therefore, the integrity of the tissue structure was presumably not compromised by the optical fiber to the level that would affect the reproducibility of the measurements. The light intensity profiles in a 2-D vertical plane led to some additional observations. The penetration in the direction of the beam is much larger than its spread in the radial direction. This forward biasing of the profile is mostly due to the high anisotropy factor () of neural tissue. Another contributing factor might be the directionally biased cone of reception of the optical fiber. The tip of the glass fiber, a flat circular surface, was positioned upward facing the NIR beam. The light photons coming towards the tip in the normal direction can enter the fiber with only a small percentage of them being reflected at the interface. However, because glass has a higher refractory index than tissue, more and more photons reflect back into tissue with increasing incident angles from normal and all the photons reflect coming tangential to the surface (Fresnel equation). This drawback is difficult to overcome since optical sensors and light guides in general have a nonuniform cone of reception. This directional bias in photon collection might have caused the dark regions on each side of the 2-D plot near the dura, if the light photons are mostly traveling at smaller angles to the horizontal axis in these regions. A glass surface, however, well mimics the case that we have with the optically activated microstimulators with a silicon nitrite coating over the light receiving window.2 The main objective of this study was to estimate the light energy that will be collected by the optical microstimulators at various depths of implantation inside the neural tissue. The dark regions in Fig. 4 also suggest that the energy transfer efficiency may be sensitive to horizontal movements of the laser beam with respect to the implanted device in the locations near the surface. On the other hand, experimental results in the rat spinal cord with implants at a depth of 2.35 mm showed that the light intensity needs to be increased only by a factor of four for 1000 μm horizontal displacement of the source (Fig. 9 in Ref. 2). This roughly agrees with the horizontal spread of the intensity plot in Fig. 4(b) taken at a depth of 2.1 mm. In conclusion, the light energy harvested by the implant should be much less sensitive to lateral movements of the source for deeper implant locations due to spreading of the beam in the horizontal direction. AcknowledgmentsThis study was supported by NIBIB, National Institute of Health (R01 EB009100). We thank Dr. Bryan Pfister for his help with in vitro slice preparations and Dr. Tara Alvarez for commenting on the manuscript. ReferencesA. AbdoM. Sahin,
“Feasibility of neural stimulation with floating-light-activated microelectrical stimulators,”
IEEE Trans. Biomed. Circ. Syst., 5
(2), 179
–188
(2011). http://dx.doi.org/10.1109/TBCAS.2011.2114882 Google Scholar
A. Abdoet al.,
“Floating light-activated microelectrical stimulators tested in the rat spinal cord,”
J. Neural Eng., 8
(5), 056012
(2011). http://dx.doi.org/10.1088/1741-2560/8/5/056012 1741-2560 Google Scholar
A. Abdoet al.,
“Intraspinal stimulation with light activated micro-stimulators,”
546
–549
(2011). Google Scholar
R. BiranD. C. MartinP. A. Tresco,
“The brain tissue response to implanted silicon microelectrode arrays is increased when the device is tethered to the skull,”
J. Biomed. Mater. Res. A, 82
(1), 169
–178
(2007). Google Scholar
J. F. Hetkeet al.,
“Silicon ribbon cables for chronically implantable microelectrode arrays,”
IEEE Trans. Biomed. Eng., 41
(4), 314
–321
(1994). http://dx.doi.org/10.1109/10.284959 IEBEAX 0018-9294 Google Scholar
F. W. Koehleret al.,
“Near infrared spectroscopy: the practical chemical imaging solution,”
Spectrosc. Eur., 14
(3),
(2002). SPEUEF 0966-0941 Google Scholar
K. D. Desmetet al.,
“Clinical and experimental applications of NIR-LED photobiomodulation,”
Photomed. Laser Surg., 24
(2), 121
–128
(2006). http://dx.doi.org/10.1089/pho.2006.24.121 PLDHA8 1549-5418 Google Scholar
Q. Zhanget al.,
“Study of near infrared technology for intracranial hematoma detection,”
J. Biomed. Opt., 5
(2), 206
–213
(2000). http://dx.doi.org/10.1117/1.429988 JBOPFO 1083-3668 Google Scholar
Y. Lamplet al.,
“Infrared laser therapy for ischemic stroke: a new treatment strategy—results of the NeuroThera Effectiveness, and Safety Trial-1 (NEST-1),”
Stroke, 38
(6), 1843
–1849
(2007). http://dx.doi.org/10.1161/STROKEAHA.106.478230 SJCCA7 0039-2499 Google Scholar
P. Gurnani, Near Infrared Spectroscopic Measurement of Human and Animal Brain Structures, University of Texas at Arlington, Texas
(2003). Google Scholar
W. F. CheongS. A. PrahlA. J. Welch,
“A review of the optical properties of biological tissues,”
IEEE J. Quantum Electron., 26
(12), 2166
–2185
(1990). http://dx.doi.org/10.1109/3.64354 IEJQA7 0018-9197 Google Scholar
J. S. Damet al.,
“Multiple polynomial regression method for determination of biomedical optical properties from integrating sphere measurements,”
Appl. Opt., 39
(7), 1202
–1209
(2000). http://dx.doi.org/10.1364/AO.39.001202 APOPAI 0003-6935 Google Scholar
J. D. BronzinoJ. D. EnderleS. M. Blanchard, Introduction to Biomedical Engineering, 2nd ed.Elsevier, Burlington, MA
(2005). Google Scholar
R. W. BergD. Kleinfeld,
“Vibrissa movement elicited by rhythmic electrical microstimulation to motor cortex in the aroused rat mimics exploratory whisking,”
J. Neurophysiol., 90
(5), 2950
–2963
(2003). http://dx.doi.org/10.1152/jn.00511.2003 JONEA4 0022-3077 Google Scholar
A. N. Yaroslavskyet al.,
“Optical properties of selected native, and coagulated human brain tissues in vitro in the visible, and near infrared spectral range,”
Phys. Med. Biol., 47
(12), 2059
–2073
(2002). http://dx.doi.org/10.1088/0031-9155/47/12/305 PHMBA7 0031-9155 Google Scholar
L. ZhangA. ShiH. Lu,
“Determination of optical coefficients of biological tissue from a single integrating-sphere,”
J. Mod. Opt., 59
(2), 121
–125
(2012). http://dx.doi.org/10.1080/09500340.2011.631052 JMOPEW 0950-0340 Google Scholar
H. R. EggertV. Blazek,
“Optical properties of human brain tissue, meninges, and brain tumors in the spectral range of 200 to 900 nm,”
Neurosurgery, 21
(4), 459
–464
(1987). NEQUEB Google Scholar
M. Johnset al.,
“Determination of reduced scattering coefficient of biological tissue from a needle-like probe,”
Opt. Express, 13
(13), 4828
–4842
(2005). http://dx.doi.org/10.1364/OPEX.13.004828 OPEXFF 1094-4087 Google Scholar
A. AbdoB. PfisterM. Sahin,
“Scattering coefficient and penetration depth of NIR light in the rat brain gray matter,”
in Neural Interface Conference,
(2012). Google Scholar
L. V. Wang,
“Monte Carlo simulation package: modeling of photon transport in multi-layered tissues,”
http://labs.seas.wustl.edu/bme/Wang/mc.html Google Scholar
G. PalumboR. Pratesi, Lasers, and Current Optical Techniques in Biology, The Royal Society of Chemistry, Cambridge, UK
(2004). Google Scholar
W. Gottschalk,
“Ein messverfahren zur bestimmung der optischen parameter biologischer Gevebe in vitro,”
Universitaet Fridriciana, Karlsruhe,
(1992). Google Scholar
A. Rogganet al.,
“Determination of optical tissue properties with double integrating sphere technique and Monte Carlo simulations,”
Proc. SPIE, 2100 179026
(1994). http://dx.doi.org/10.1117/12.179026 PSISDG 0277-786X Google Scholar
E. K. Chanet al.,
“Effects of compression on soft tissue optical properties,”
IEEE J. Sel. Top. Quantum Electron., 2
(4), 943
–950
(1996). http://dx.doi.org/10.1109/2944.577320 IJSQEN 1077-260X Google Scholar
|


